Copyright
©The Author(s) 2016.
World J Gastrointest Surg. Mar 27, 2016; 8(3): 274-283
Published online Mar 27, 2016. doi: 10.4240/wjgs.v8.i3.274
Published online Mar 27, 2016. doi: 10.4240/wjgs.v8.i3.274
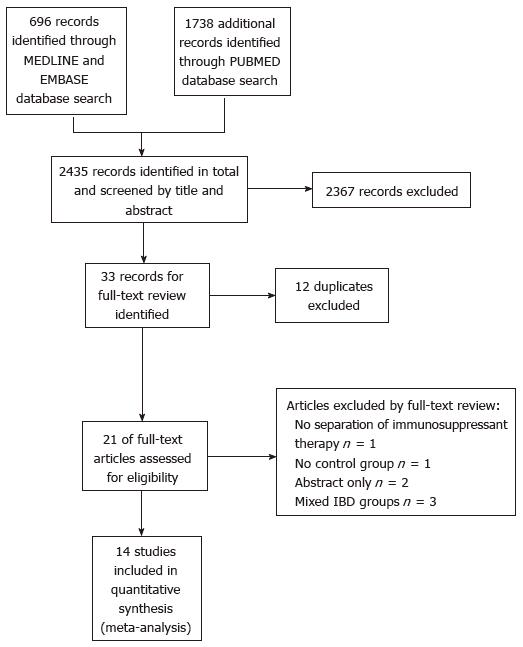
Figure 1 Preferred reporting items for systematic reviews and meta-analyses reporting diagram.
IBD: Inflammatory bowel disease.
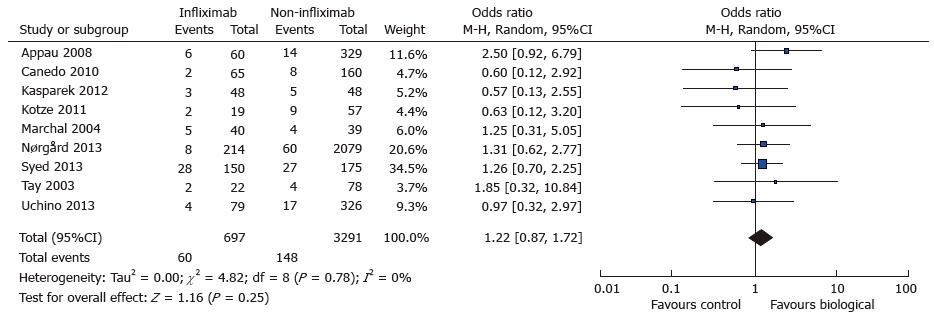
Figure 2 Total infectious complications: Study event rates and forest plot.
Forest plot showing significantly higher total infective complications in patients receiving biological therapy - note confidence interval does not overlap one.
Figure 3 Postoperative abdominal sepsis: Study event rates and forest plot.
Figure 4 Anastomotic leak: Study event rates and forest plot.
Figure 5 Wound infection: Study event rates and forest plot.
Lone outlier study (Uchino 2013) visible on forest plot.
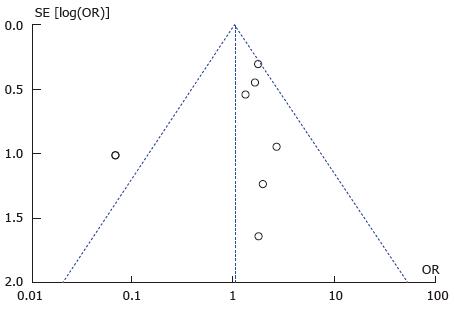
Figure 6 Wound infection: Funnel plot with outlier.
A single statistical outlier visible outside the funnel plot suggestive of possible publication bias.
Figure 7 Wound infection: Modified study event rates and forest plot.
Figure 8 Re-operation: Study event rates and forest plot.
- Citation: Waterland P, Athanasiou T, Patel H. Post-operative abdominal complications in Crohn’s disease in the biological era: Systematic review and meta-analysis. World J Gastrointest Surg 2016; 8(3): 274-283
- URL: https://www.wjgnet.com/1948-9366/full/v8/i3/274.htm
- DOI: https://dx.doi.org/10.4240/wjgs.v8.i3.274


