Copyright
©The Author(s) 2016.
World J Gastrointest Surg. Nov 27, 2016; 8(11): 761-765
Published online Nov 27, 2016. doi: 10.4240/wjgs.v8.i11.761
Published online Nov 27, 2016. doi: 10.4240/wjgs.v8.i11.761
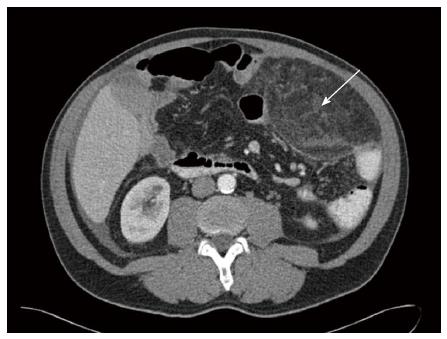
Figure 1 Transverse abdominal computed tomography scan with a tumor mass (15 cm × 8.
8 cm × 7.8 cm, white arrow) in the upper left hemiabdomen. The mass shows increased density in comparison to normal fat and a tumoral pseudocapsule.
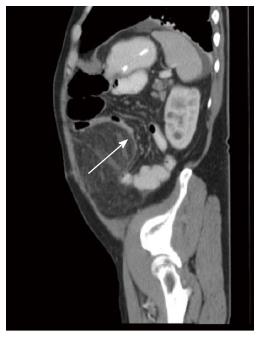
Figure 2 Sagittal abdominal computed tomography scan with an unclear mass in the omental fat with obstruction of the small intestine (white arrow).
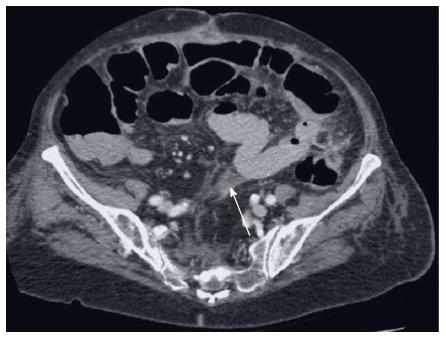
Figure 3 Transverse abdominal computed tomography scan as the gold standard with an inflammation of the mesenterium at the height of the navel.
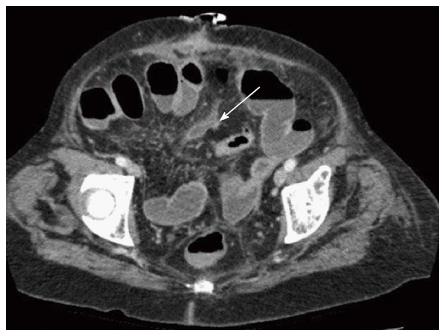
Figure 4 Transverse abdominal computed tomography scan shows a nonspecific inflammatory process involving the adipose tissue of the small bowel mesentery.
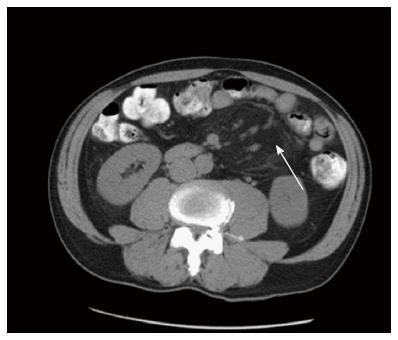
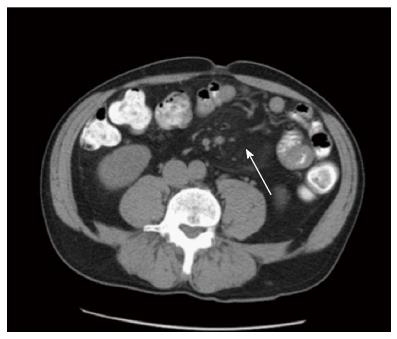
Figure 5 Inflammation of the small bowel adipose tissue formed as a pseudotumor in the left abdomen in the transverse abdominal computed tomography (white arrow).
Figure 6 Signs of sclerosing mesenteritis with lymphadenopathy in the lower left abdomen in the transverse abdominal computed tomography (white arrow).
- Citation: Klasen J, Güller U, Muff B, Candinas D, Seiler CA, Fahrner R. Treatment options for spontaneous and postoperative sclerosing mesenteritis. World J Gastrointest Surg 2016; 8(11): 761-765
- URL: https://www.wjgnet.com/1948-9366/full/v8/i11/761.htm
- DOI: https://dx.doi.org/10.4240/wjgs.v8.i11.761


