Copyright
©The Author(s) 2016.
World J Gastrointest Surg. Oct 27, 2016; 8(10): 693-699
Published online Oct 27, 2016. doi: 10.4240/wjgs.v8.i10.693
Published online Oct 27, 2016. doi: 10.4240/wjgs.v8.i10.693
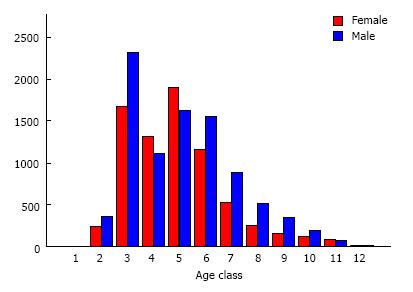
Figure 1 Age class and sex distribution.
1: 0-1; 2: 1-6; 3: 7-13; 4: 14-17; 5: 18-25; 6: 26-35; 7: 36-45; 8: 46-55; 9: 56-65; 10: 66-75; 11: 76-85; 12: > 85.
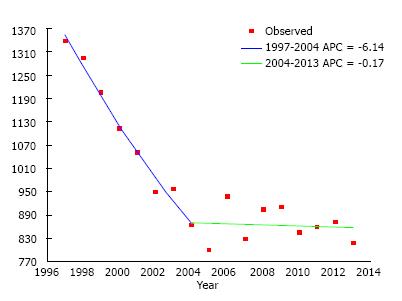
Figure 2 Number of patients discharged with acute appendicitis diagnosis during the years.
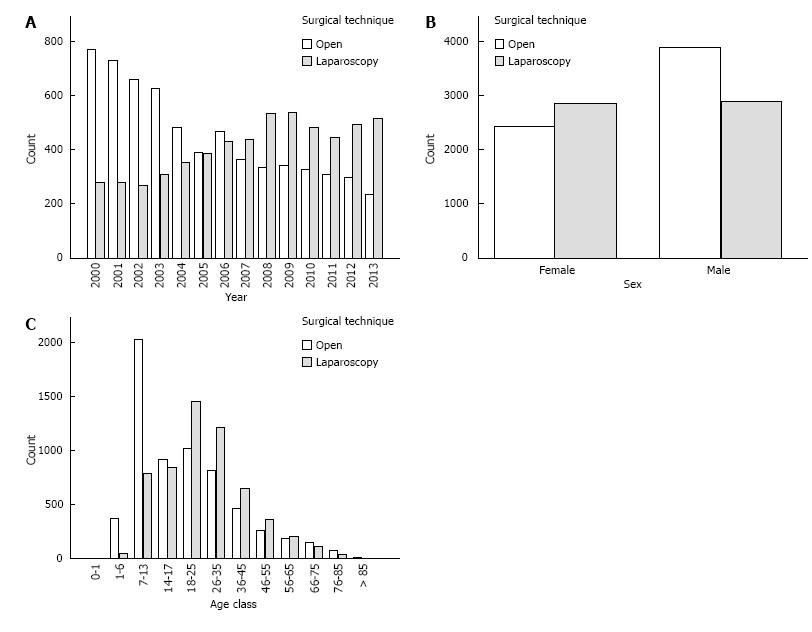
Figure 3 Surgical technique during the years (A), between sex (B) and among age classes (C).
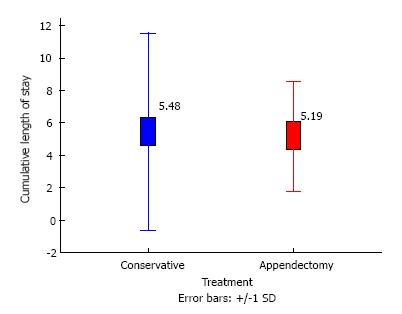
Figure 4 Cumulative length of stay between treatment options.
Data are expressed in days (SD).
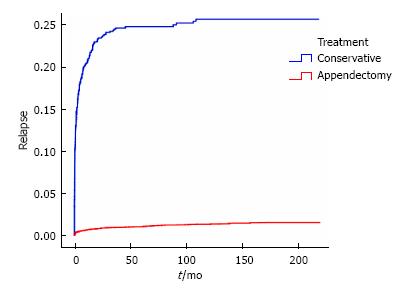
Figure 5 Kaplan-Meyer curve of failure of conservative treatment (blue line) and incidence of intestinal obstruction in operated patients (red line).
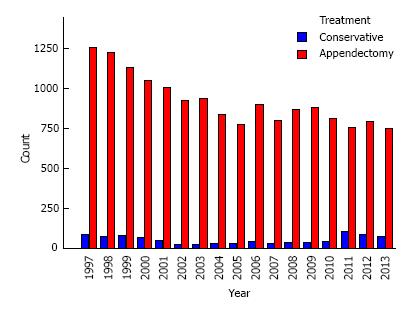
Figure 6 Treatment option during the years.
- Citation: Ceresoli M, Zucchi A, Allievi N, Harbi A, Pisano M, Montori G, Heyer A, Nita GE, Ansaloni L, Coccolini F. Acute appendicitis: Epidemiology, treatment and outcomes- analysis of 16544 consecutive cases. World J Gastrointest Surg 2016; 8(10): 693-699
- URL: https://www.wjgnet.com/1948-9366/full/v8/i10/693.htm
- DOI: https://dx.doi.org/10.4240/wjgs.v8.i10.693


