Copyright
©The Author(s) 2025.
World J Gastrointest Surg. Aug 27, 2025; 17(8): 109884
Published online Aug 27, 2025. doi: 10.4240/wjgs.v17.i8.109884
Published online Aug 27, 2025. doi: 10.4240/wjgs.v17.i8.109884
Figure 1 A schematic diagram of ultrasound measurement of liver and spleen stiffness.
A: Liver sound touch quantify (STQ); B: Spleen STQ.
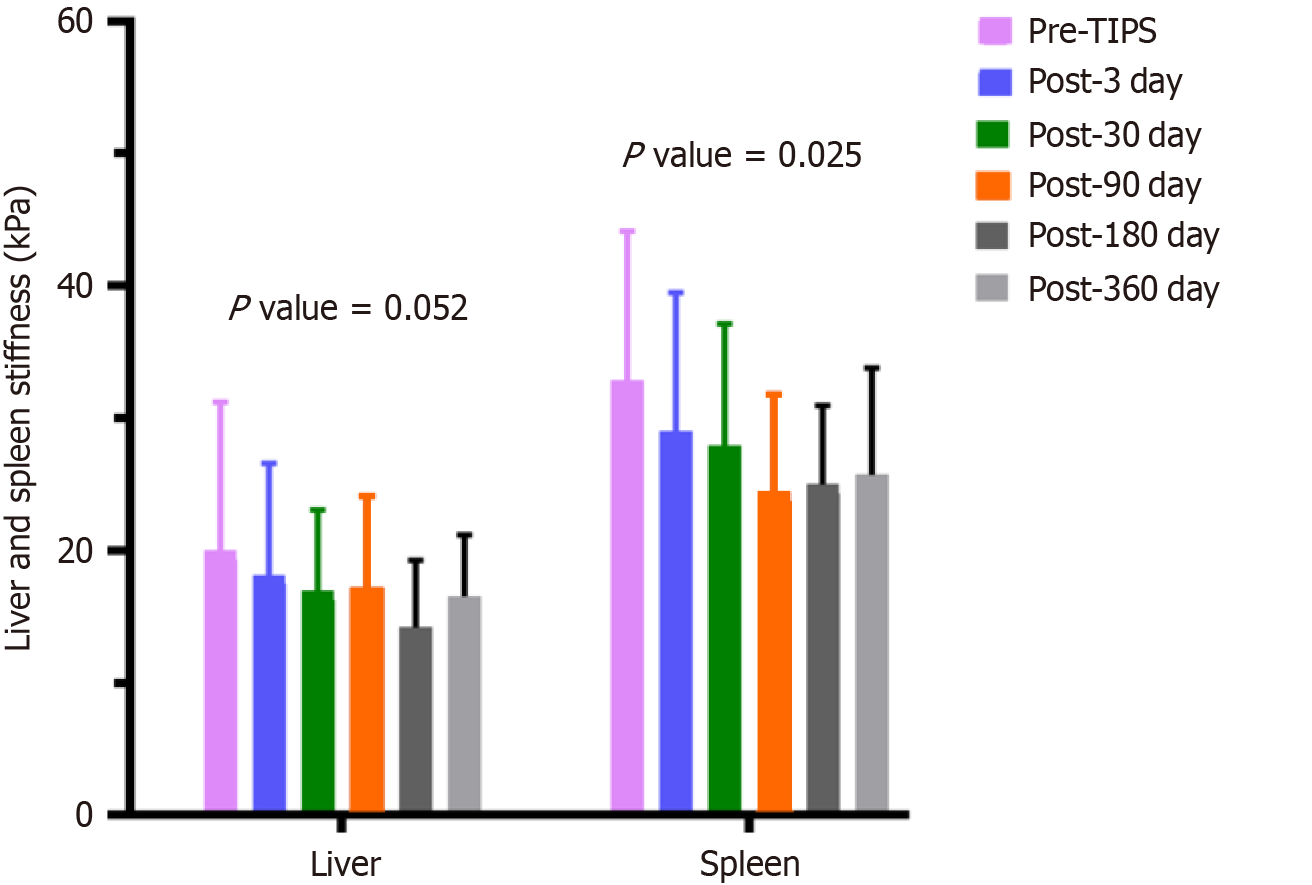
Figure 2 Change of liver and spleen stiffness pre- and post-transjugular intrahepatic portosystemic shunt.
TIPS: Transjugular intrahepatic portosystemic shunt.
Figure 3 Correlation scatter plot between preoperative portal pressure gradient and liver and spleen stiffness.
A: Liver sound touch quantify (STQ); B: Spleen STQ. PPG: Preoperative portal pressure gradient; STQ: Sound touch quantify.
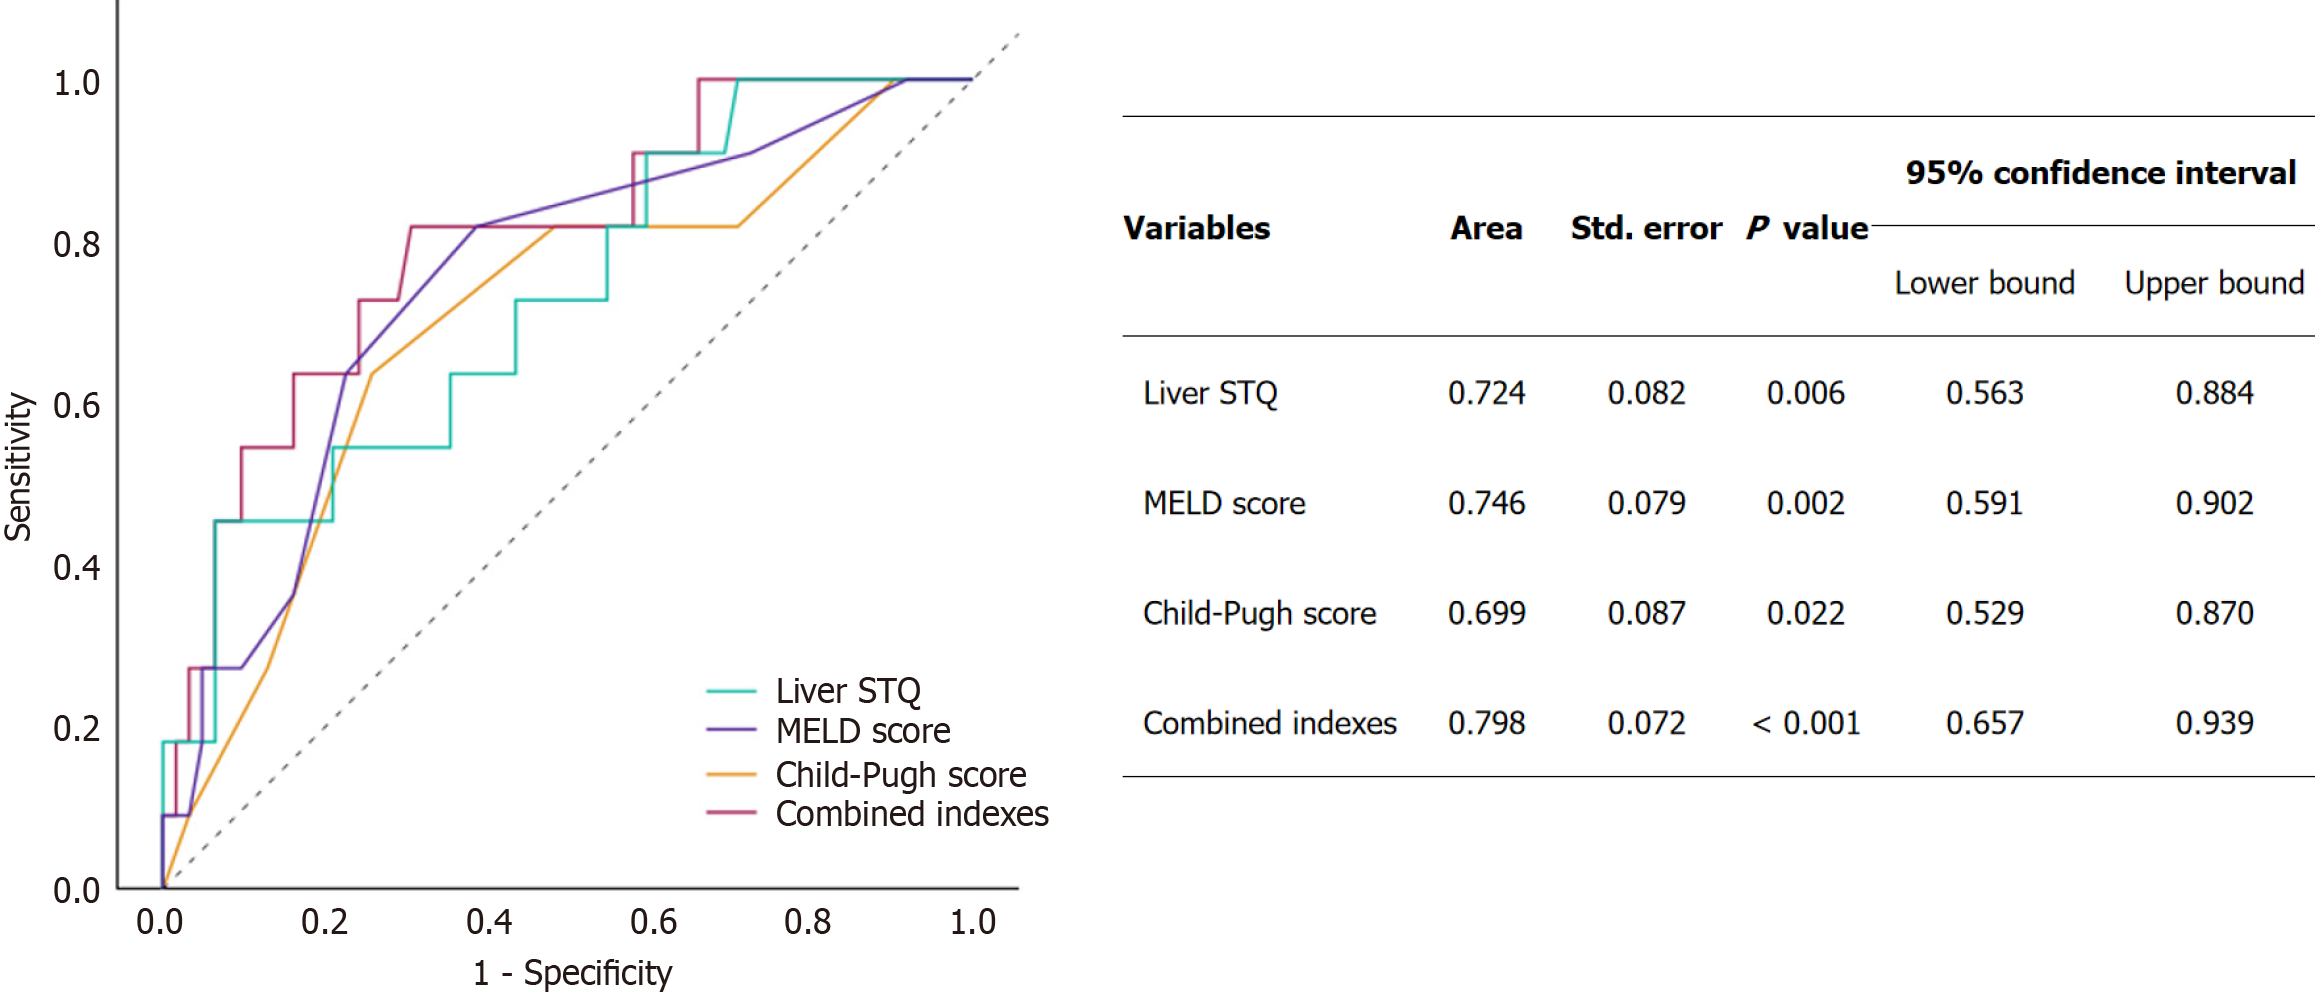
Figure 4 Receiver operating characteristic curves of the probability of liver sound touch quantify in predicting prognosis of cirrhotic and portal hypertension patients after transjugular intrahepatic portosystemic shunt.
STQ: Sound touch quantify; MELD: Model for end-stage liver disease.
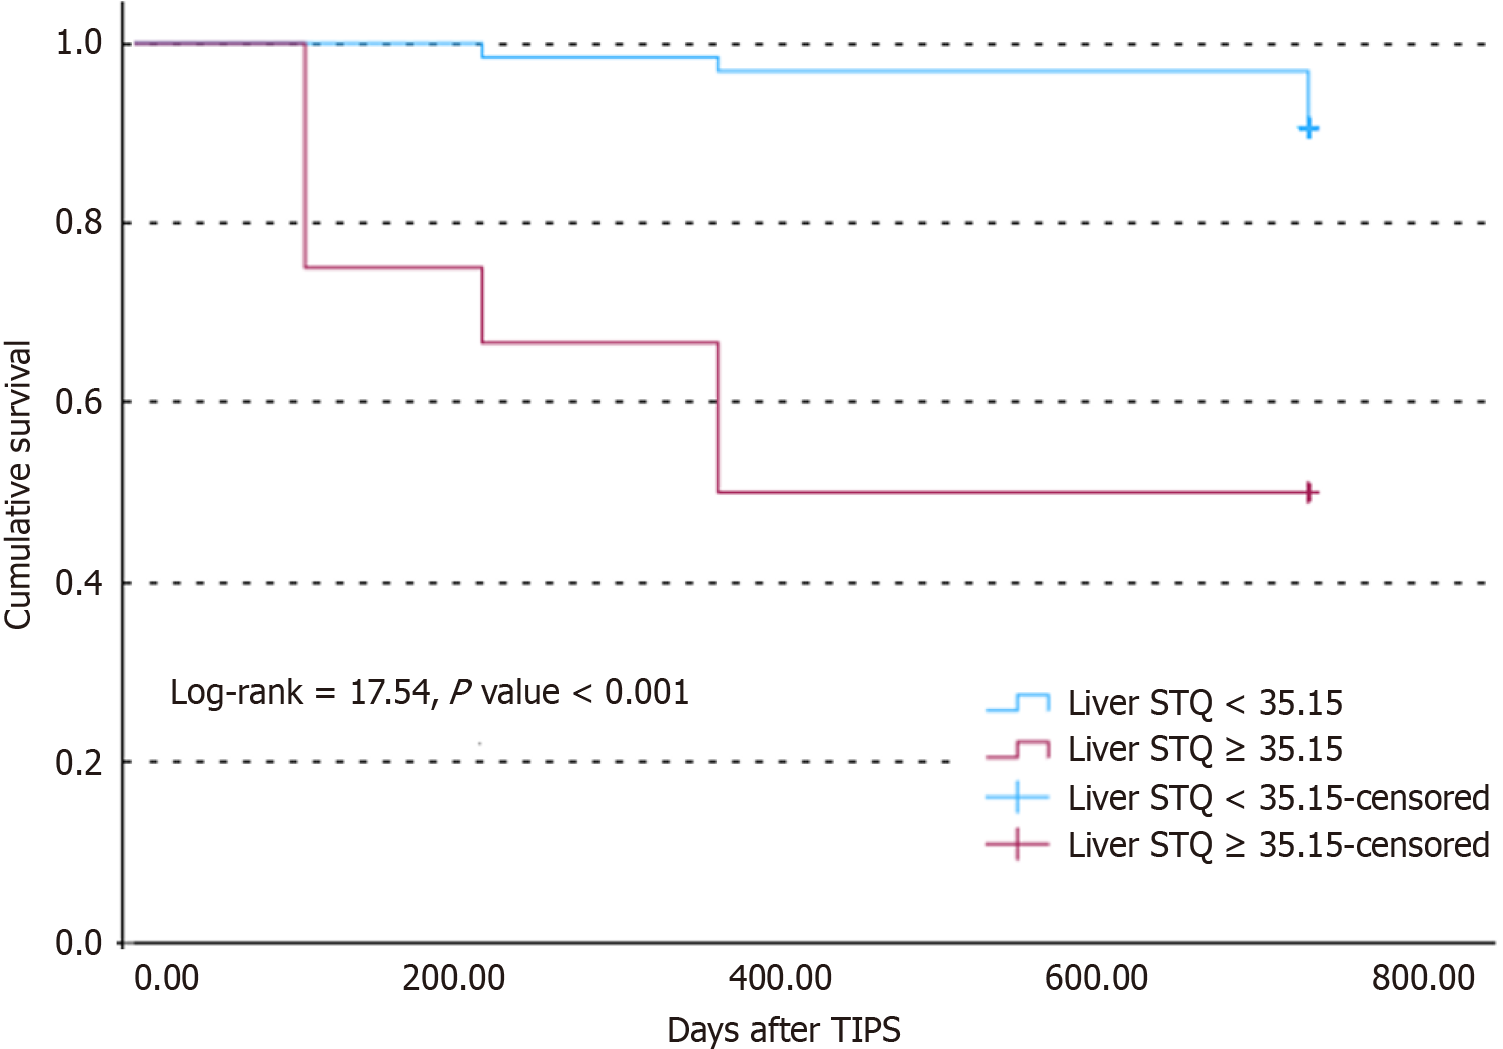
Figure 5 Kaplan-Meier survival curves of patients with cirrhotic and portal hypertension after transjugular intrahepatic portosystemic shunt by liver sound touch quantify distribution.
TIPS: Transjugular intrahepatic portosystemic shunt; STQ: Sound touch quantify.
- Citation: Liu XF, Huang XC, Ye QJ, Yuan LJ, Gao GF, Li JY, Feng DP. Changes in liver and spleen stiffness after transjugular intrahepatic portosystemic shunt and their relationship with prognosis. World J Gastrointest Surg 2025; 17(8): 109884
- URL: https://www.wjgnet.com/1948-9366/full/v17/i8/109884.htm
- DOI: https://dx.doi.org/10.4240/wjgs.v17.i8.109884


