Copyright
©The Author(s) 2025.
World J Gastrointest Surg. Jun 27, 2025; 17(6): 106155
Published online Jun 27, 2025. doi: 10.4240/wjgs.v17.i6.106155
Published online Jun 27, 2025. doi: 10.4240/wjgs.v17.i6.106155
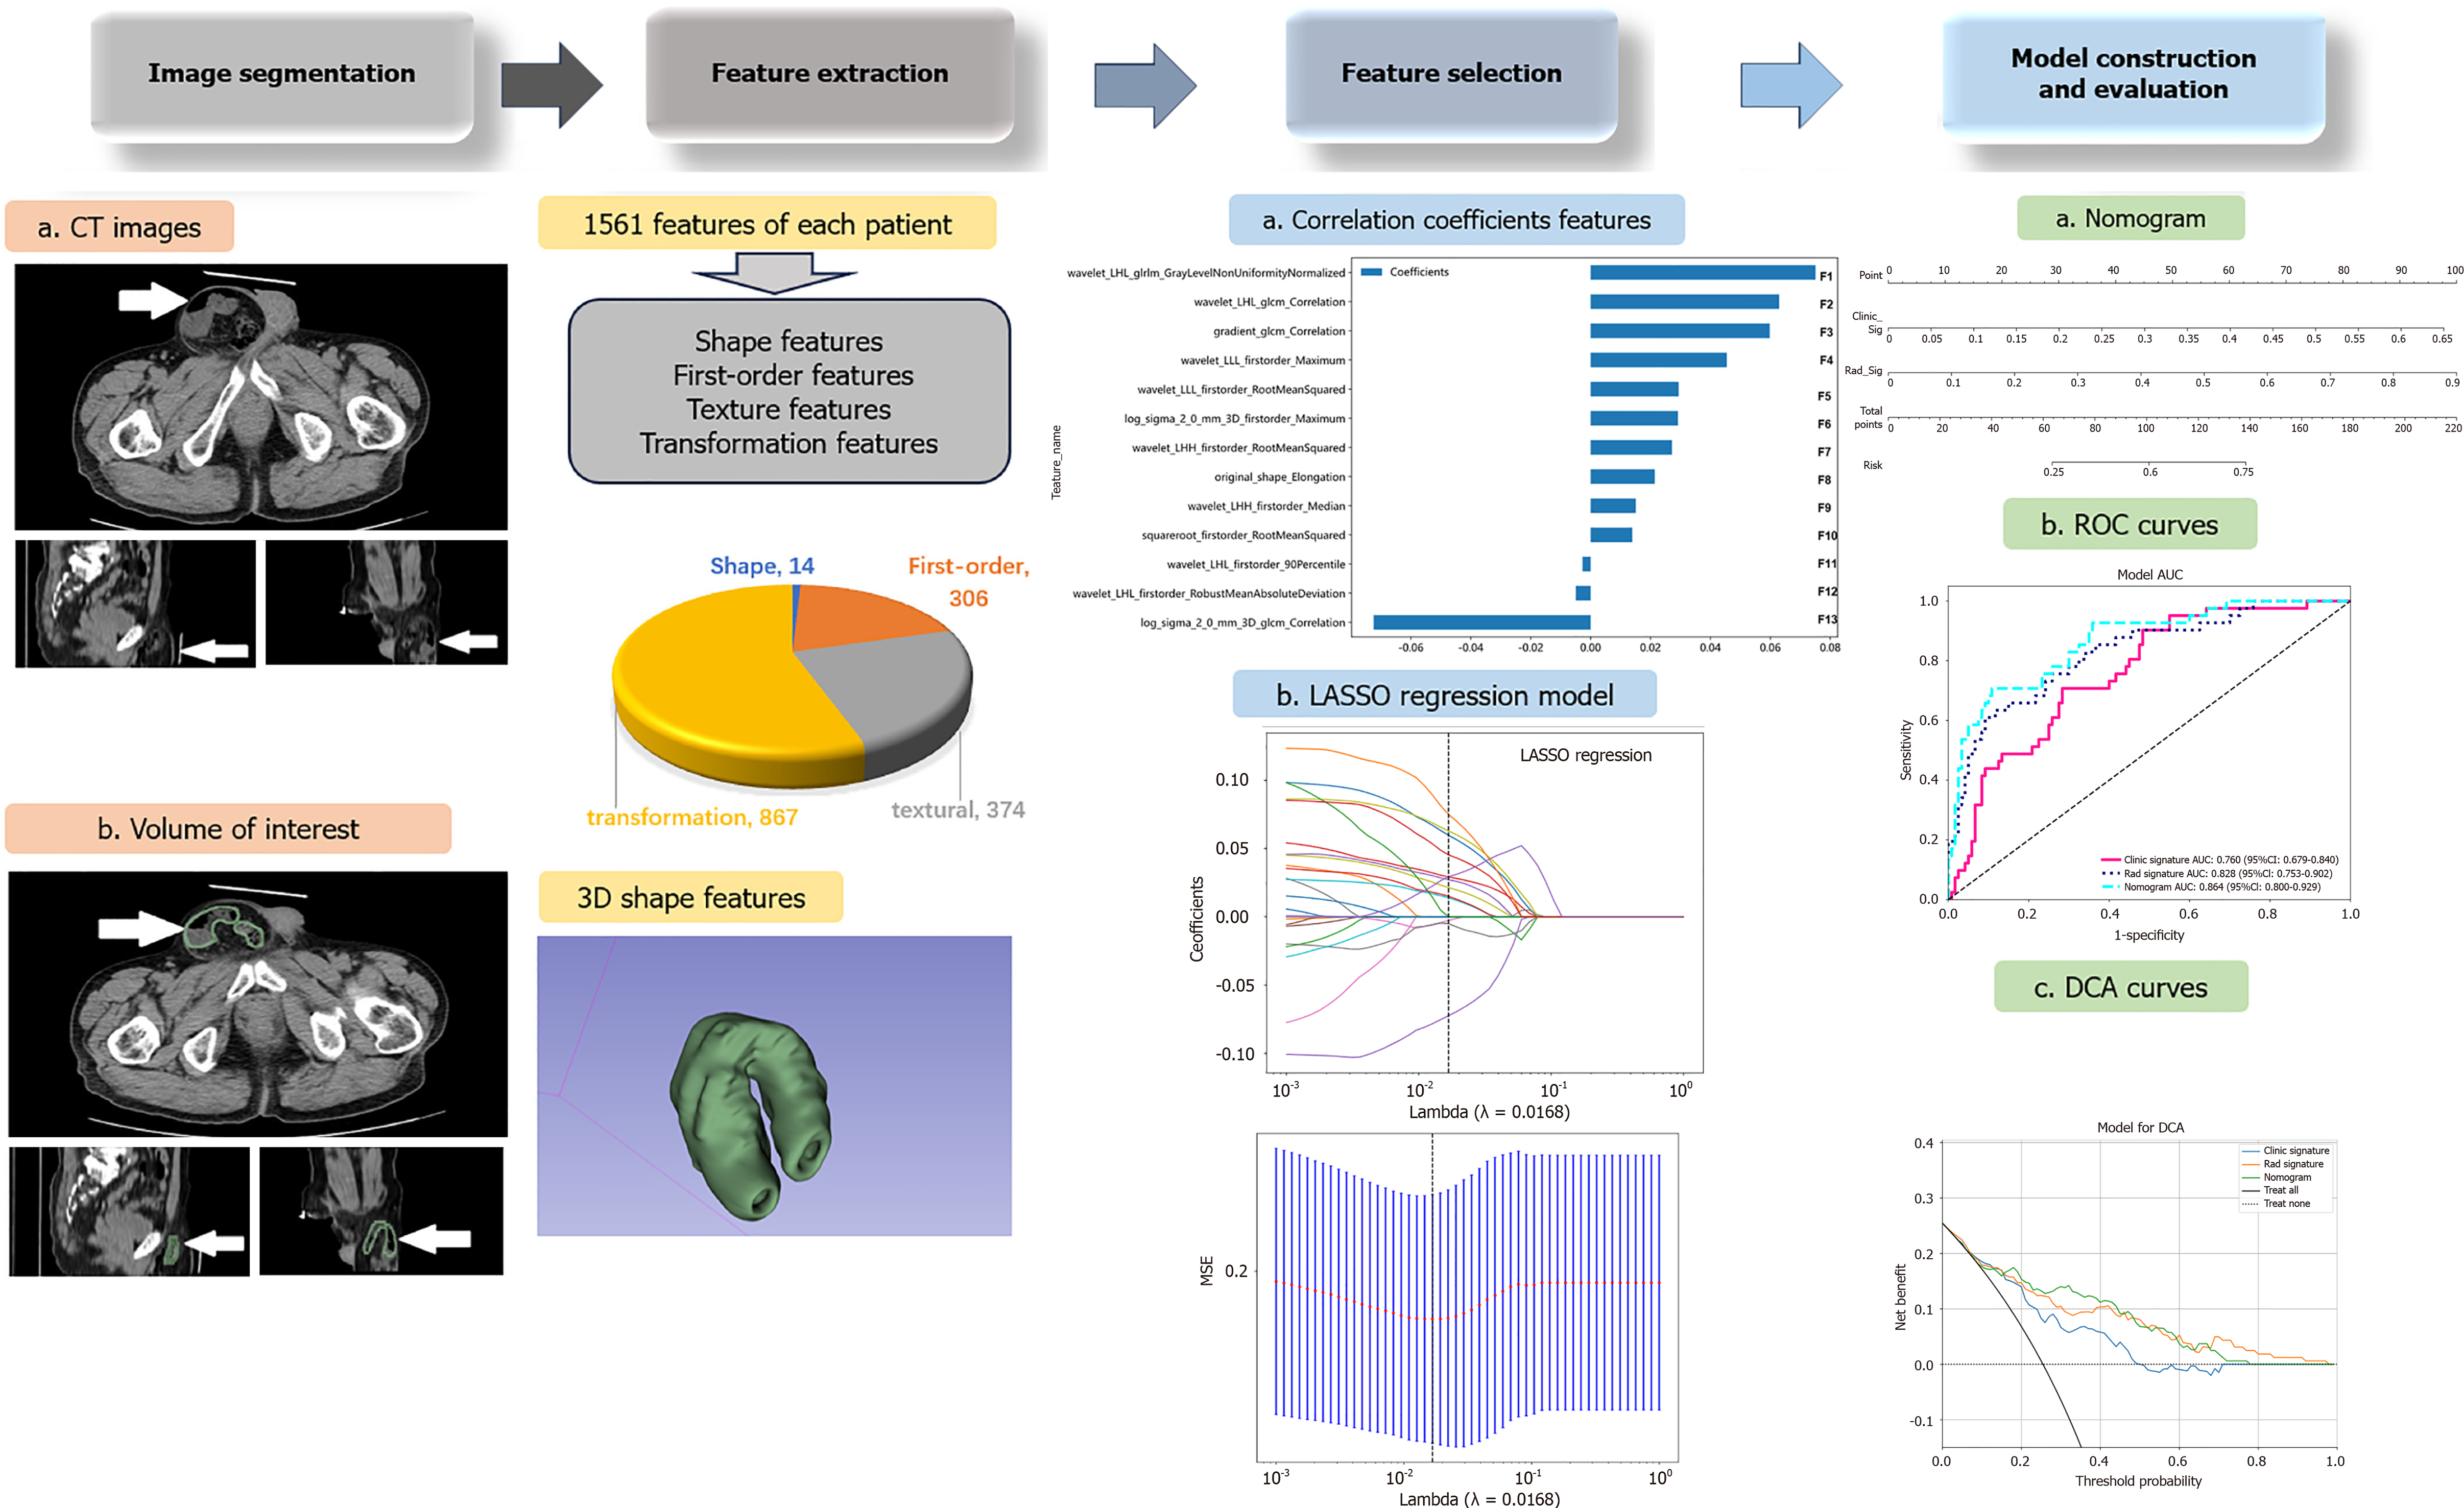
Figure 1 Workflow of the radiomic analysis.
CT: Computed tomography; 3D: Three-dimensional; LASSO: Least absolute shrinkage and selection operator; ROC: Receiver operating characteristic; AUC: Area under the curve; DCA: Decision curve analysis.
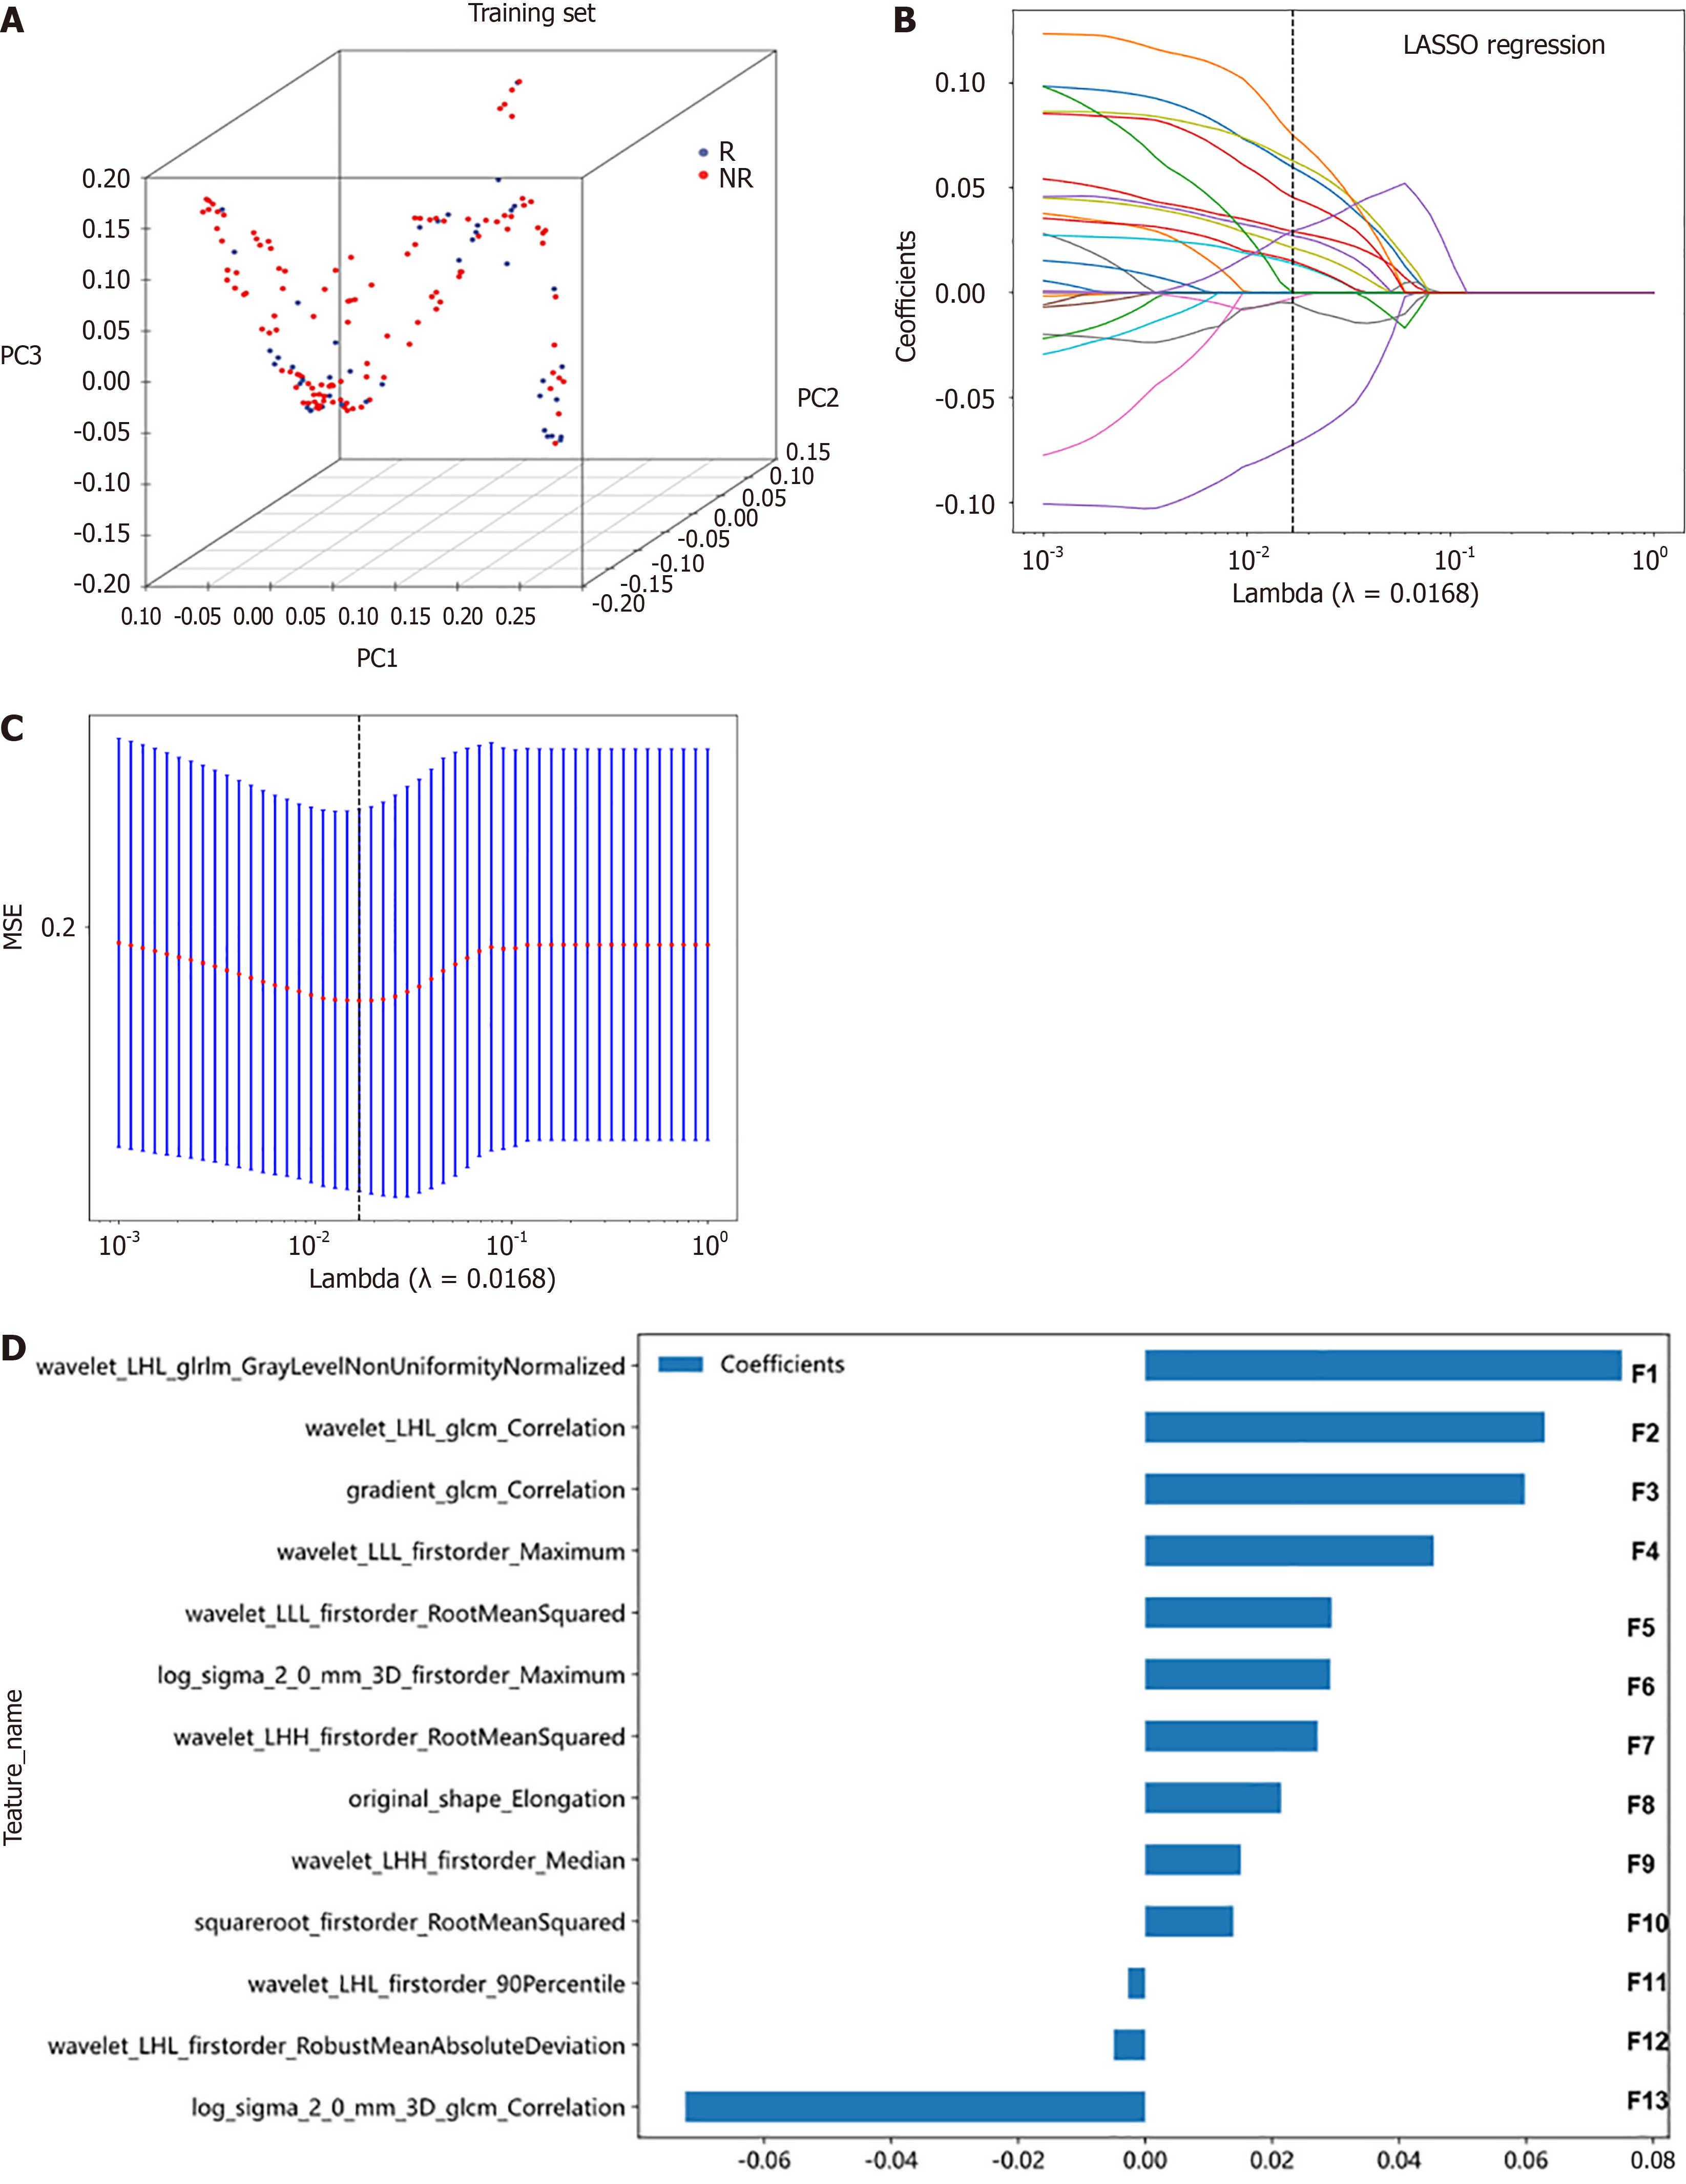
Figure 2 Selection of radiomic features using the least absolute shrinkage and selection operator regression model.
A: Diffusion maps displaying patient clusters based on radiomic features in training set; B: Least absolute shrinkage and selection operator (LASSO) coefficient profile plot showing various log (λ) values; The vertical dashed lines indicate the 13 radiomic features with nonzero coefficients selected using the optimal λ value; C: Selection of the LASSO model’s tuning parameter (λ) utilizing 10-fold cross-test via the minimum criterion, with vertical lines indicating the optimal λ value. 10-fold cross-test was employed for parameter tuning; D: Distribution of the 13 radiomic features with nonzero coefficients. R: Bowel resection group; NR: Non-bowel resection group; MSE: Mean squared error; PC: Principal component; LASSO: Least absolute shrinkage and selection operator.
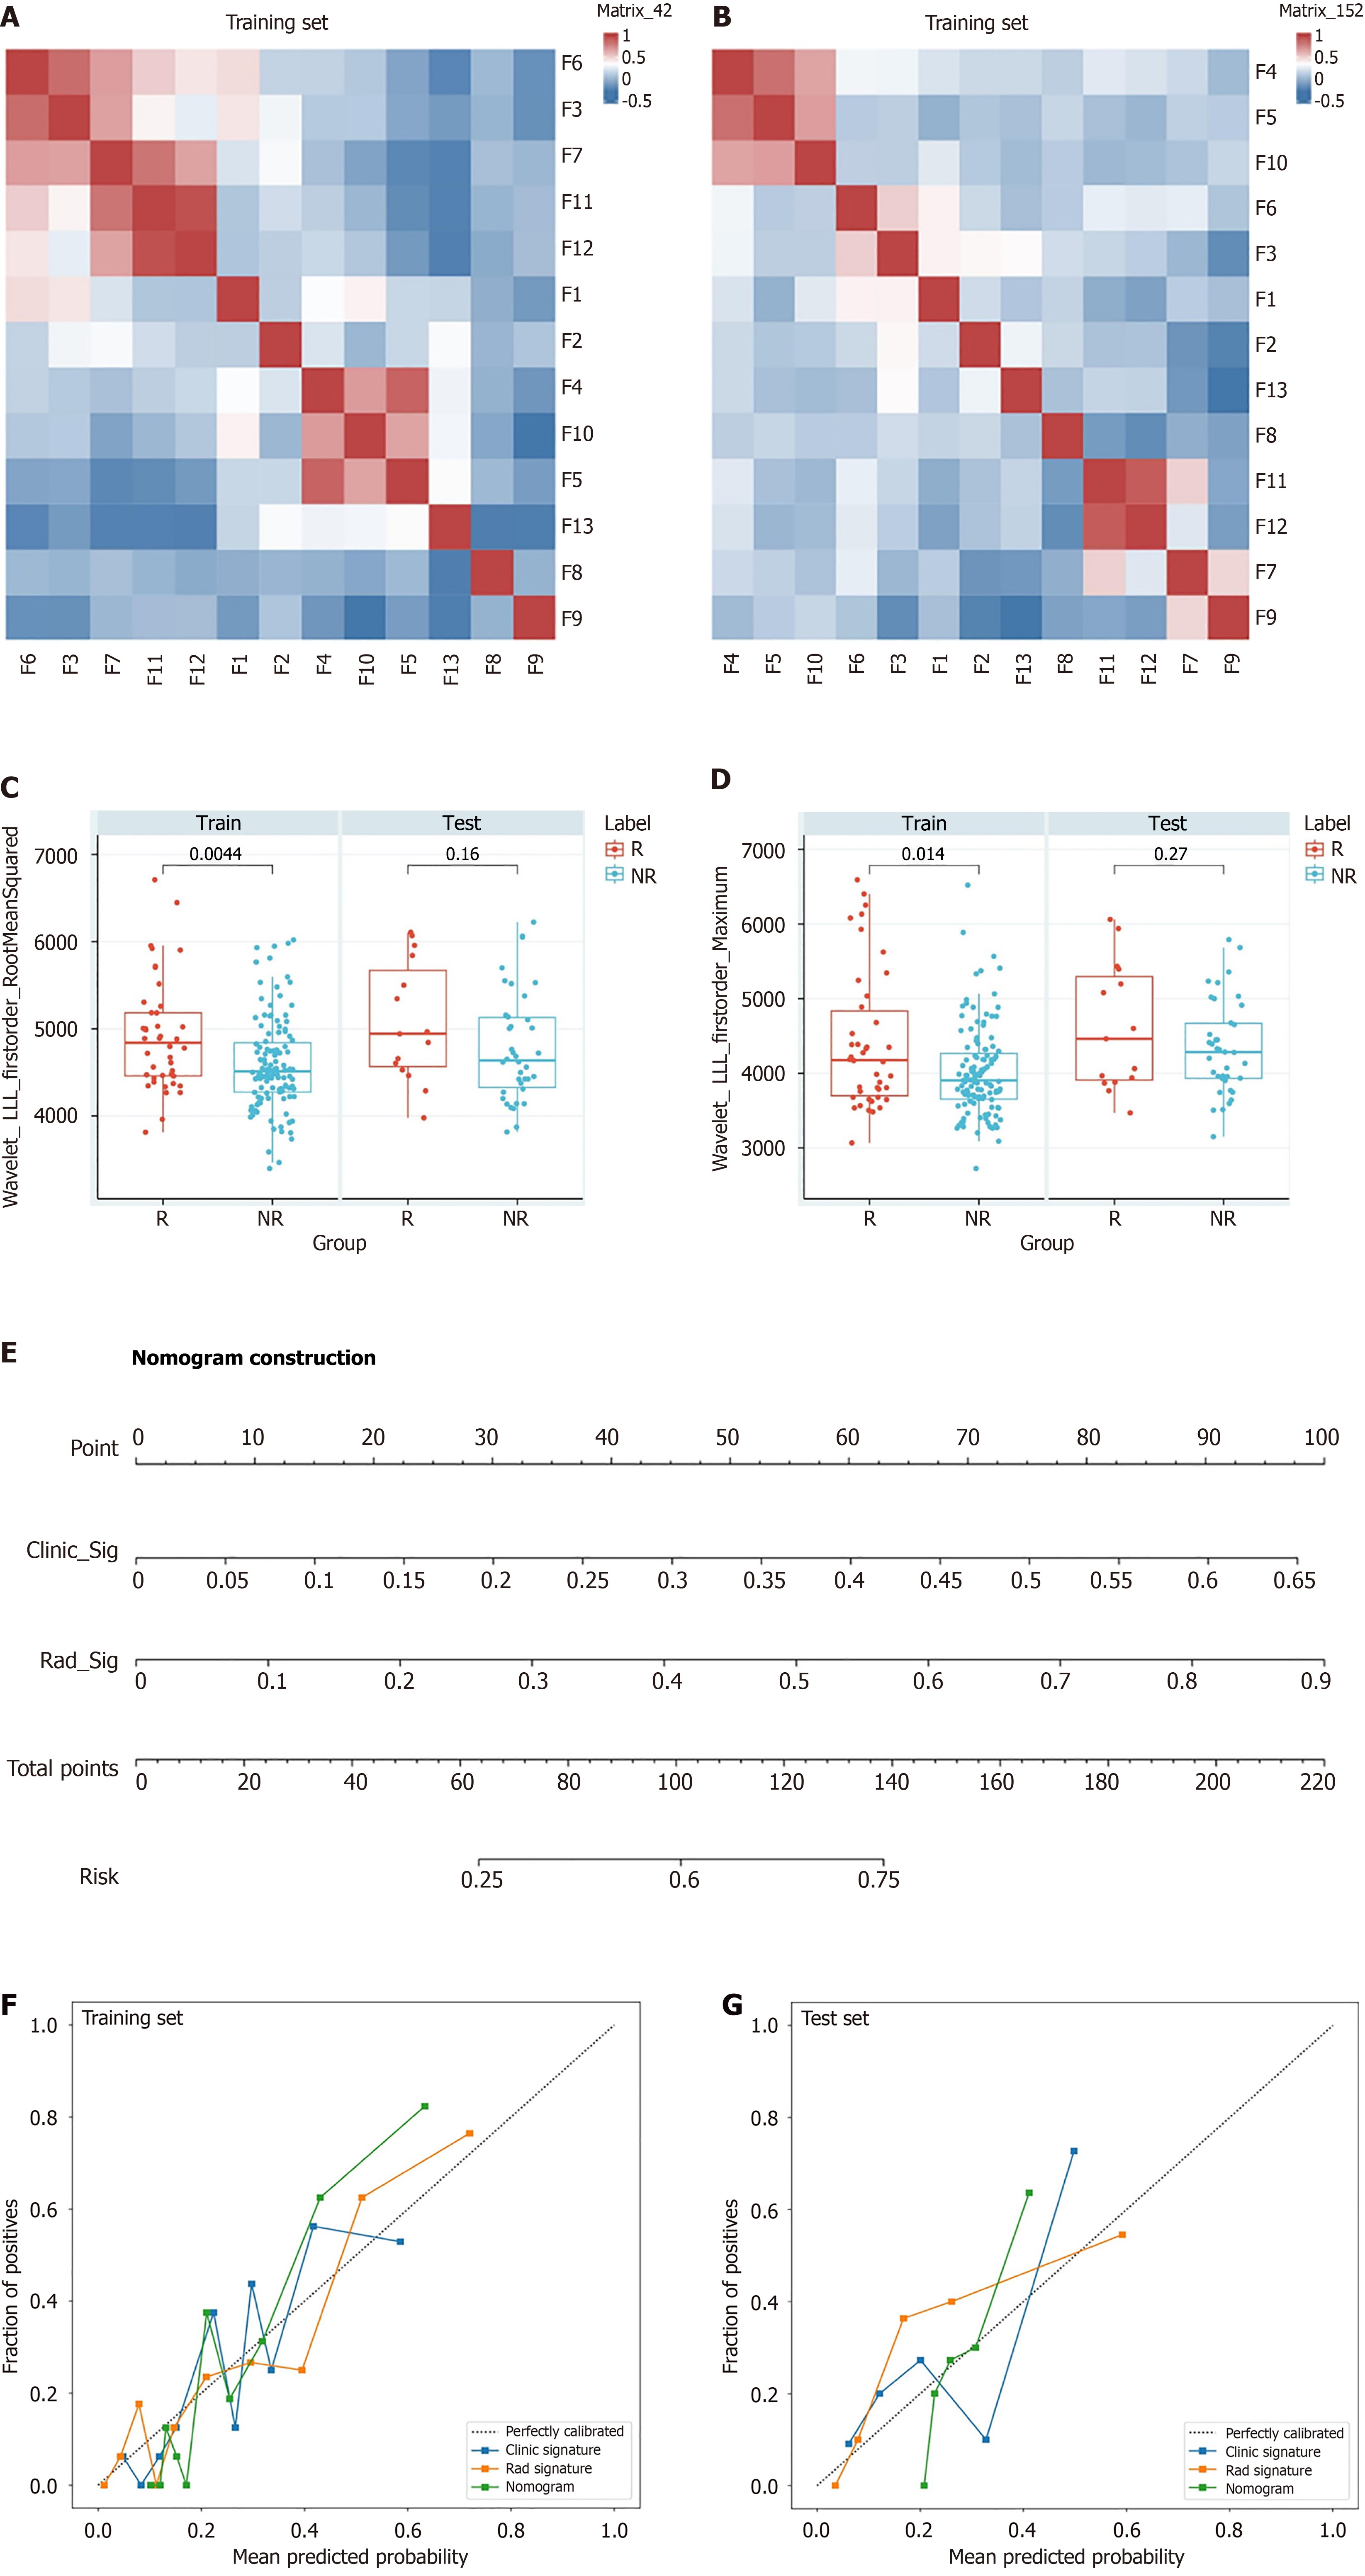
Figure 3 A nomogram based on Rad-score and clinical indicators for predicting bowel resection risk in patients with incarcerated inguinal hernia.
A and B: Heatmaps illustrating the distribution of the 13 selected radiomic features in both cohorts; C and D: Box plots of the most significantly different radiomic features in the training and test cohorts; E: Construction of the radiomic-clinical nomogram; F and G: Calibration curves for the radiomic nomogram in the training and test sets. R: Bowel resection group; NR: Non-bowel resection group.
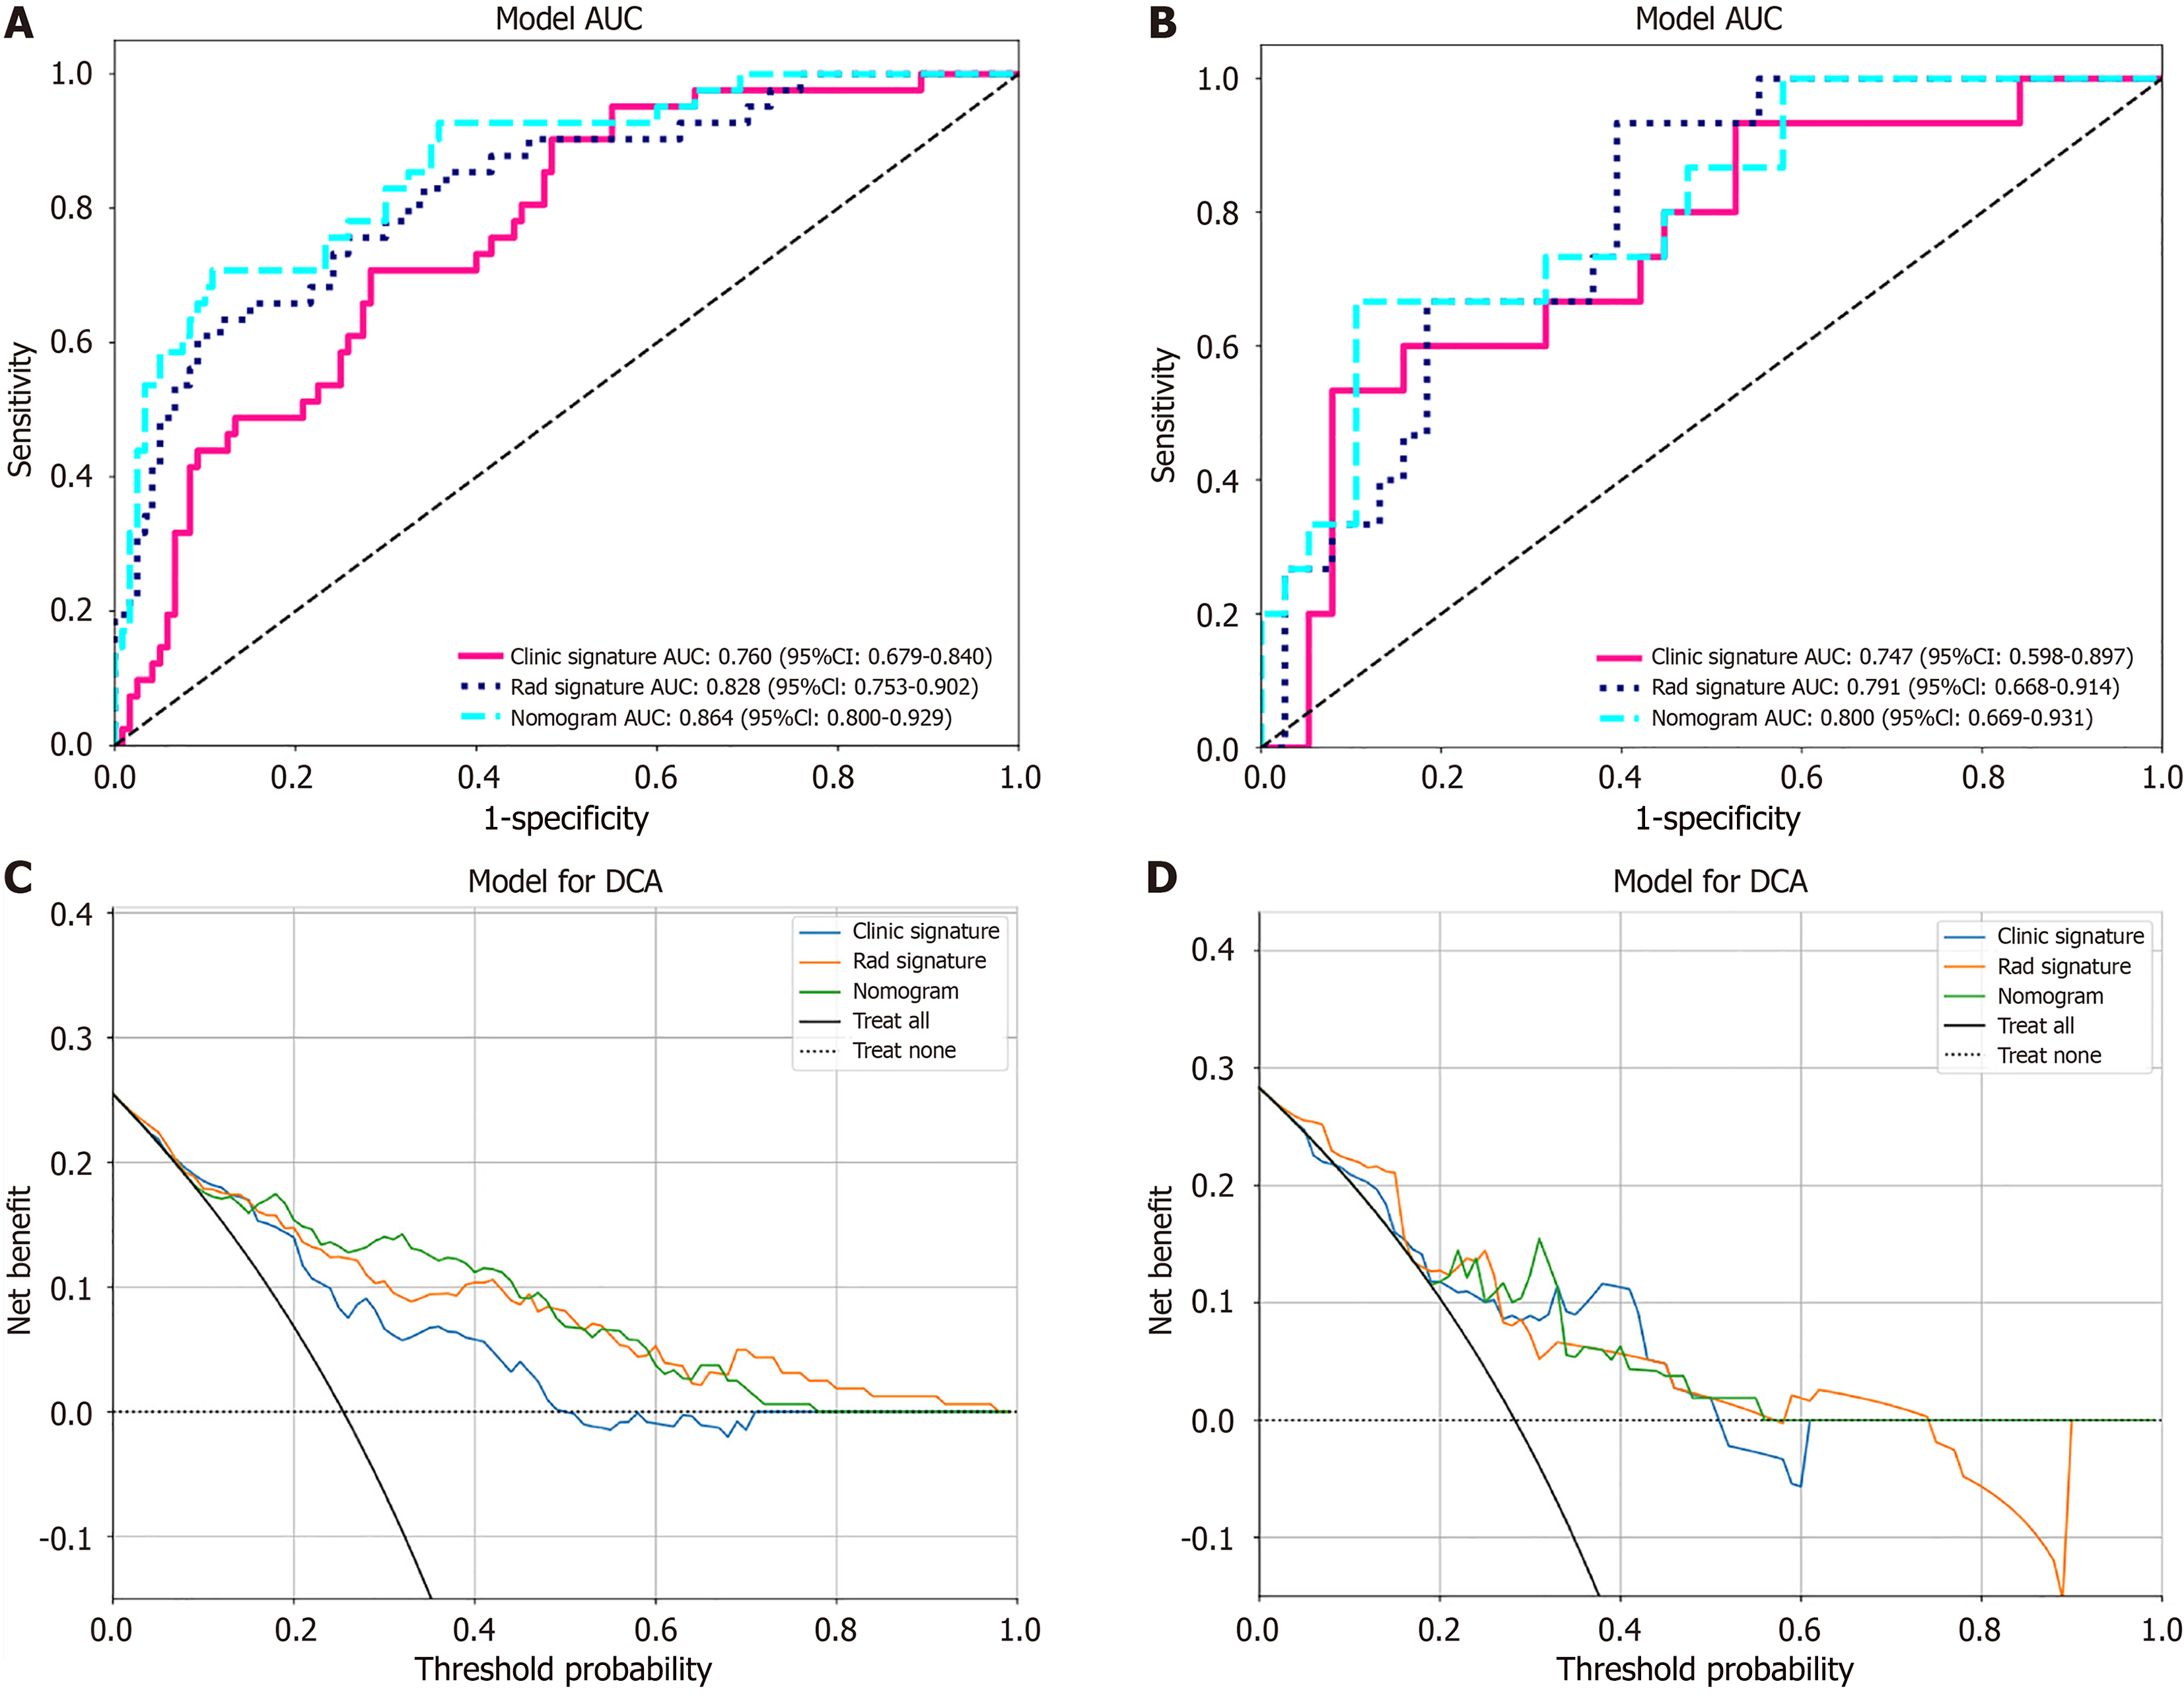
Figure 4 Receiver operating characteristic curves and decision curve analysis.
A and B: Receiver operating characteristic curves for the clinical factor model, the radiomic signature, and the radiomic nomogram in the training sets (A) and test sets (B); C and D: Decision curve analysis for the radiomic nomogram model in the training (C) and test (D) sets. AUC: Area under the curve; CI: Confidence interval; DCA: Decision curve analysis.
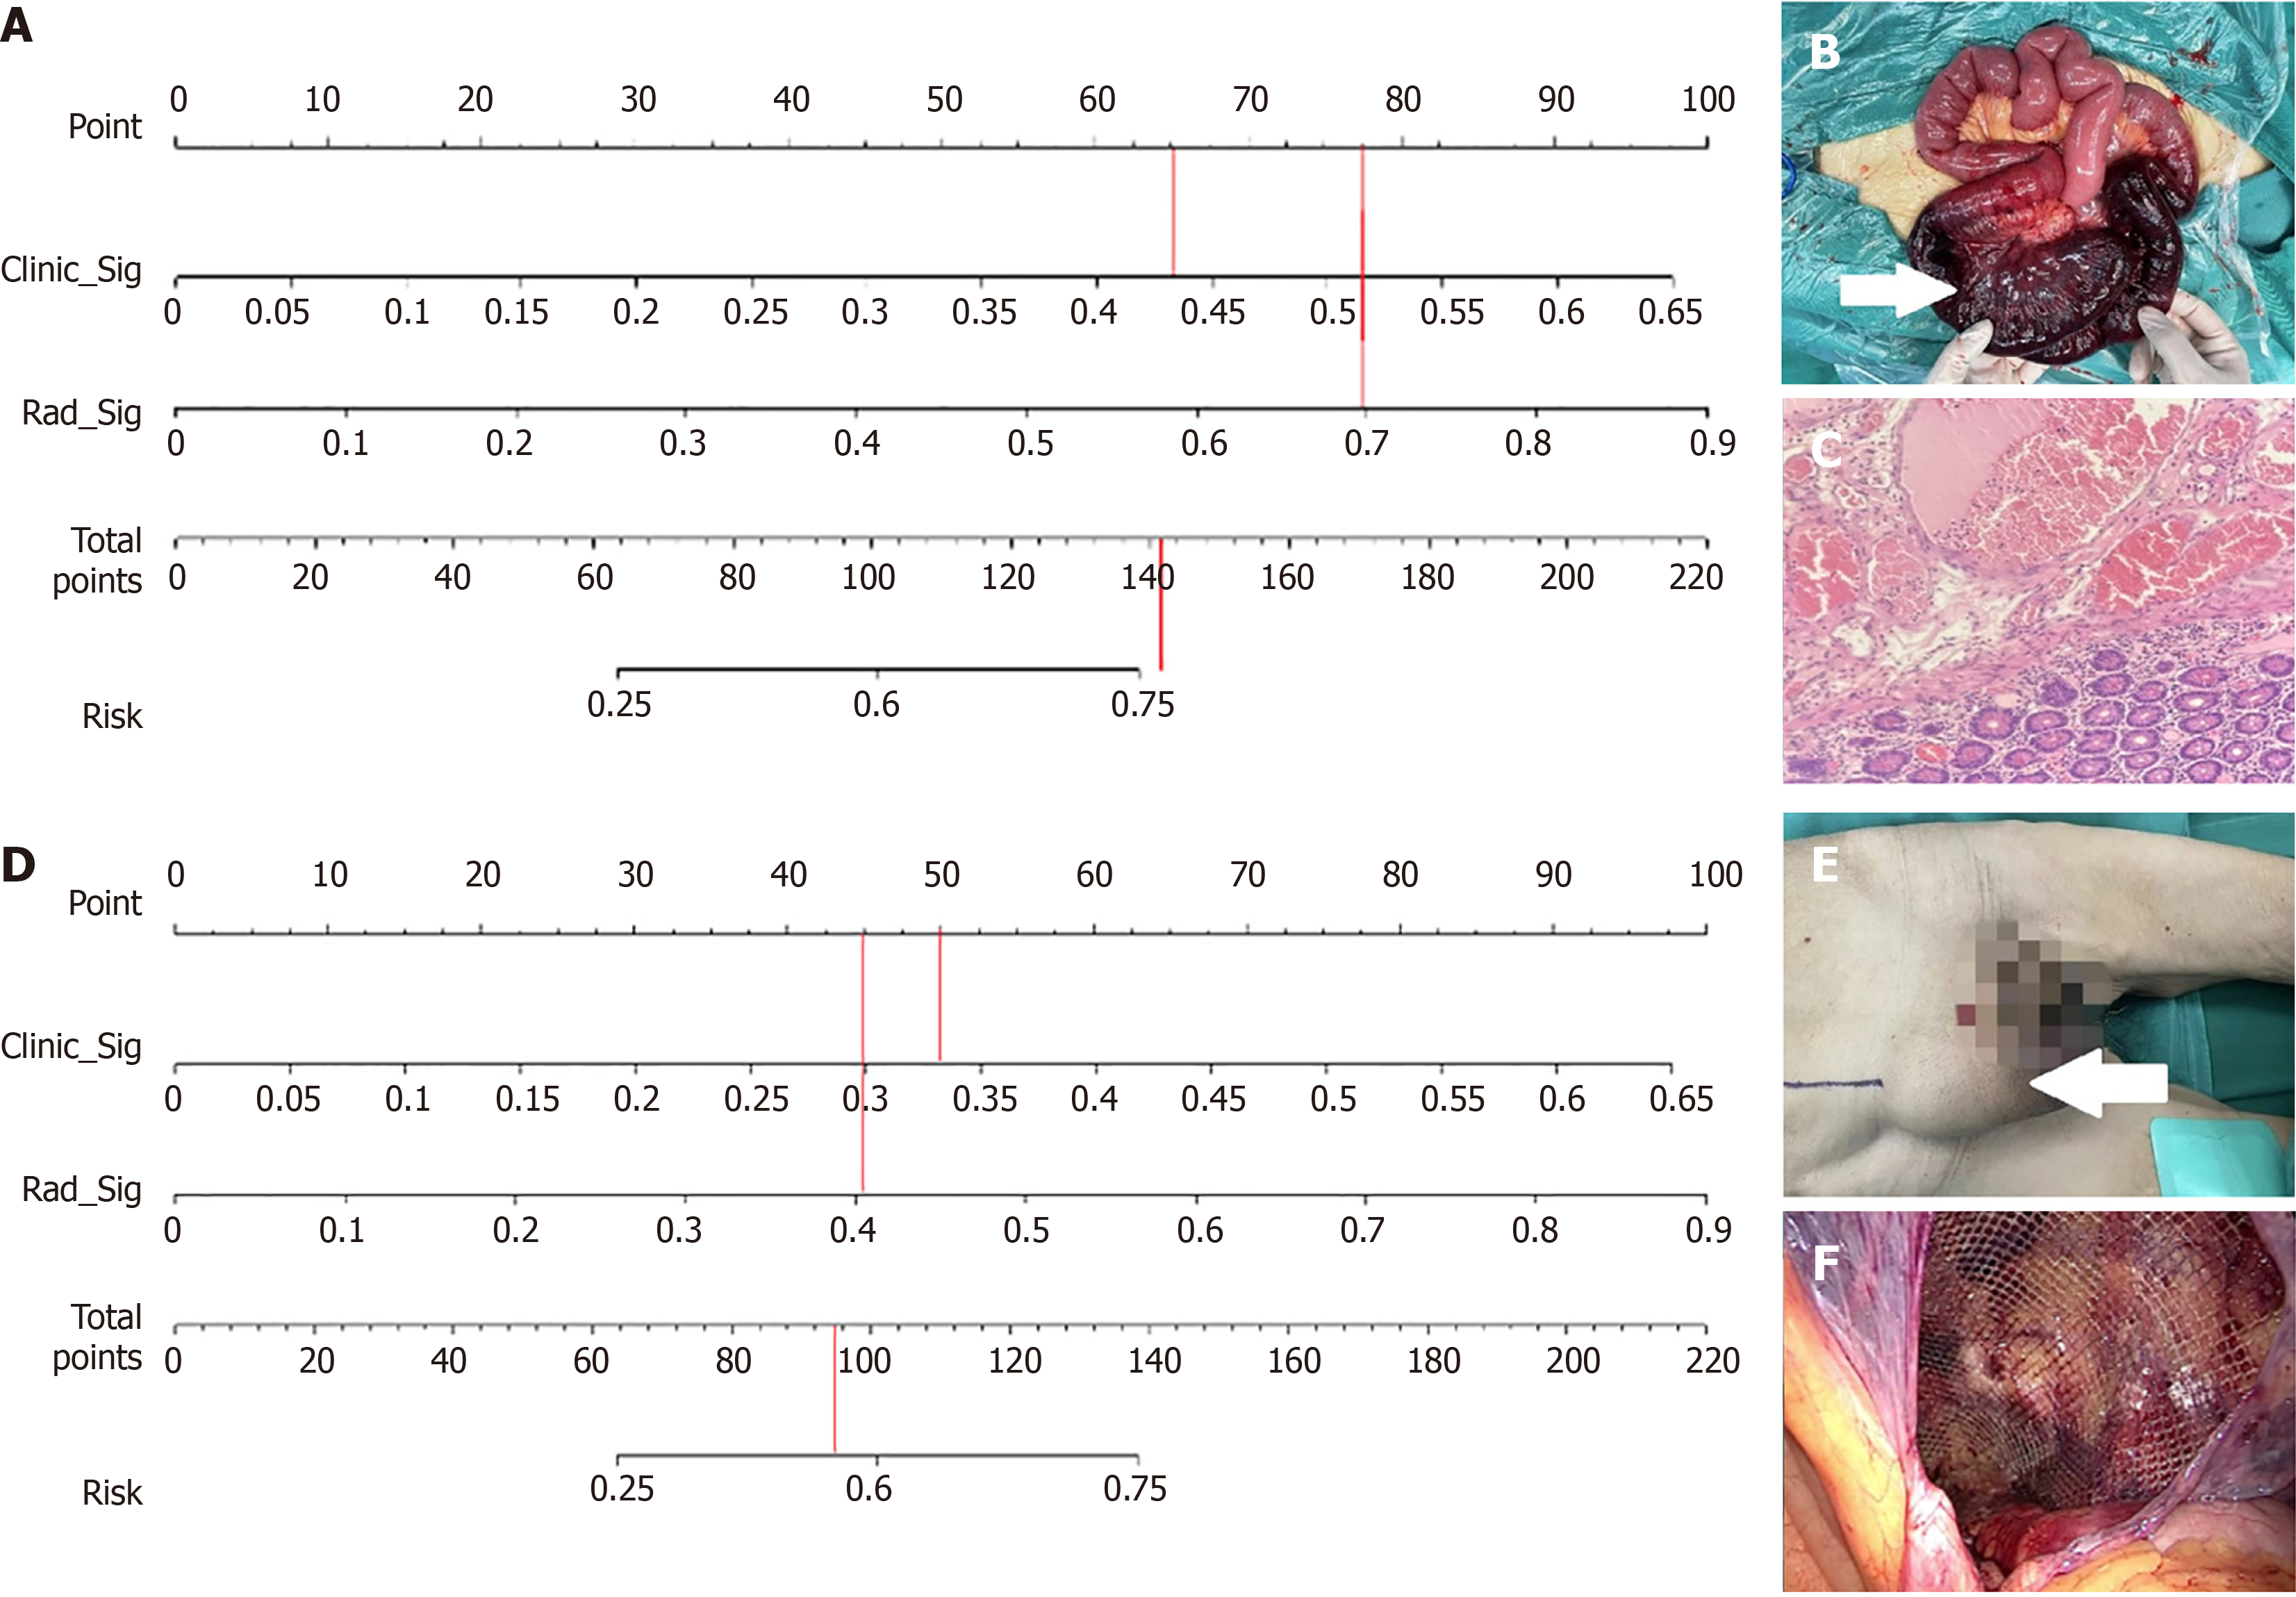
Figure 5 Demonstrations of bowel resection results predicted by the novel fusion model.
A-C: Case 1: A 63-year-old male patient diagnosed with incarcerated inguinal hernia (IIH), including the patient’s nomogram, preoperative computed tomography (CT) images, and intraoperative findings of the incarcerated bowel; D-F: Case 2: A 72-year-old male patient diagnosed with IIH, featuring the patient’s nomogram, preoperative CT images, and intraoperative findings from laparoscopic mesh repair procedures for the patient without bowel resection.
- Citation: Li DL, Zhu L, Liu SL, Wang ZB, Liu JN, Zhou XM, Hu JL, Liu RQ. Machine learning-based radiomic nomogram from unenhanced computed tomography and clinical data predicts bowel resection in incarcerated inguinal hernia. World J Gastrointest Surg 2025; 17(6): 106155
- URL: https://www.wjgnet.com/1948-9366/full/v17/i6/106155.htm
- DOI: https://dx.doi.org/10.4240/wjgs.v17.i6.106155


