Copyright
©The Author(s) 2021.
World J Gastrointest Surg. Aug 27, 2021; 13(8): 871-884
Published online Aug 27, 2021. doi: 10.4240/wjgs.v13.i8.871
Published online Aug 27, 2021. doi: 10.4240/wjgs.v13.i8.871
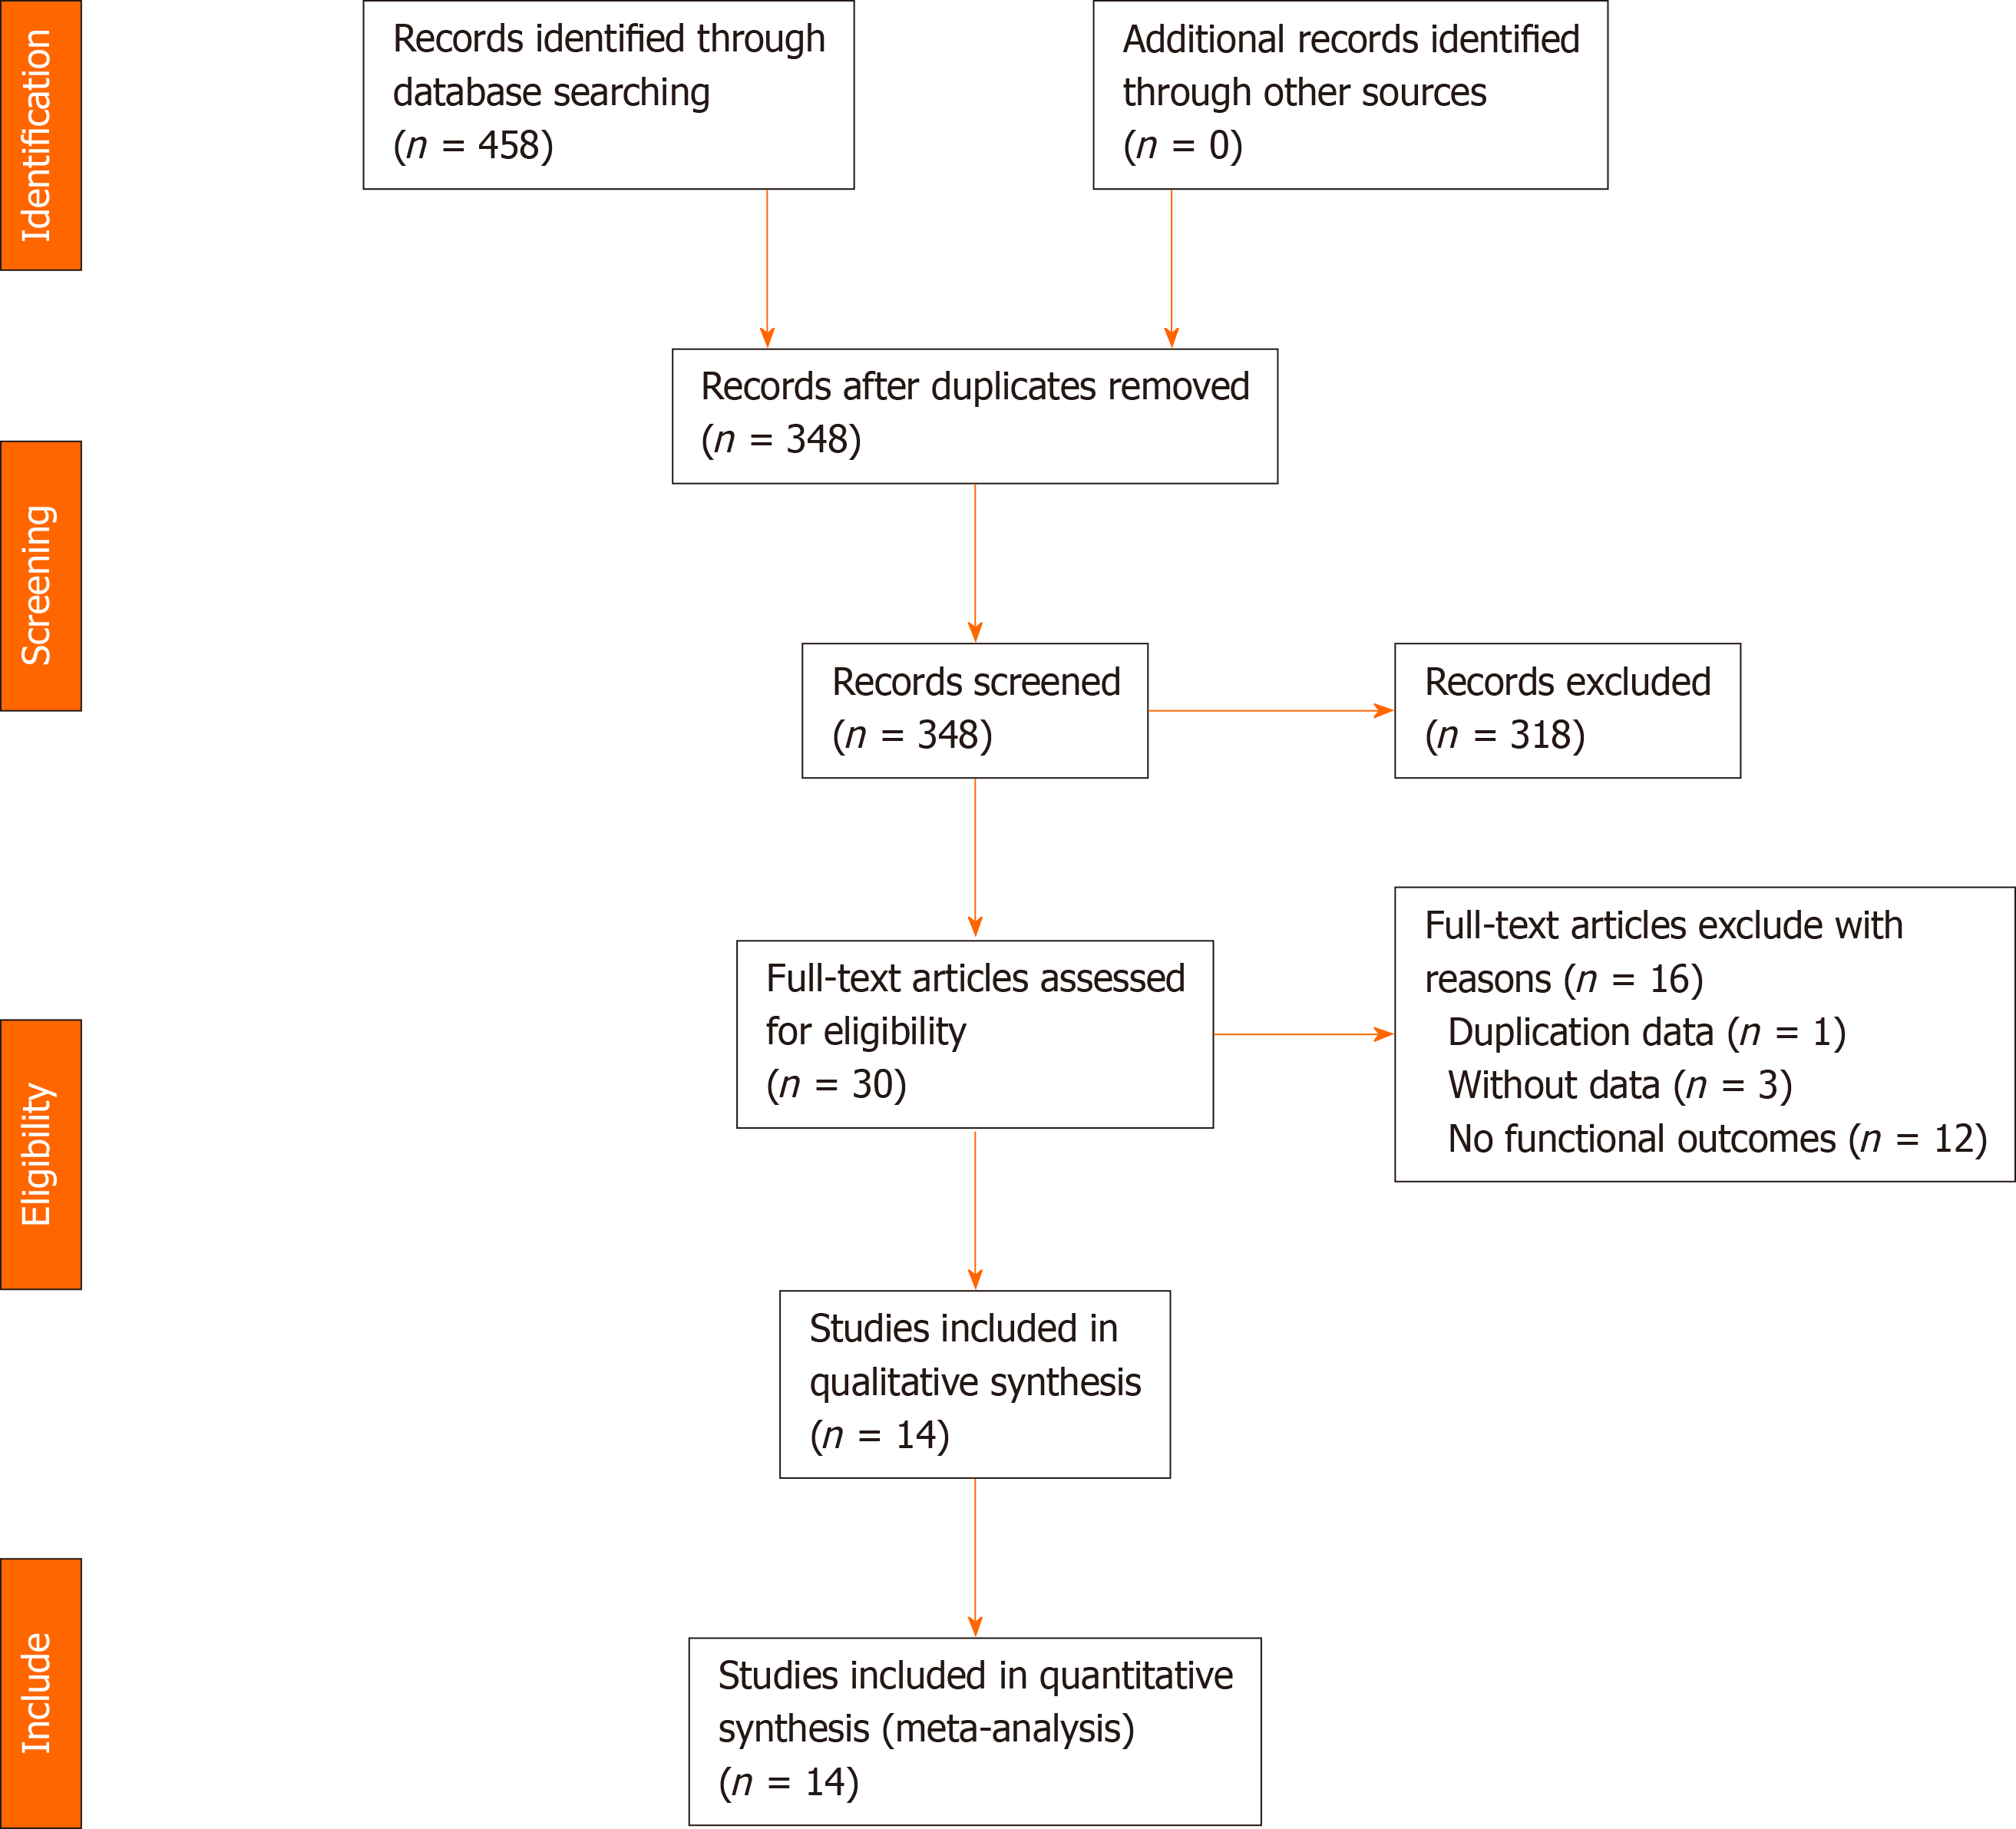
Figure 1 Flow diagram of literature search.
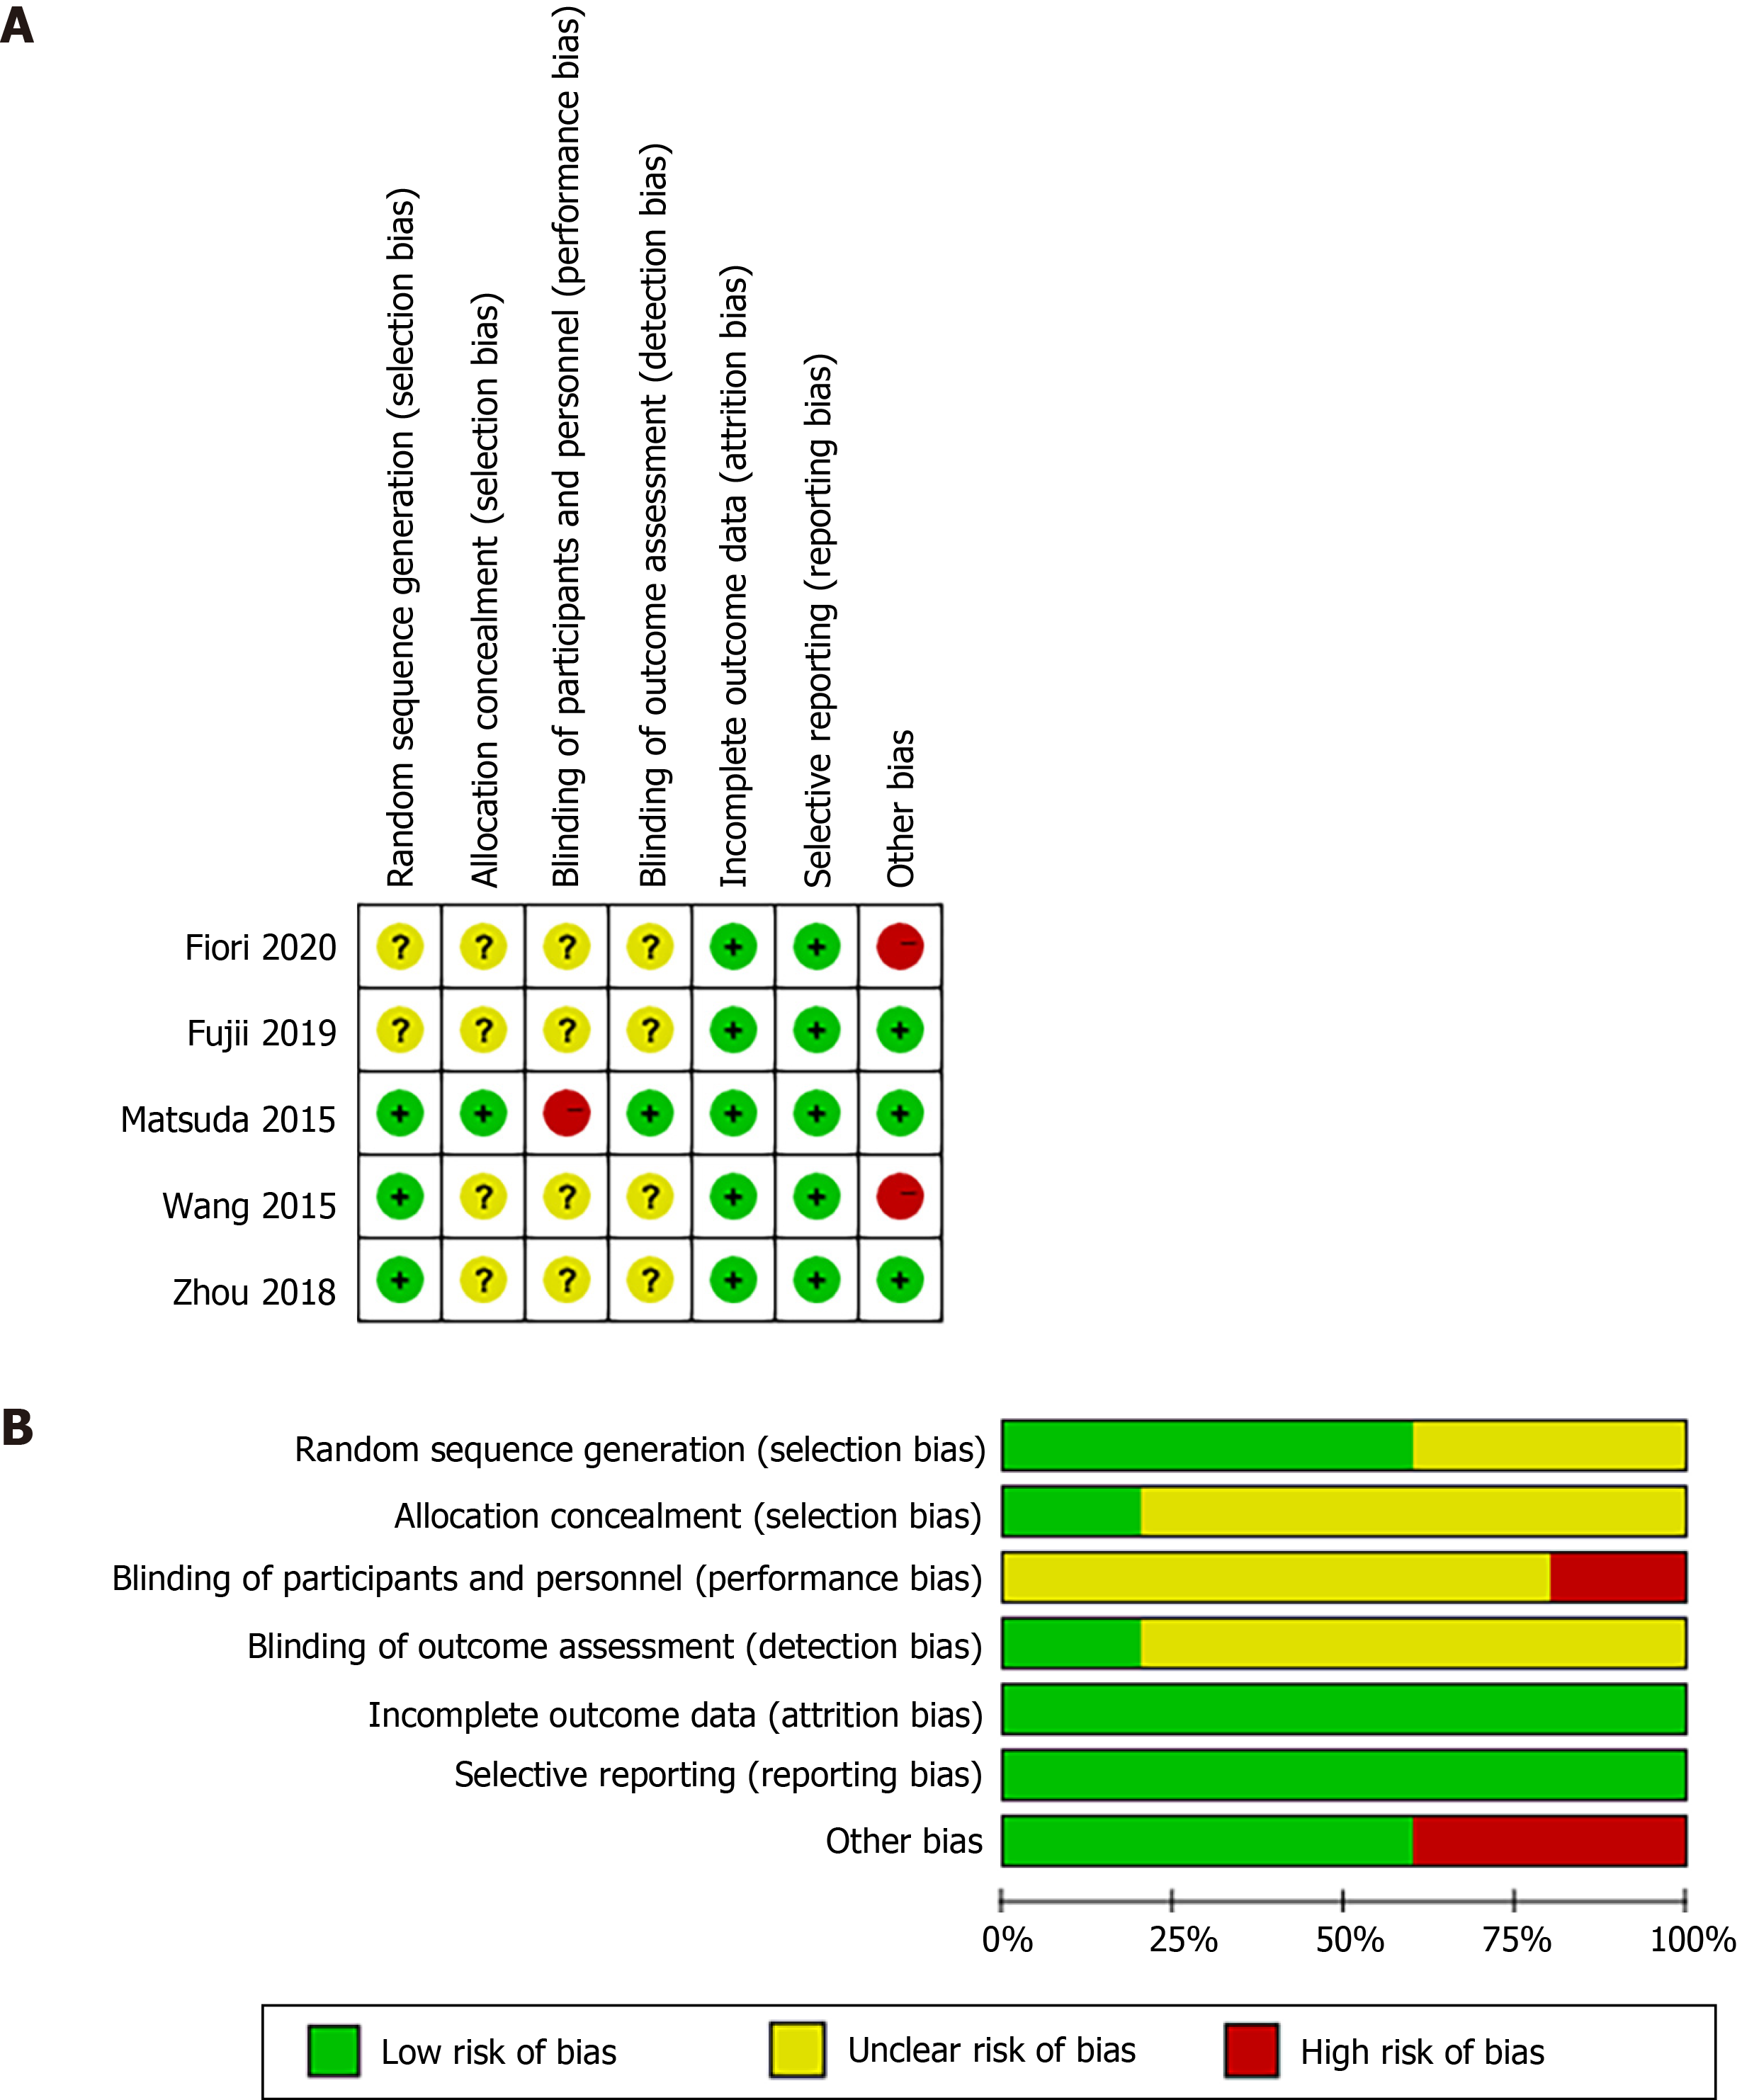
Figure 2 Summary of methodologic quality assessment.
A: Risk of bias summary; B: Risk of bias graph.
Figure 3 Forest plots for various function parameters with low ligation and high ligation.
A: Urinary dysfunction; B: Urinary retention; C: Urinary infection; D: Genitourinary dysfunction; E: Nocturnal bowel movement; F: Need for antidiarrheal or laxative drugs; G: Wexner’s incontinence score; H: Anastomotic stenosis; I: Anastomotic leakage; J: Postoperative complications; K: Mortality; L: Operative time.
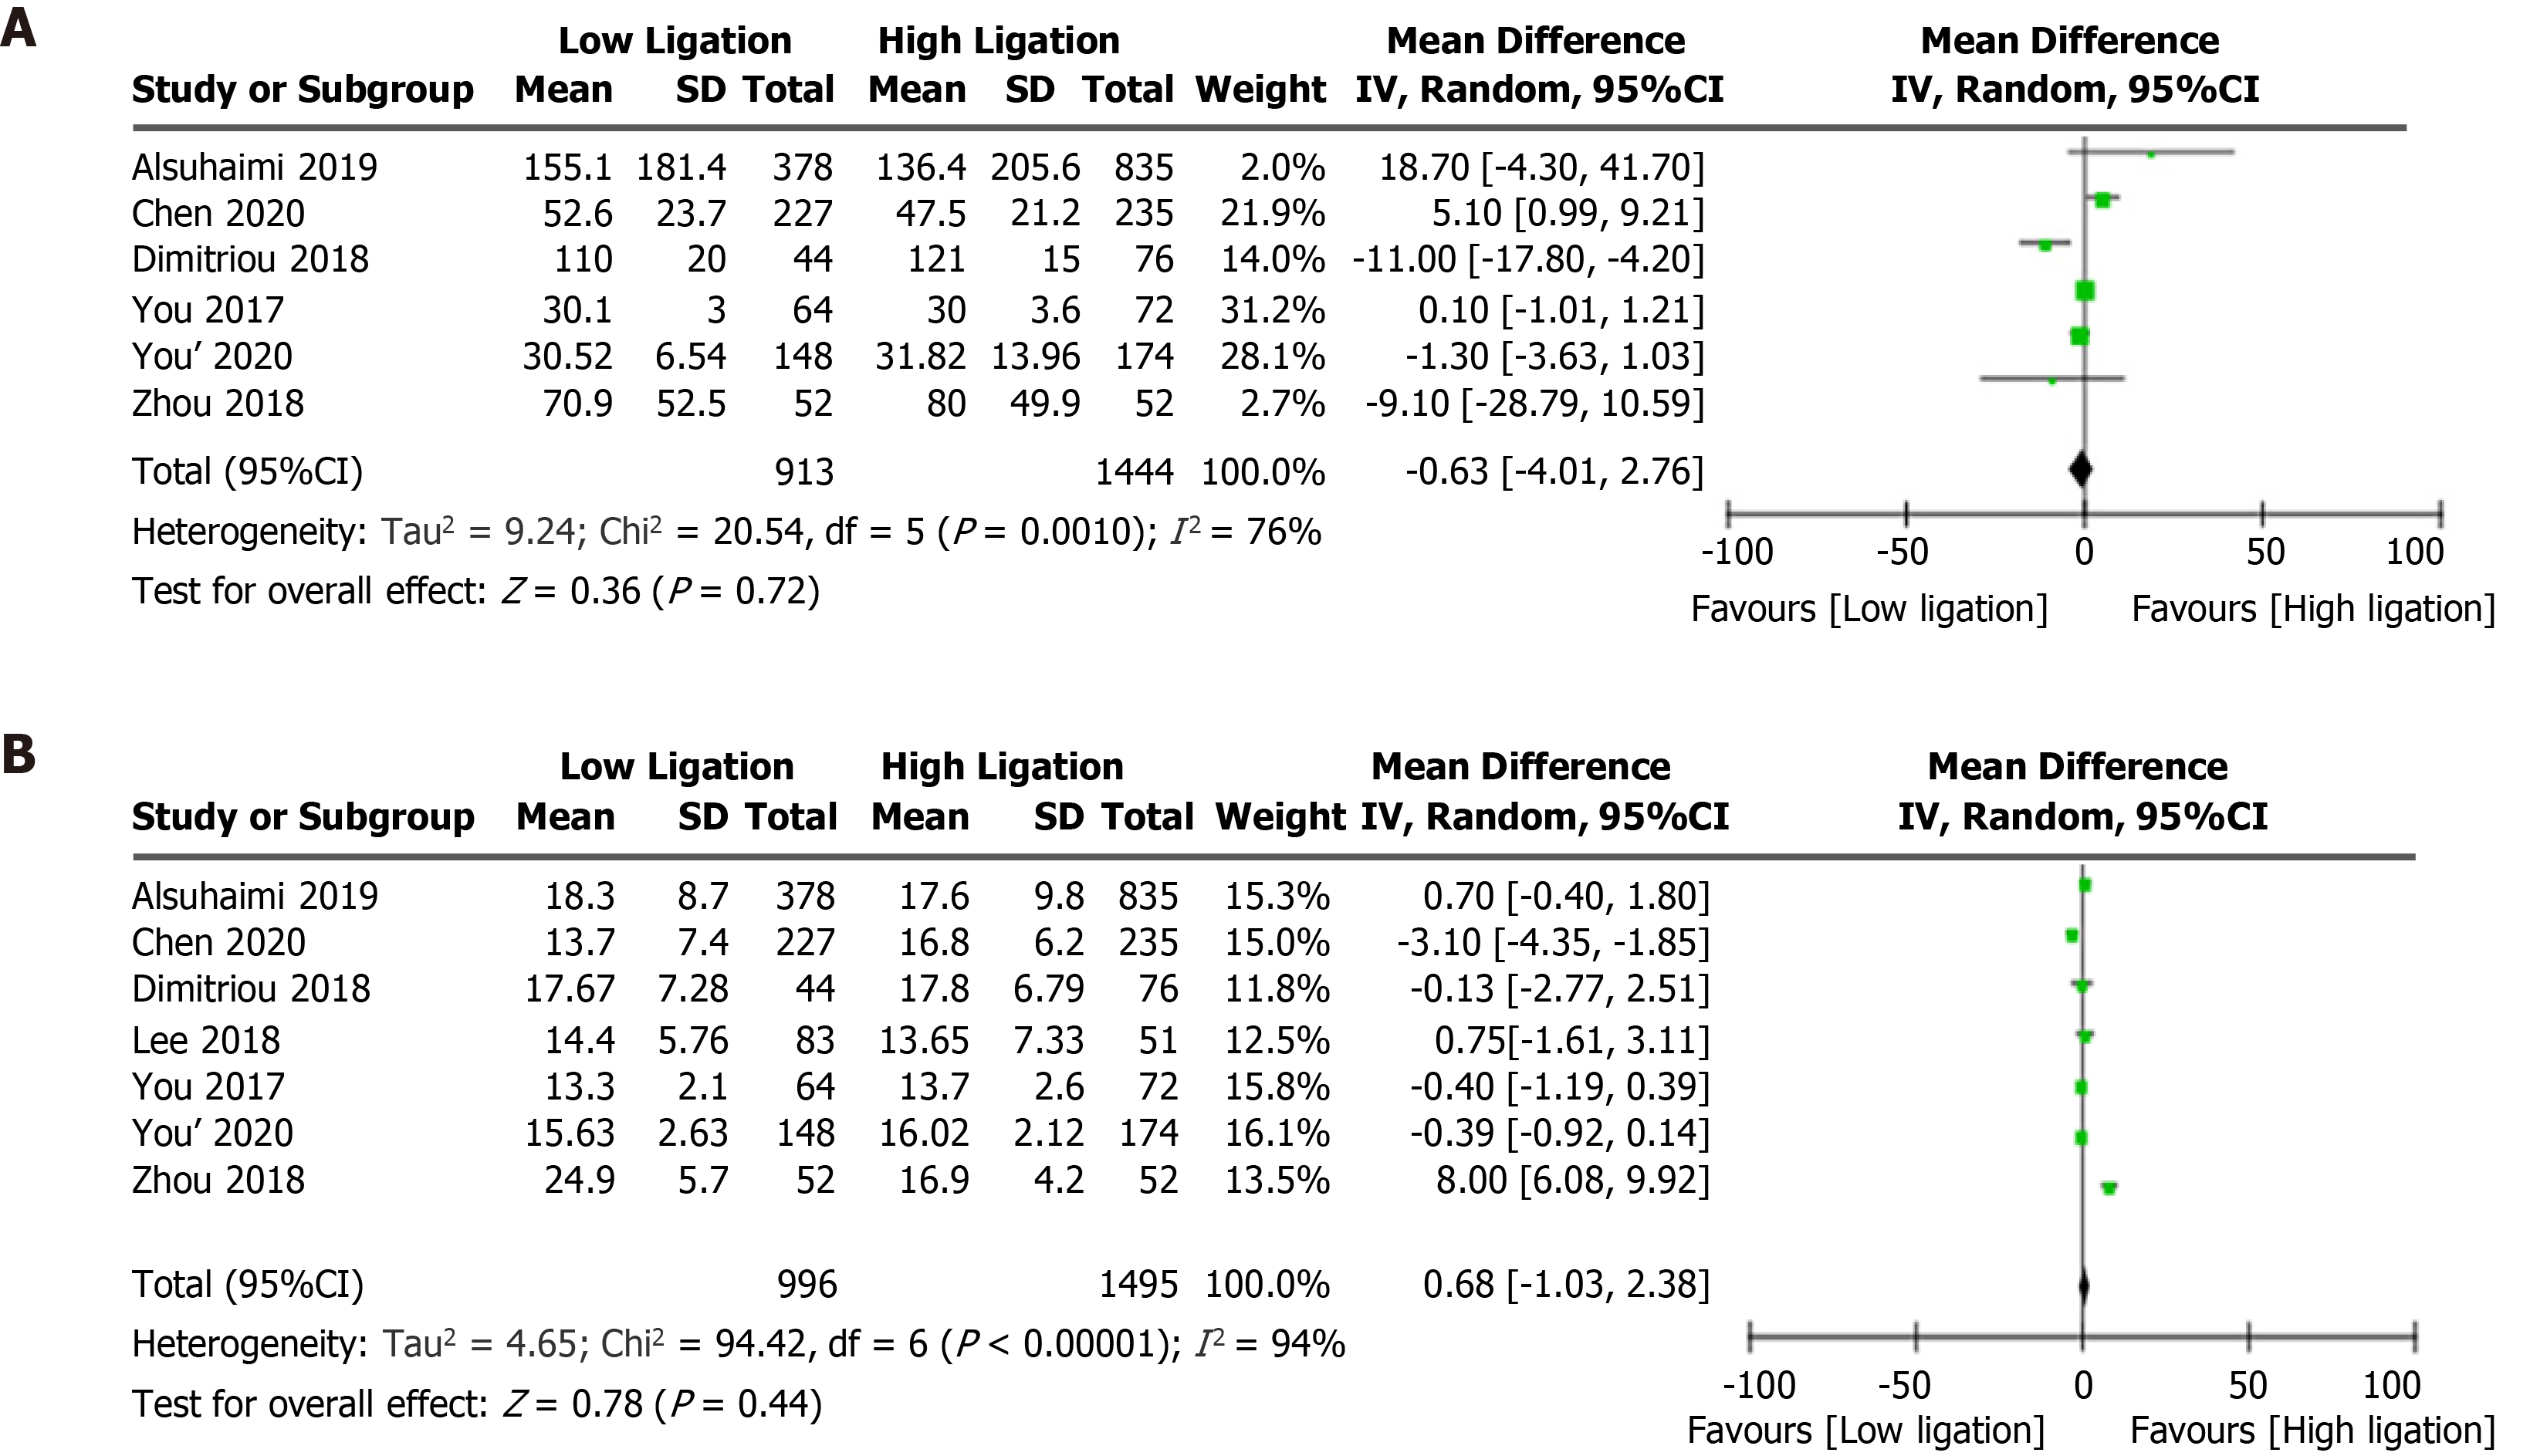
Figure 4 Forest plots for intraoperative indexes of low ligation and high ligation.
A: Blood loss; B: Total lymph nodes harvested.
Figure 5 Forest plot for tumor recurrence following low ligation and high ligation.
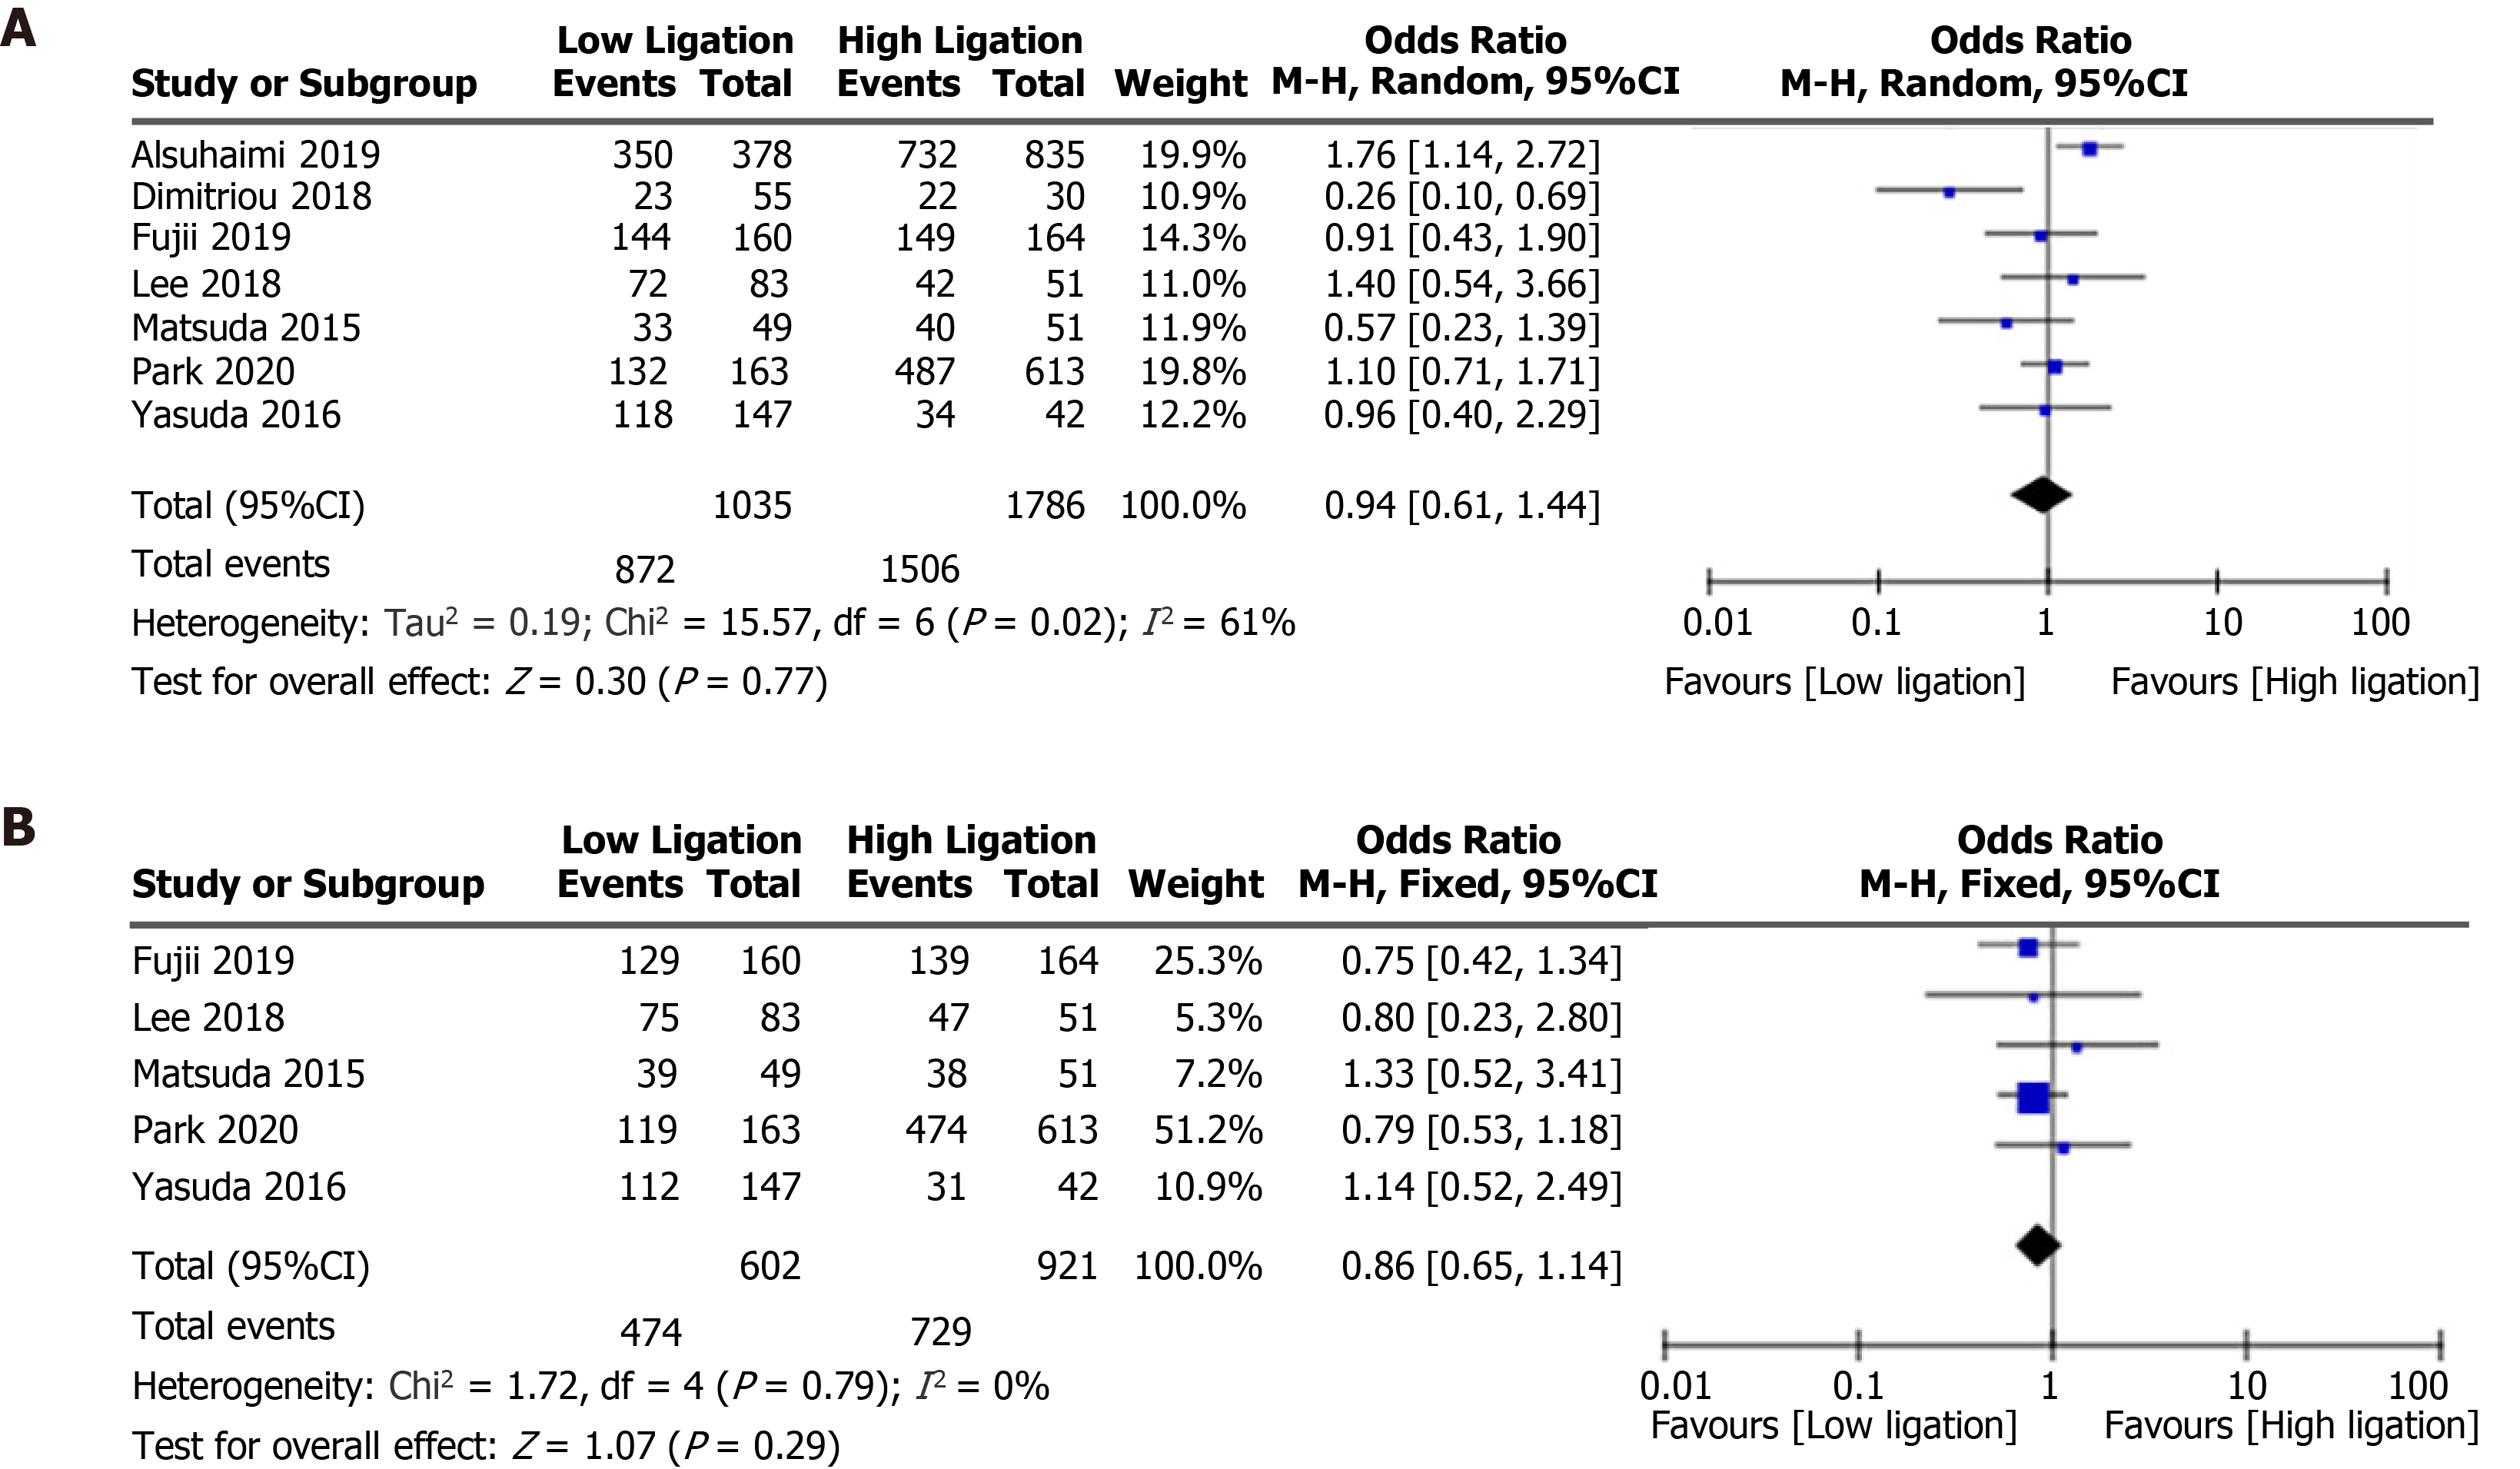
Figure 6 Forest plots for 5-year overall survival following low ligation and high ligation.
A: 5-year overall survival; B: 5-year disease-free survival.
- Citation: Bai X, Zhang CD, Pei JP, Dai DQ. Genitourinary function and defecation after colorectal cancer surgery with low- and high-ligation of the inferior mesenteric artery: A meta-analysis. World J Gastrointest Surg 2021; 13(8): 871-884
- URL: https://www.wjgnet.com/1948-9366/full/v13/i8/871.htm
- DOI: https://dx.doi.org/10.4240/wjgs.v13.i8.871


