Copyright
©The Author(s) 2021.
World J Gastrointest Surg. Jun 27, 2021; 13(6): 597-619
Published online Jun 27, 2021. doi: 10.4240/wjgs.v13.i6.597
Published online Jun 27, 2021. doi: 10.4240/wjgs.v13.i6.597
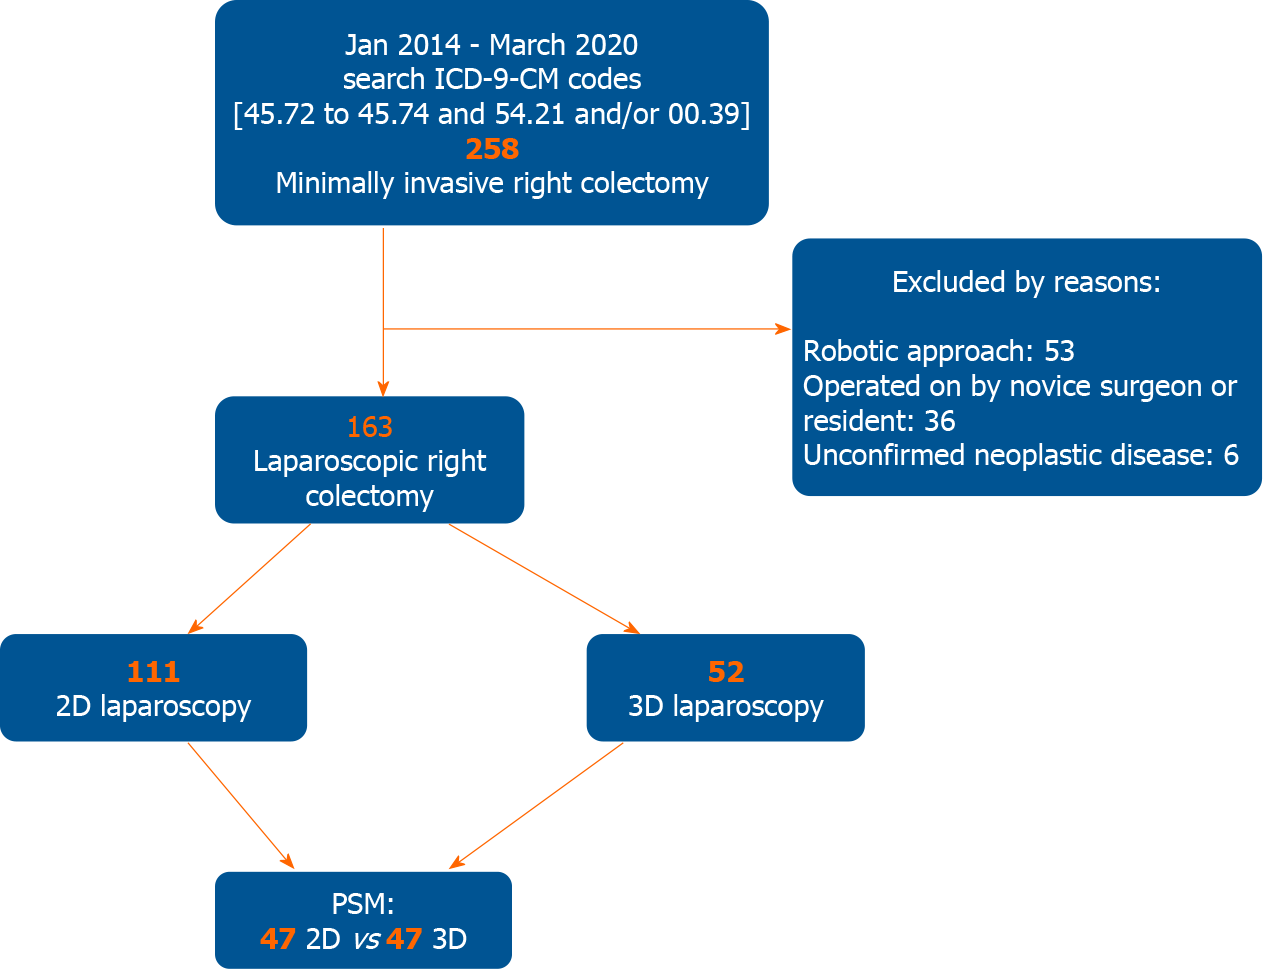
Figure 1 Flow chart of clinical study design.
PSM: Propensity score matching.
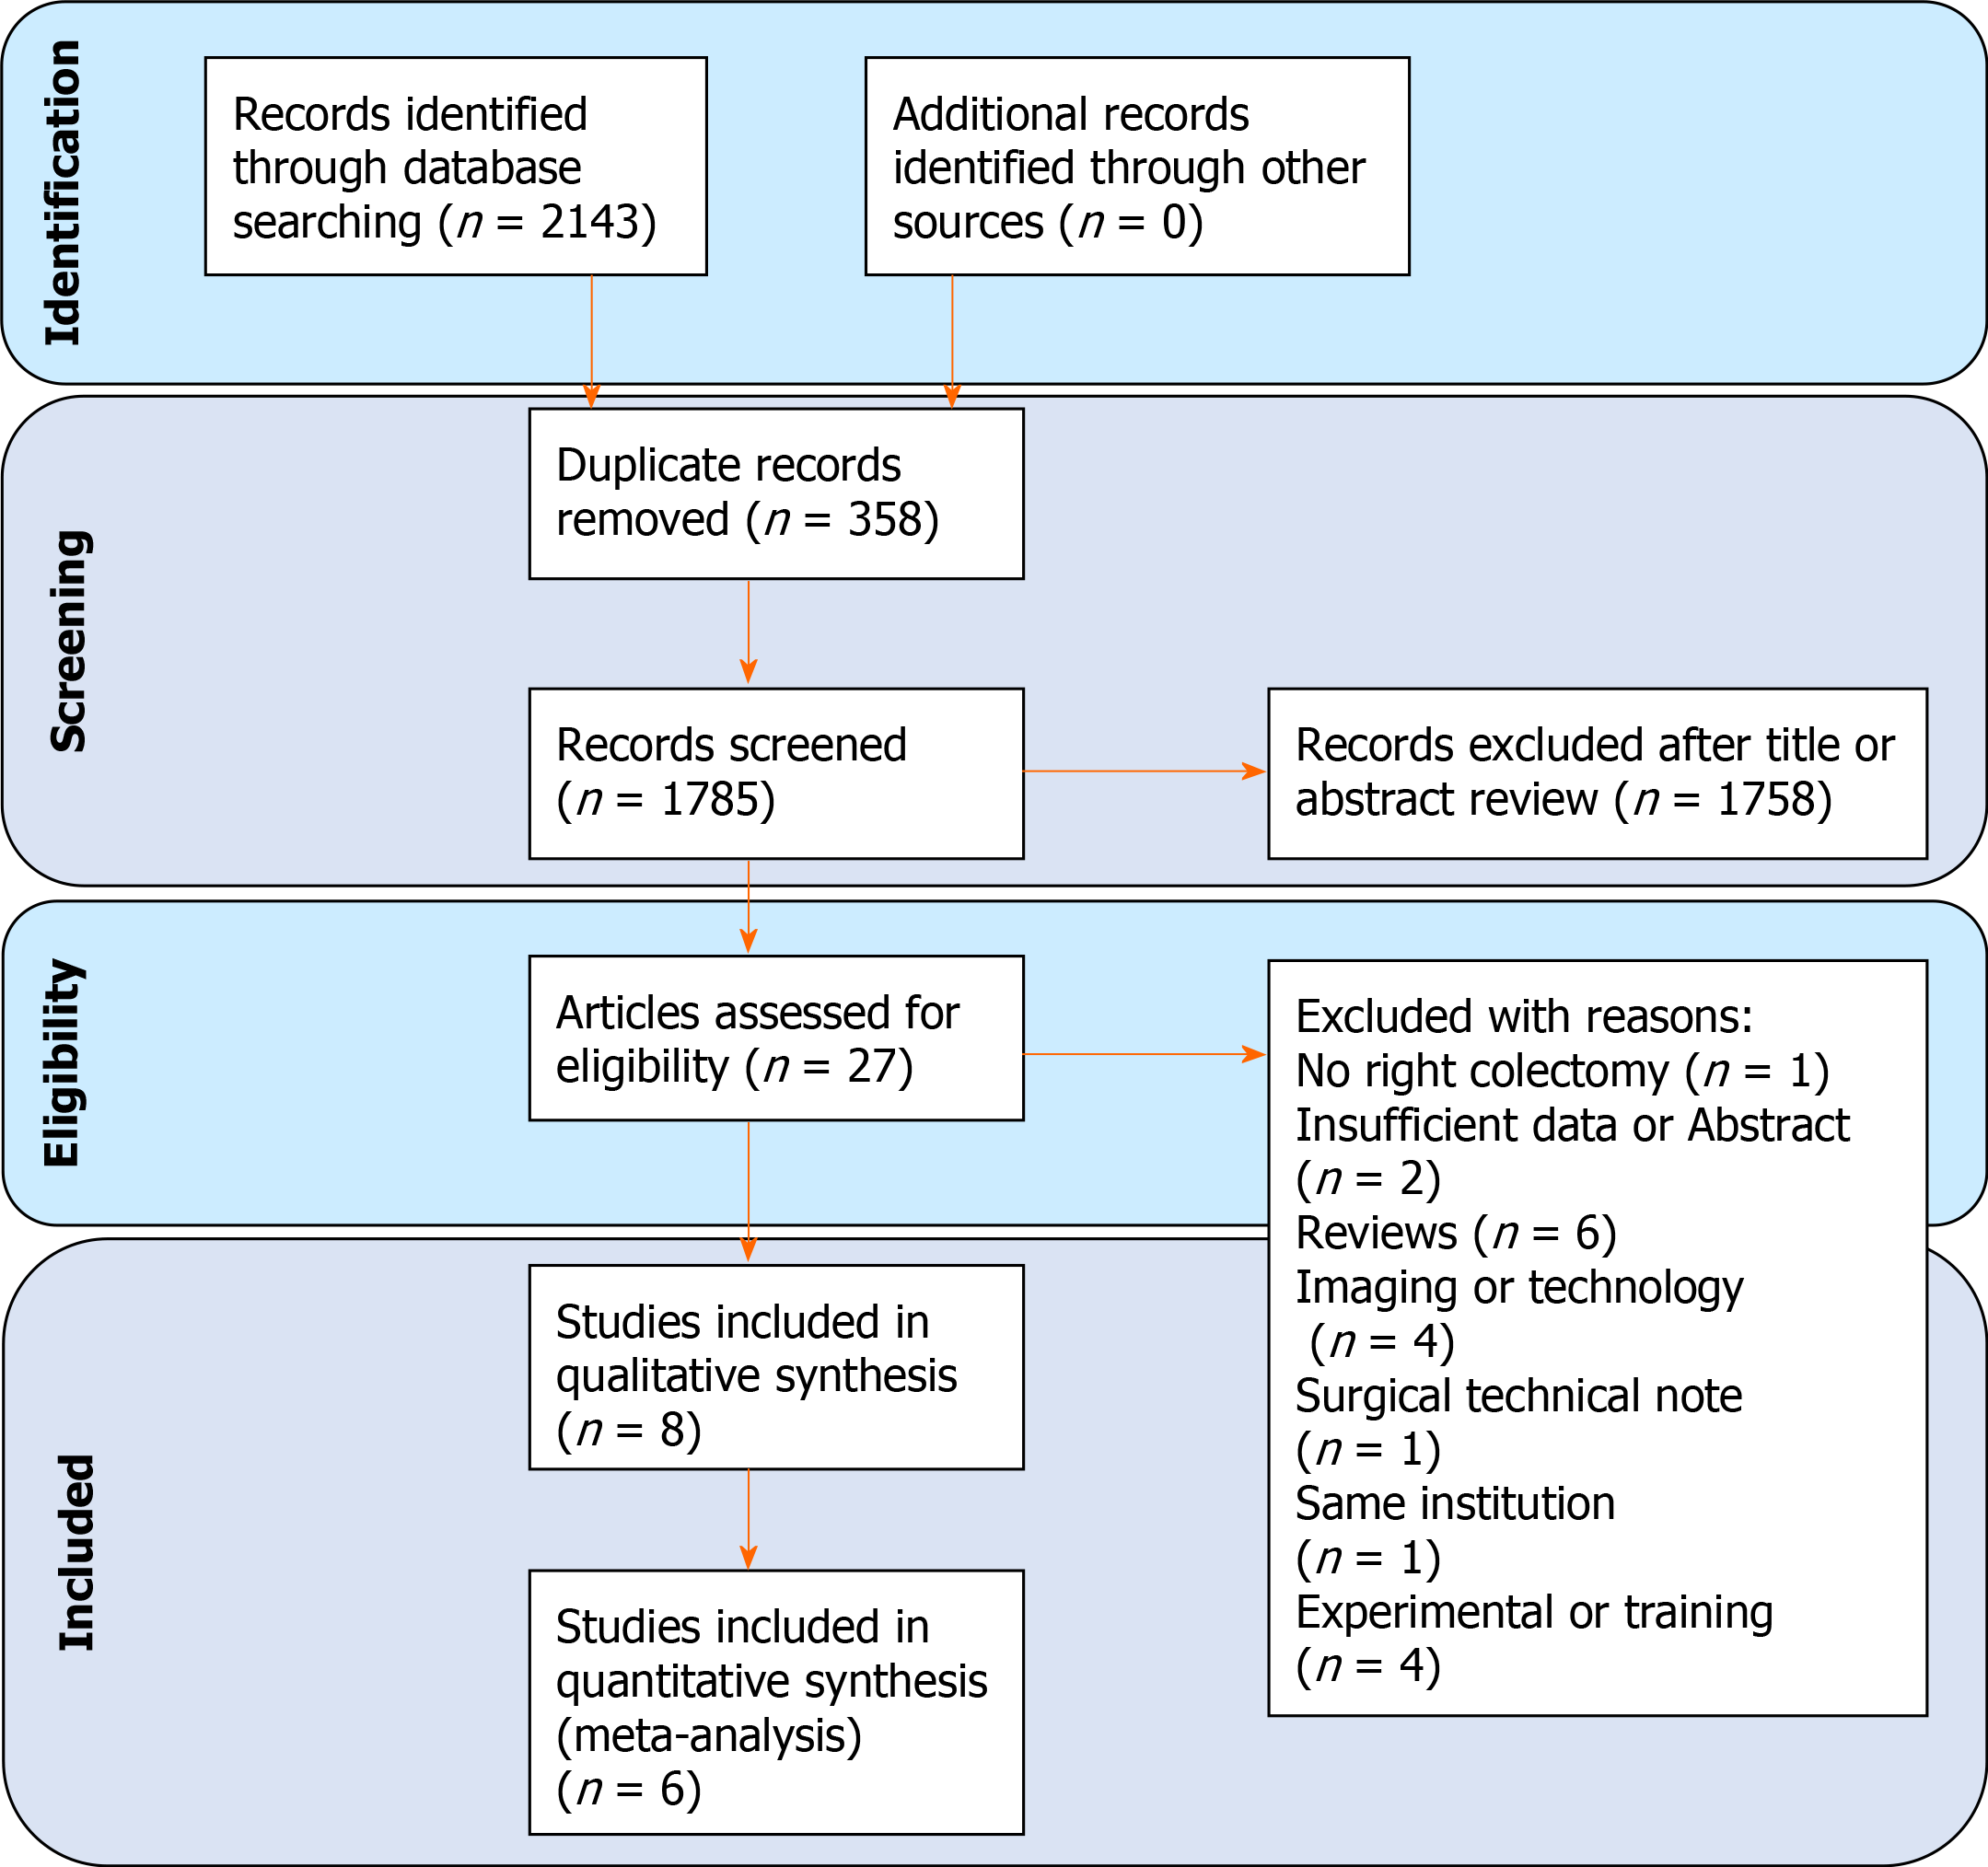
Figure 2 The PRISMA flow diagram of study selection.
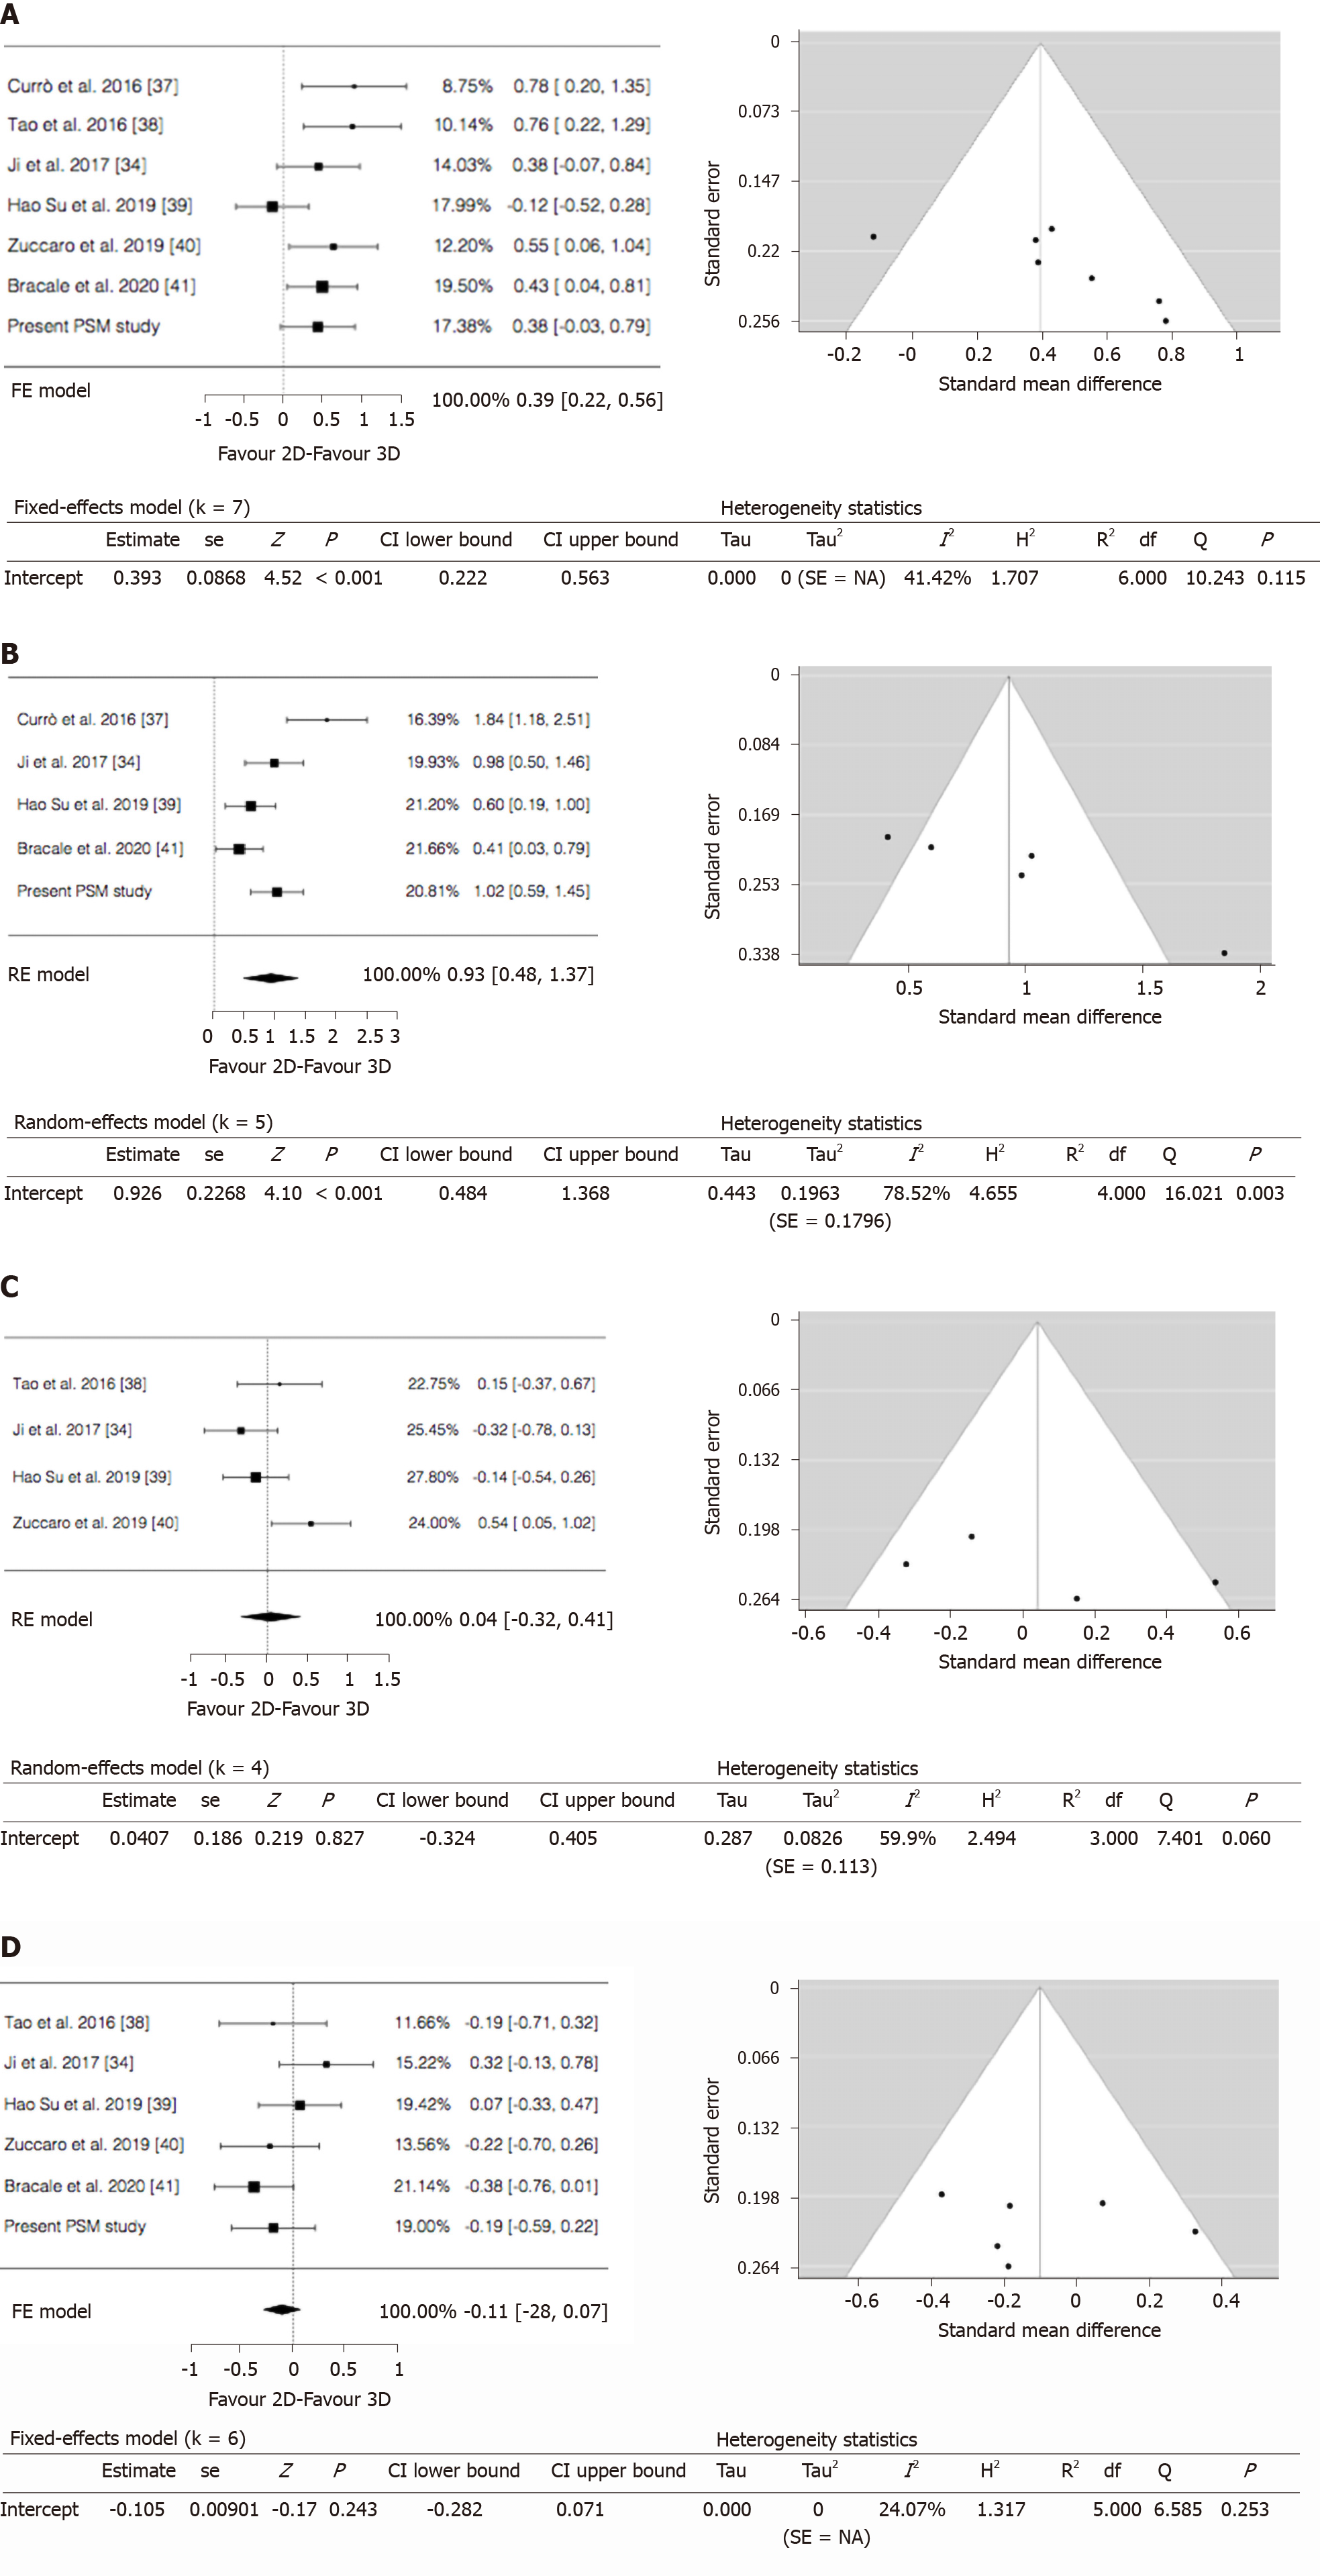
Figure 3 Forest and funnel plots.
A: Operative time; B: Anastomotic time; C: Blood loss; D: LNs harvested.
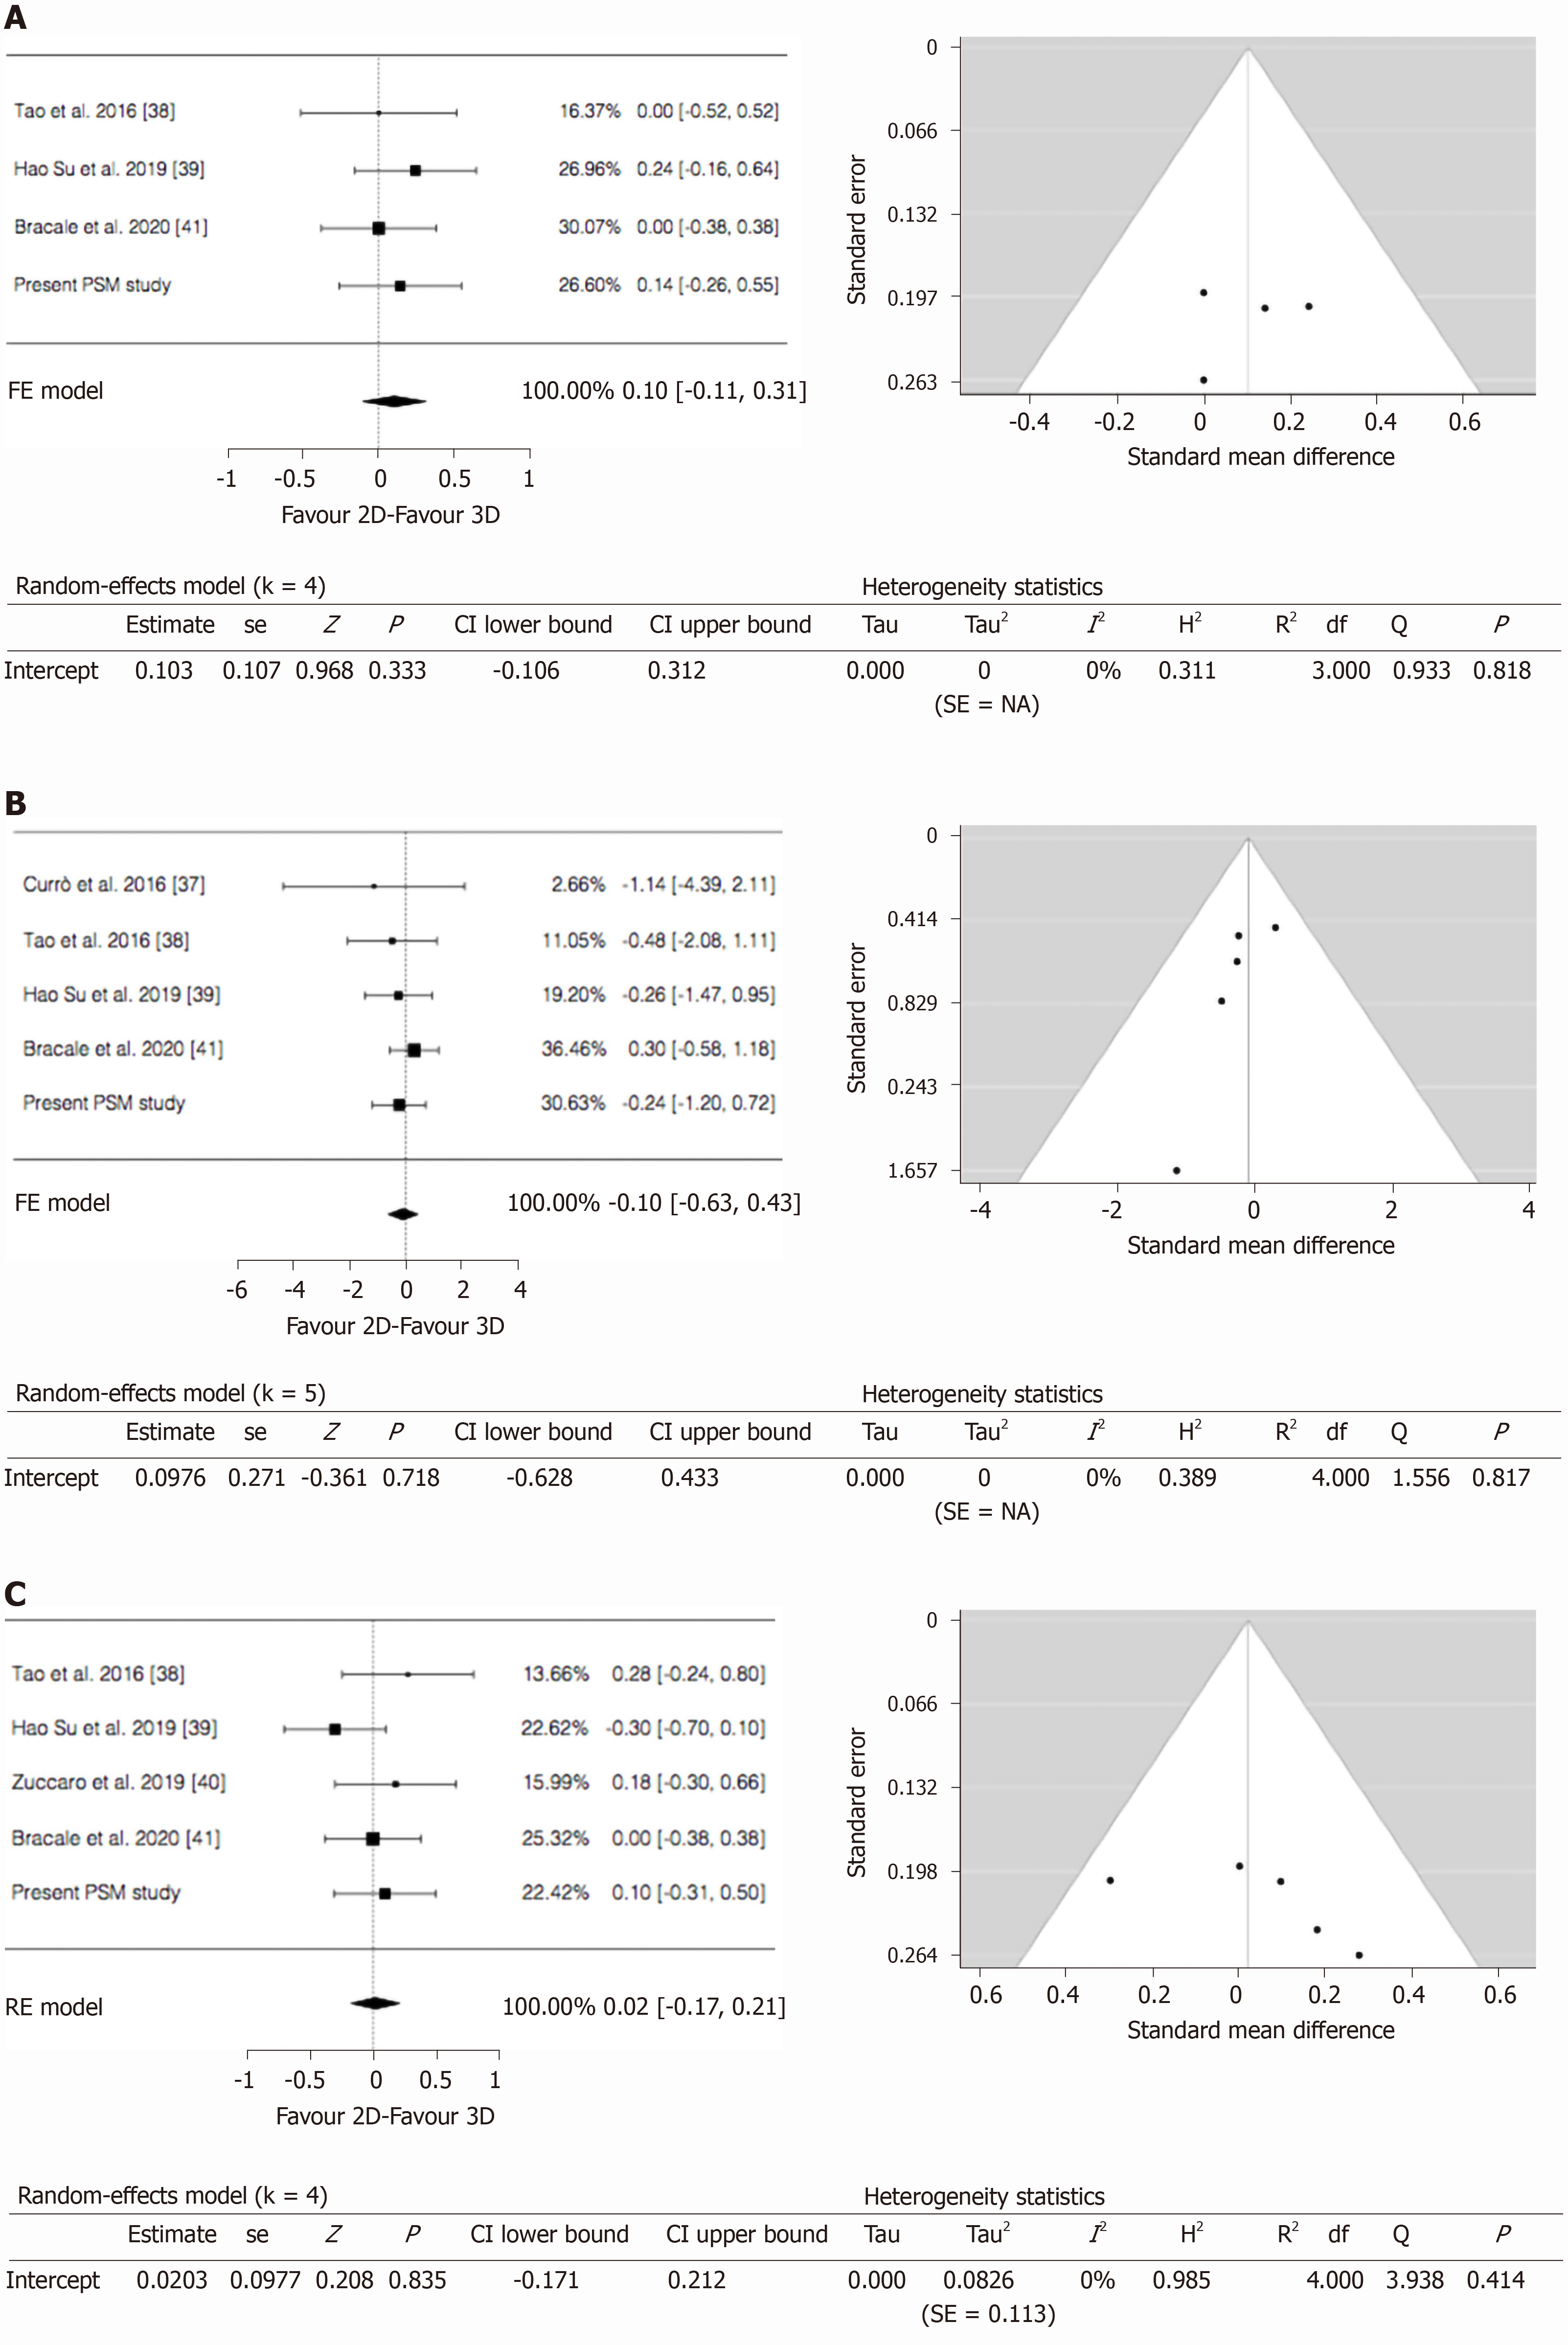
Figure 4 Forest and funnel plots.
A: Time to first flatus; B: Morbidity; and C: Length of stay.
- Citation: Costa G, Fransvea P, Lepre L, Rondelli F, Costa A, Campanelli M, Lisi G, Mastrangeli MR, Laracca GG, Garbarino GM, Ceccarelli G. 2D vs 3D laparoscopic right colectomy: A propensity score-matching comparison of personal experience with systematic review and meta-analysis. World J Gastrointest Surg 2021; 13(6): 597-619
- URL: https://www.wjgnet.com/1948-9366/full/v13/i6/597.htm
- DOI: https://dx.doi.org/10.4240/wjgs.v13.i6.597


