Copyright
©2012 Baishideng Publishing Group Co.
World J Diabetes. May 15, 2012; 3(5): 94-104
Published online May 15, 2012. doi: 10.4239/wjd.v3.i5.94
Published online May 15, 2012. doi: 10.4239/wjd.v3.i5.94
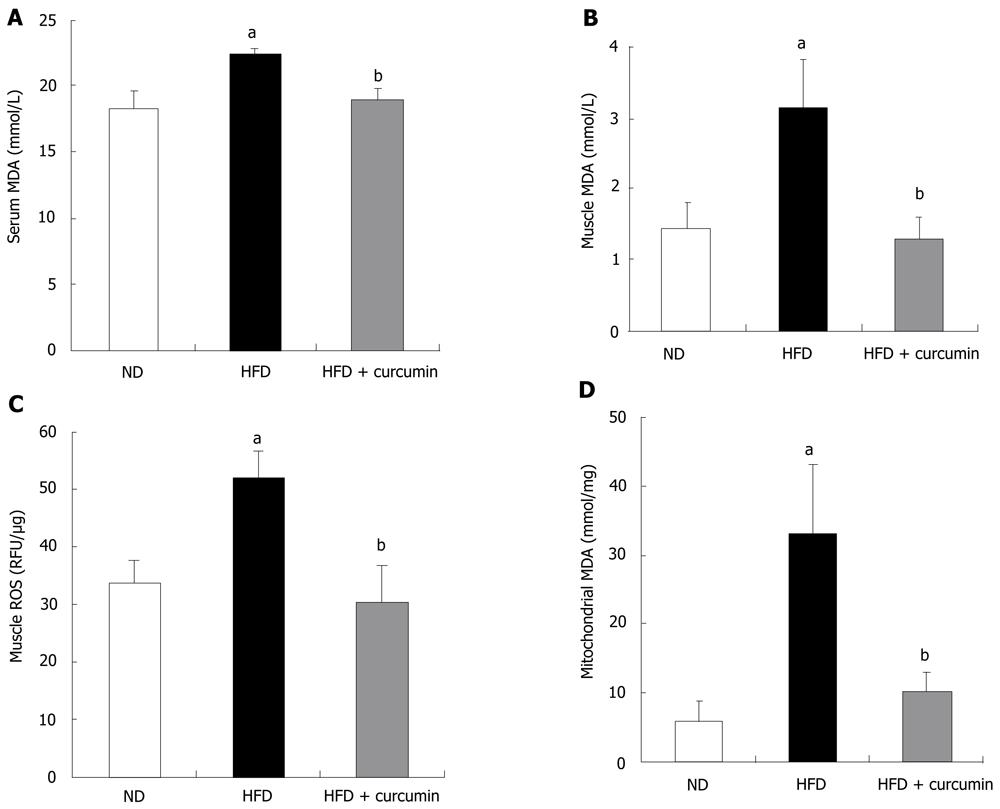
Figure 3 Effects of short term gavage of curcumin on malondialdehyde levels.
A: Serum malondialdehyde levels; B: Malondialdehyde levels in skeletal muscle; C: Reactive oxygen species level in whole cell lysates of skeletal muscle; D: Malondialdehyde levels in mitochondria of skeletal muscle. The mice were fed with indicated diets and gavaged with curcumin or vehicle. At the end of 18 wk following normal diet (ND, n = 10), high fat diet (HFD, n = 6) and HFD + curcumin (n = 6) treatments, the mice were sacrificed for blood and tissue collections. Serum was isolated, tissues were homogenized and mitochondria were isolated. Malondialdehyde assessments or reactive oxygen species assay were performed as described in “Materials and Methods”. aP < 0.001, HFD vs ND; bP < 0.001 HFD + curcumin vs HFD; cP < 0.01, HFD + curcumin vs HFD. MDA: Malondialdehyde; ROS: Reactive oxygen species.
- Citation: He HJ, Wang GY, Gao Y, Ling WH, Yu ZW, Jin TR. Curcumin attenuates Nrf2 signaling defect, oxidative stress in muscle and glucose intolerance in high fat diet-fed mice. World J Diabetes 2012; 3(5): 94-104
- URL: https://www.wjgnet.com/1948-9358/full/v3/i5/94.htm
- DOI: https://dx.doi.org/10.4239/wjd.v3.i5.94


