Copyright
©The Author(s) 2021.
World J Diabetes. Apr 15, 2021; 12(4): 499-513
Published online Apr 15, 2021. doi: 10.4239/wjd.v12.i4.499
Published online Apr 15, 2021. doi: 10.4239/wjd.v12.i4.499
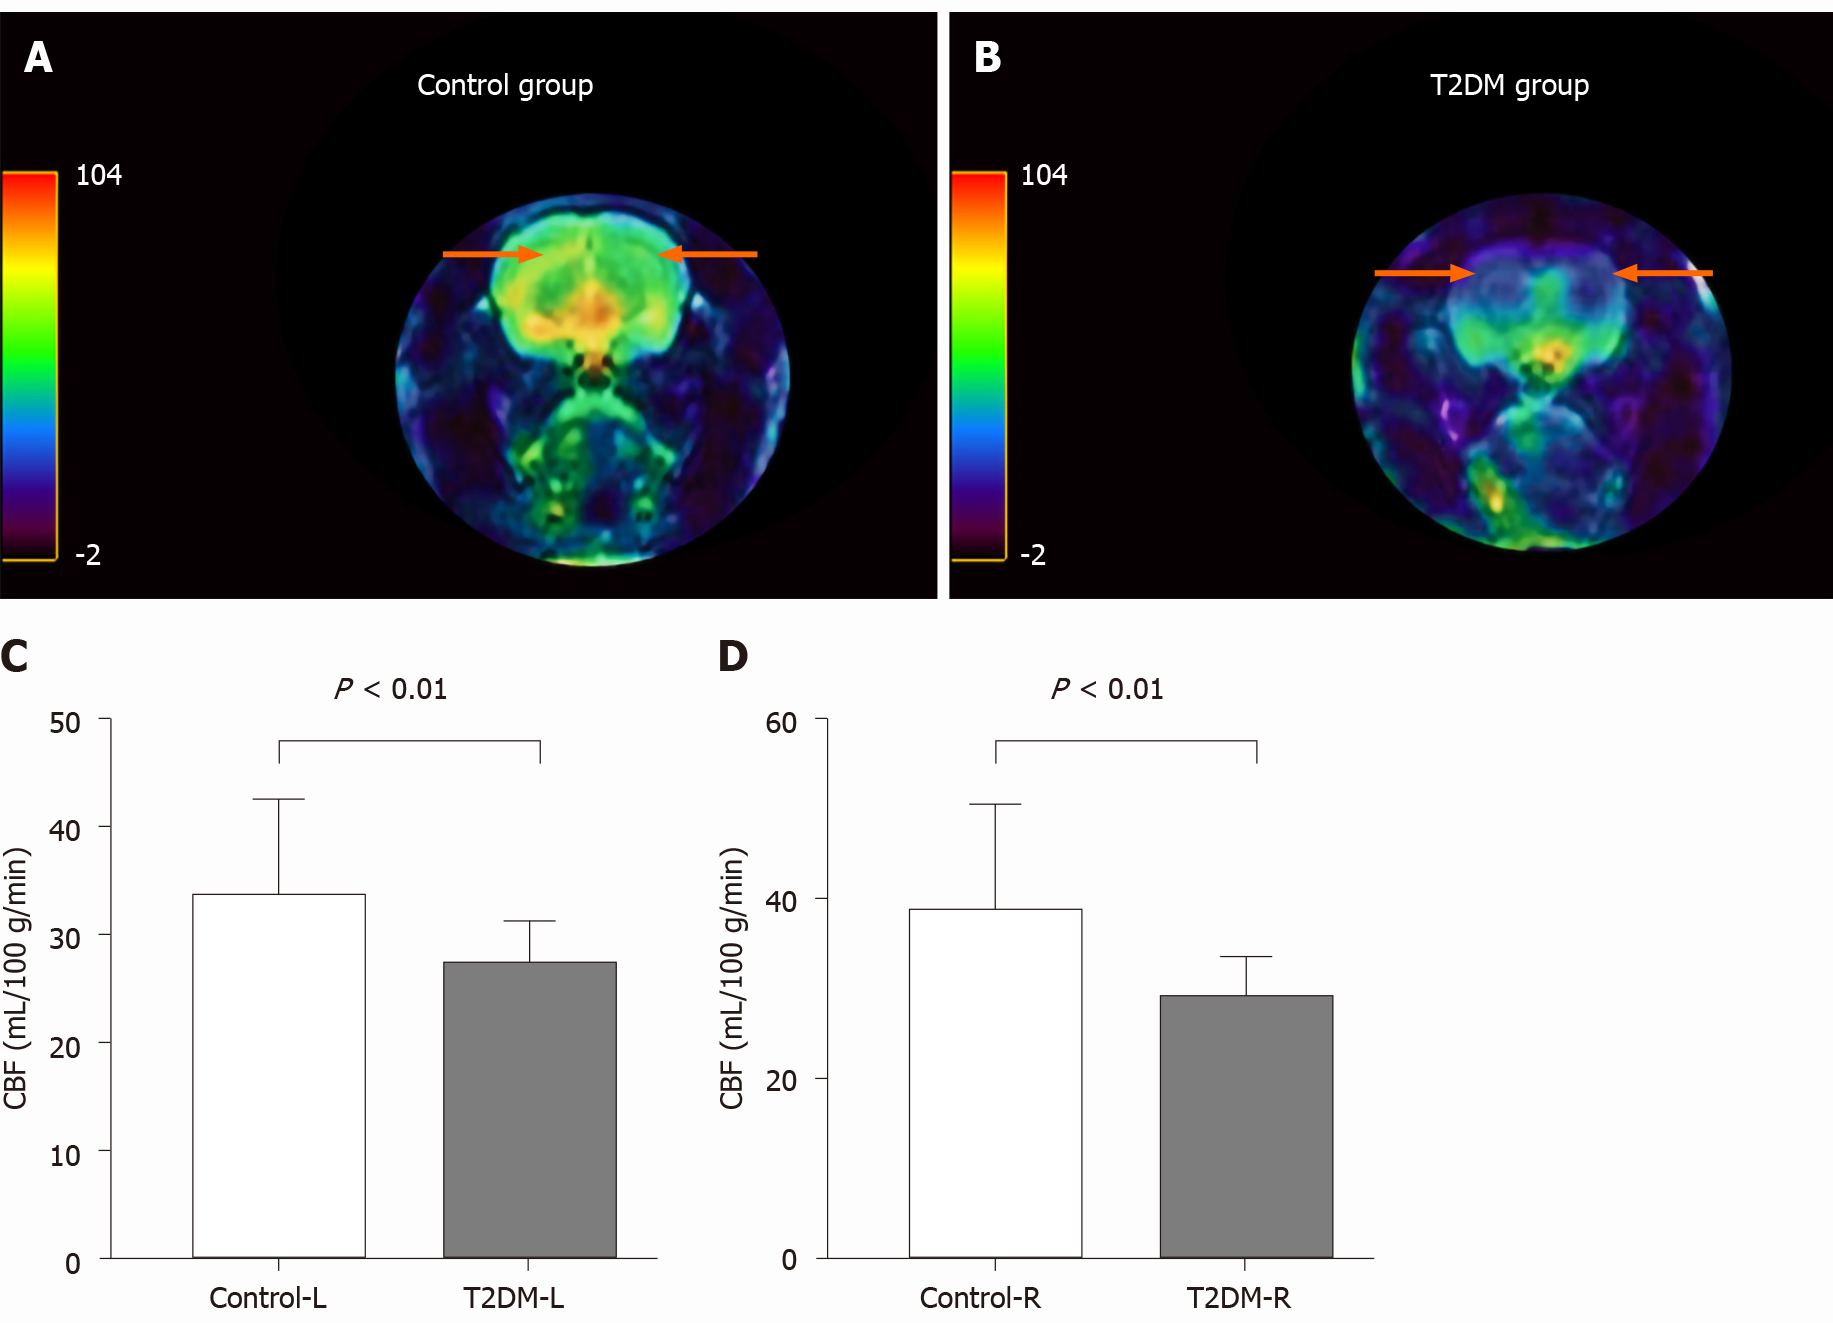
Figure 3 Comparison of cerebral blood flow in hippocampal area between type 2 diabetes mellitus group and control group.
A: Representative cerebral blood flow (CBF) images of the bilateral hippocampus area (orange arrow) in the control group; B: Representative CBF images of the bilateral hippocampus area (orange arrow) in type 2 diabetes mellitus (T2DM) group; C: Significantly different CBF values between the control and T2DM groups in the left hippocampus (P < 0.01); D: Significantly different CBF between the control and T2DM groups in the right hippocampus (P < 0.01).
- Citation: Shao JW, Wang JD, He Q, Yang Y, Zou YY, Su W, Xiang ST, Li JB, Fang J. Three-dimensional-arterial spin labeling perfusion correlation with diabetes-associated cognitive dysfunction and vascular endothelial growth factor in type 2 diabetes mellitus rat. World J Diabetes 2021; 12(4): 499-513
- URL: https://www.wjgnet.com/1948-9358/full/v12/i4/499.htm
- DOI: https://dx.doi.org/10.4239/wjd.v12.i4.499


