Copyright
©The Author(s) 2018.
World J Diabetes. Sep 15, 2018; 9(9): 149-156
Published online Sep 15, 2018. doi: 10.4239/wjd.v9.i9.149
Published online Sep 15, 2018. doi: 10.4239/wjd.v9.i9.149
Figure 1 The experimental protocol.
Group 1: Control rats with T2DM without therapy; Group 2: IpMI (rats treated with insulin prior to MI); Group 3: IaMI (rats treated with insulin after MI); Group 4: GLP1pMI (rats treated with GLP-1a prior to MI); Group 5: GLP1aMI (rats treated with GLP-1a after MI); Group 6: GLP1pMI + IaMI (rats treated with GLP-1a prior to MI and with insulin after MI).
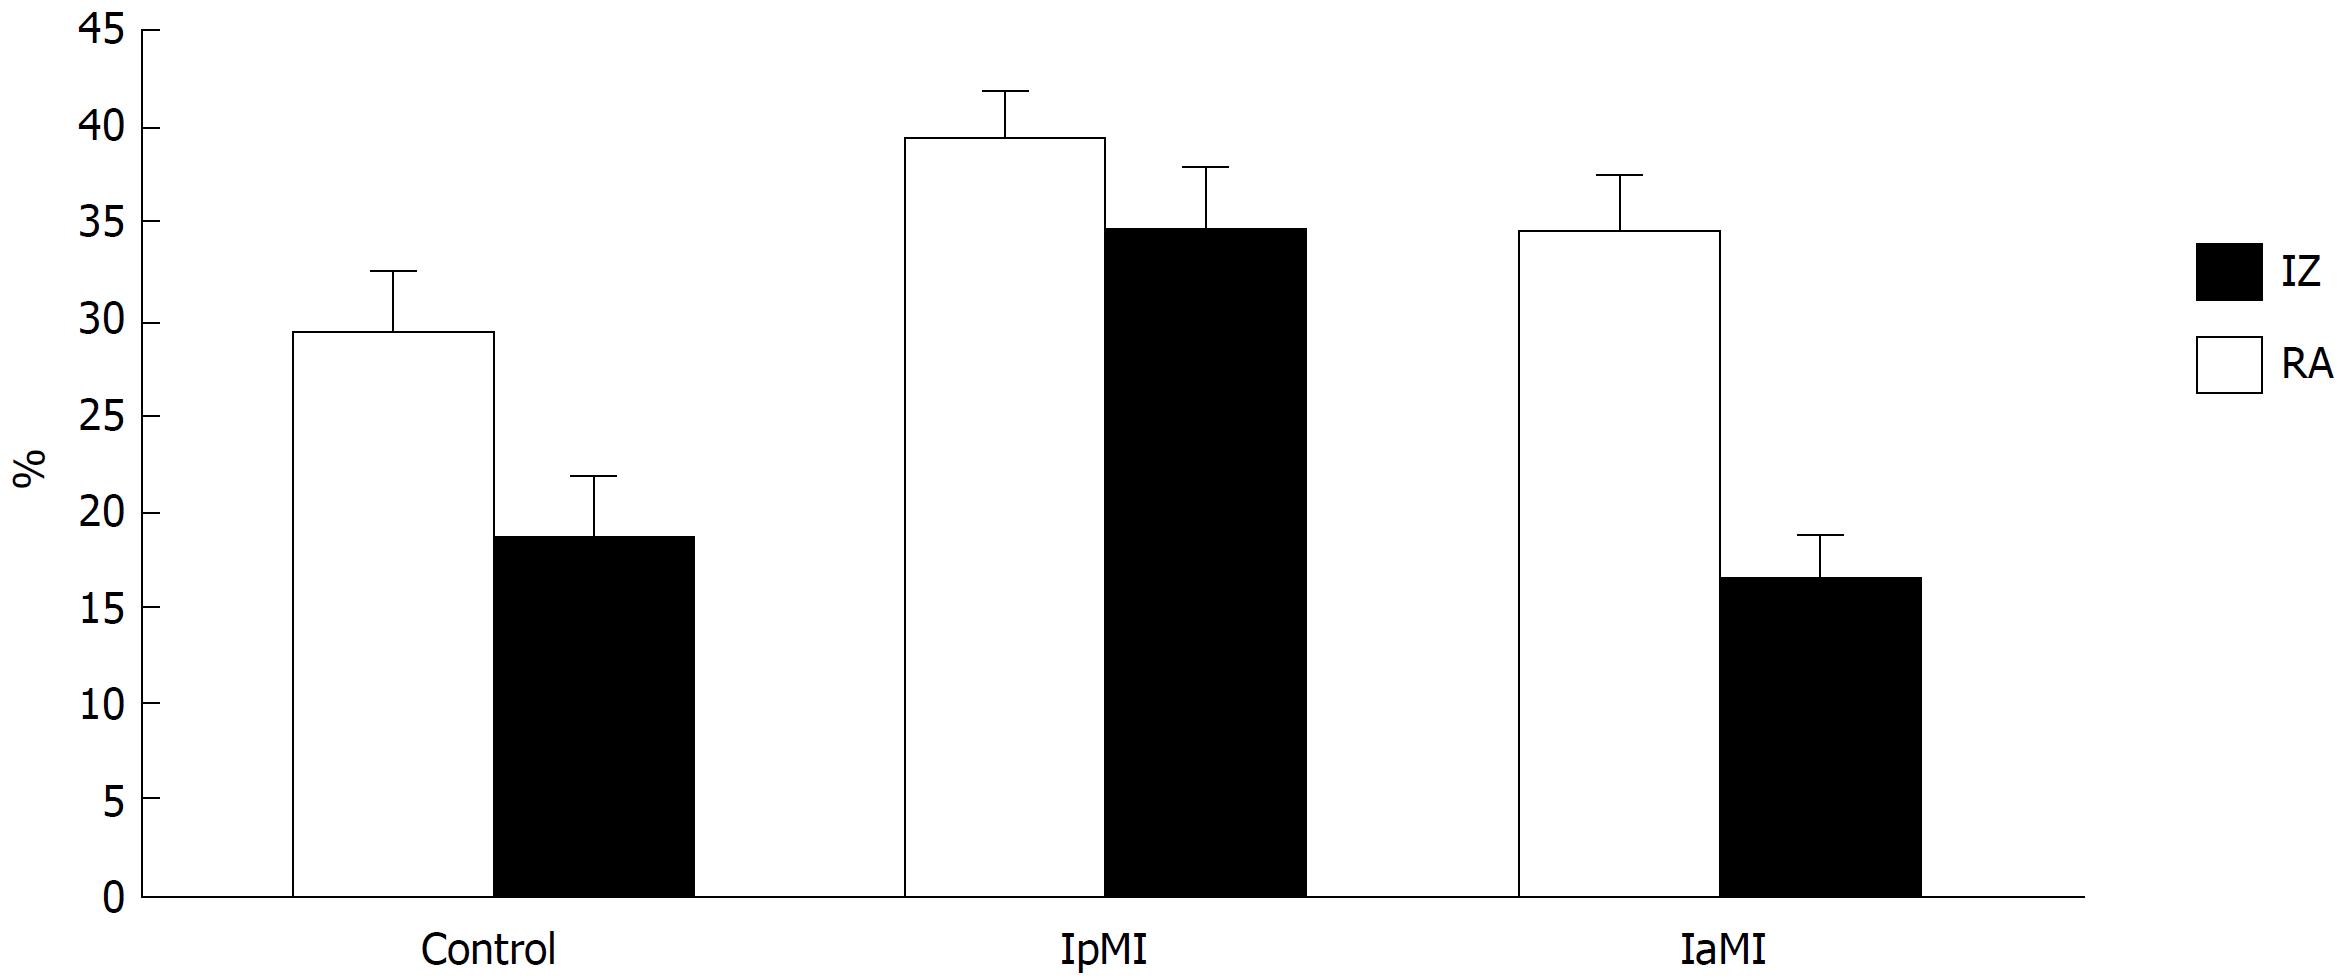
Figure 2 Comparison of the necrotic zone and zone at risk between different drugs.
Control: Rats with T2DM without therapy; IpMI: Rats treated with insulin prior to MI; IaMI: Rats treated with insulin after MI.
Figure 3 Comparison of the necrotic zone and zone at risk between different drugs.
GLP1pMI: Rats treated with GLP-1a prior to MI; GLP1aMI: Rats treated with GLP-1a after MI; GLP1pMI + IaMI: Rats treated with GLP-1a prior to MI and with insulin after MI.
- Citation: Zykov VA, Tuchina TP, Lebedev DA, Krylova IB, Babenko AY, Kuleshova EV, Grineva EN, Bayramov AA, Galagudza MM. Effects of glucagon-like peptide 1 analogs in combination with insulin on myocardial infarct size in rats with type 2 diabetes mellitus. World J Diabetes 2018; 9(9): 149-156
- URL: https://www.wjgnet.com/1948-9358/full/v9/i9/149.htm
- DOI: https://dx.doi.org/10.4239/wjd.v9.i9.149


