Copyright
©The Author(s) 2016.
World J Diabetes. Nov 15, 2016; 7(19): 523-533
Published online Nov 15, 2016. doi: 10.4239/wjd.v7.i19.523
Published online Nov 15, 2016. doi: 10.4239/wjd.v7.i19.523
Figure 1 Timeline of experiment.
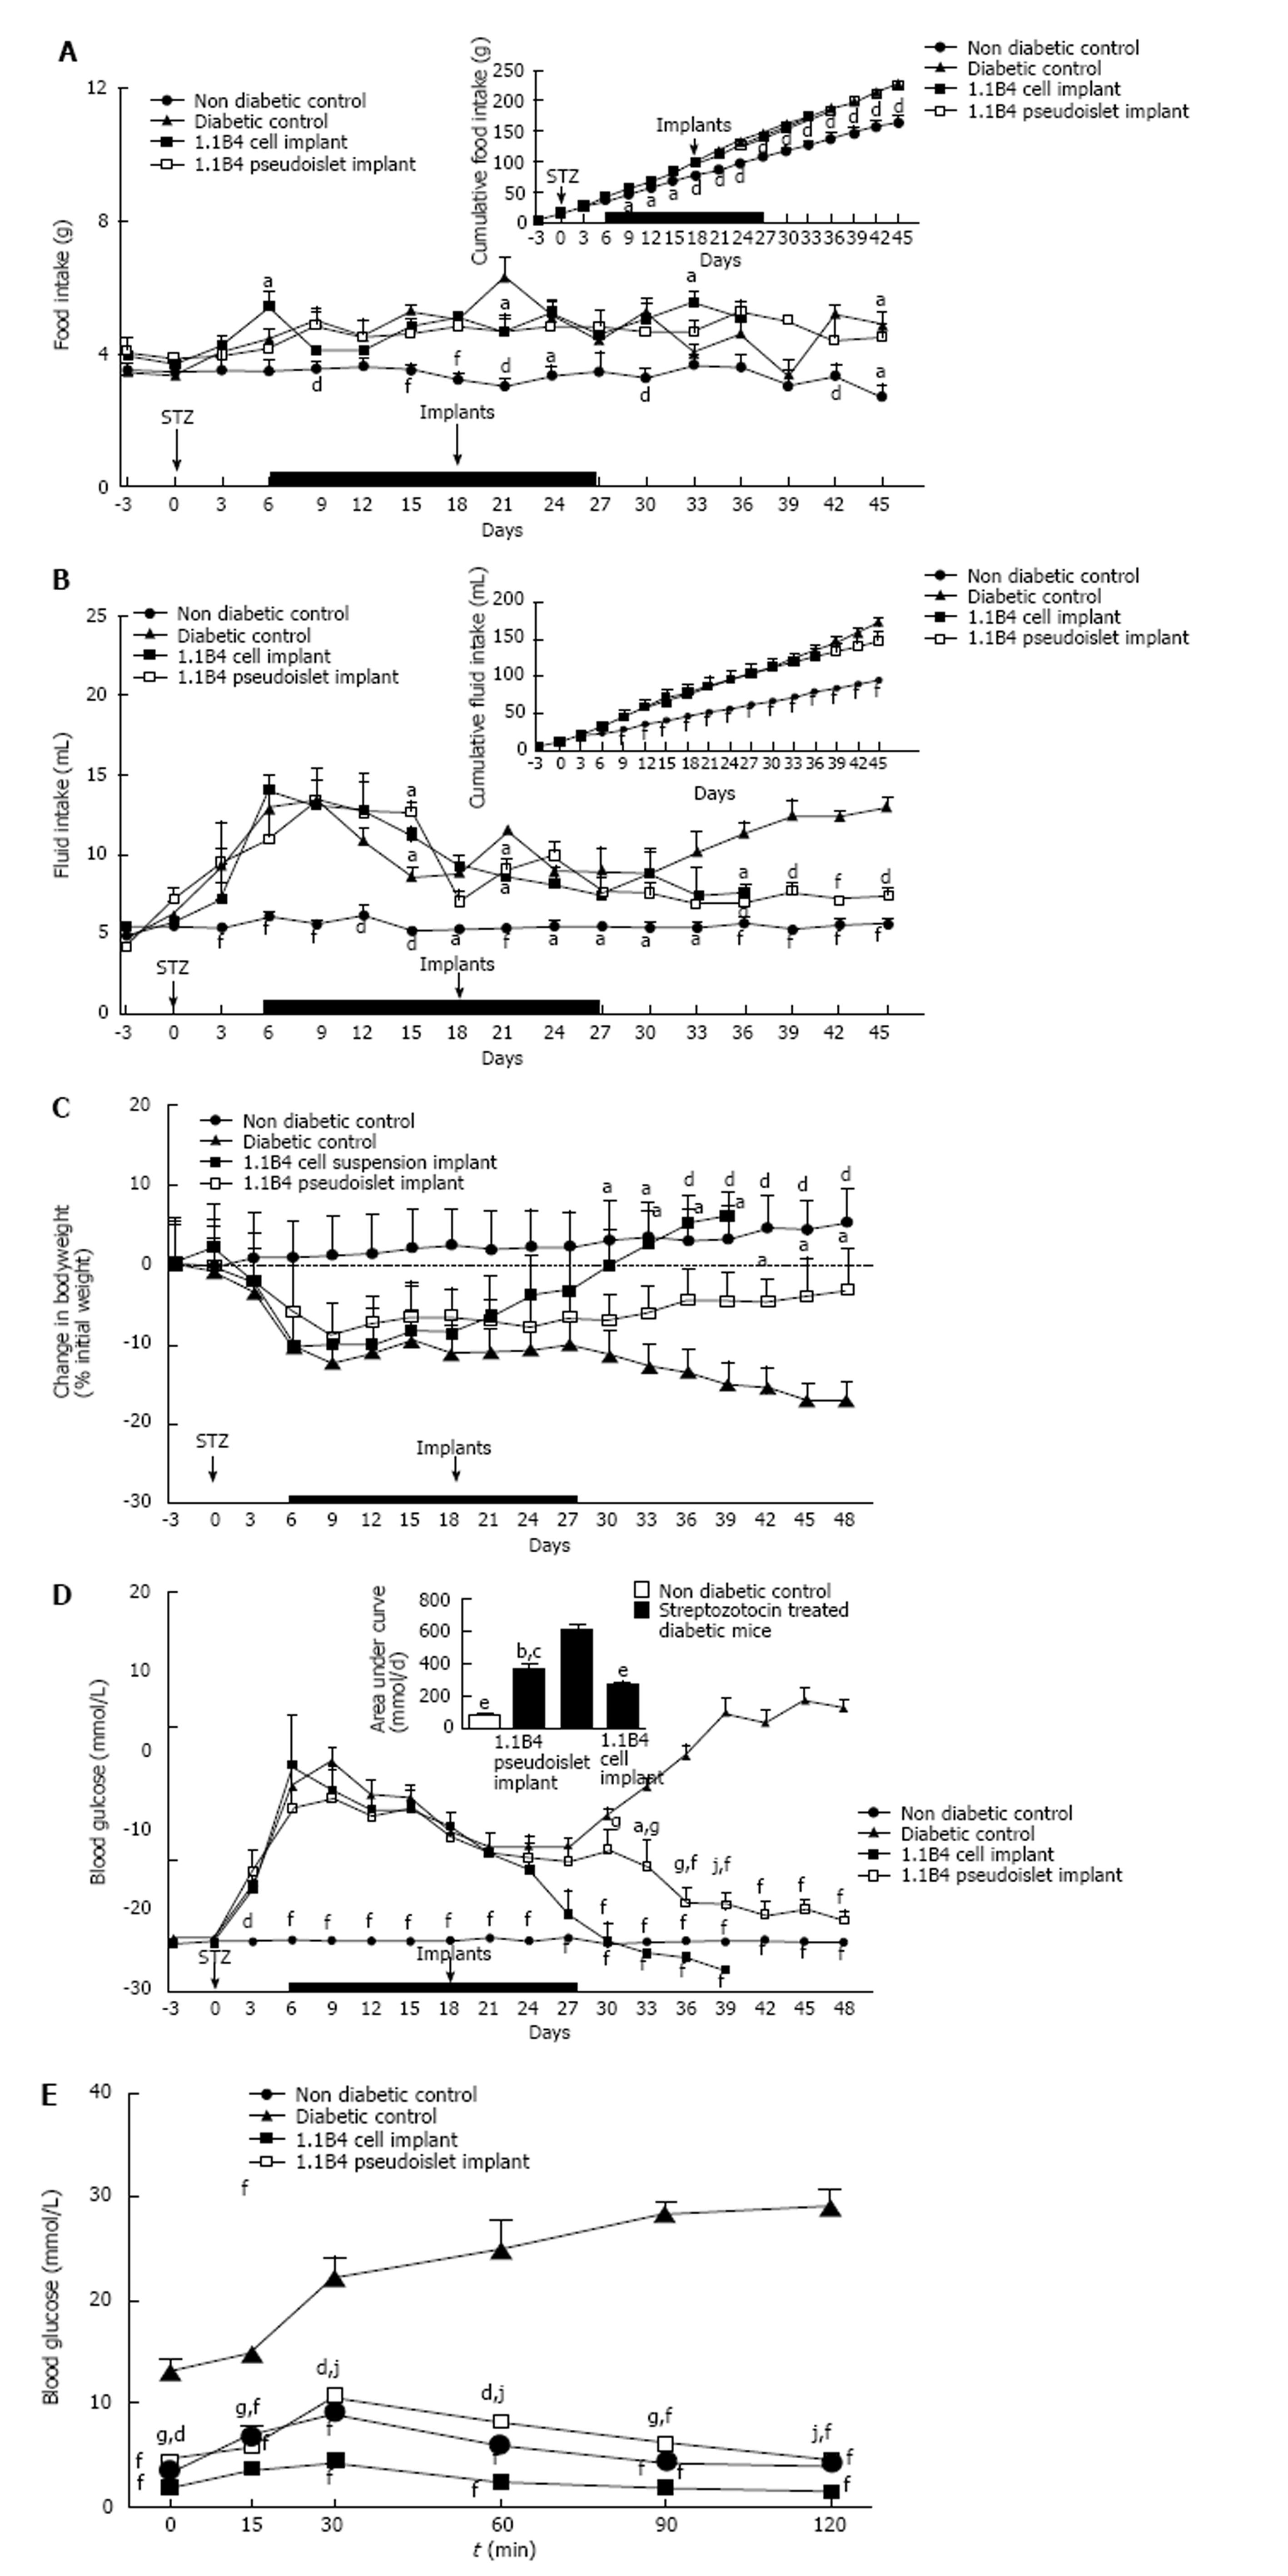
Figure 2 Effects on food and fluid intake, body weight and blood glucose of streptozotocin diabetic severe combined immunodeficient mice implanted with 1.
1B4 cells/ pseudoislets. A: Food intake; B: Fluid intake; C: Change in body weight; D: Blood glucose. From day 6-27, all diabetic mice were injected with insulin (15 U/kg bw) every 8 h (Indicated by black bar). At the end of the study, glucose tolerance (E) was determined over a time course of 120 min. Values are mean ± SEM (n = 4). aP < 0.05, dP < 0.01 and fP < 0.001 vs diabetic control animals; gP < 0.05, jP < 0.01 vs 1.1B4 cell suspension recipients.
Figure 3 Insulin content (A) of excised 1.
1B4 cell/pseudoislet cell masses and the effects of implantation on plasma insulin (B), pancreatic insulin content (C), plasma glucagon (D) and pancreatic glucagon content (E) of normal and streptozotocin diabetic severe combined immunodeficient mice. Values are mean ± SEM (n = 4). aP < 0.05, dP < 0.01, eP < 0.01 vs diabetic control animals.
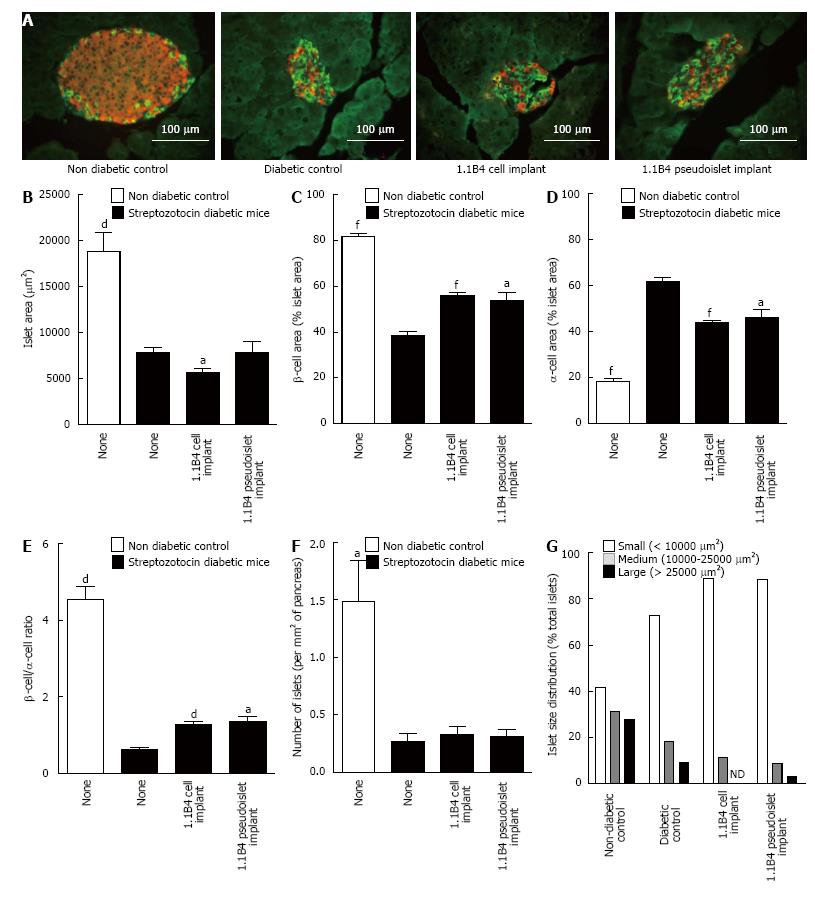
Figure 4 Result of insulin (red) and glucagon (green) staining in islets of non-diabetic and diabetic severe combined immunodeficient mice with or without cell/pseudoislet transplantation.
Representative images are shown in A. Islet area (B), β cell area (C), α cell area (D), β to α cell ratio (E), number of islets (F), and islet size distribution (G) were all determined by quantitative histological analysis using cell^F software. Values are mean ± SEM (n = 5). aP < 0.05, dP < 0.01 and fP < 0.001 vs diabetic control.
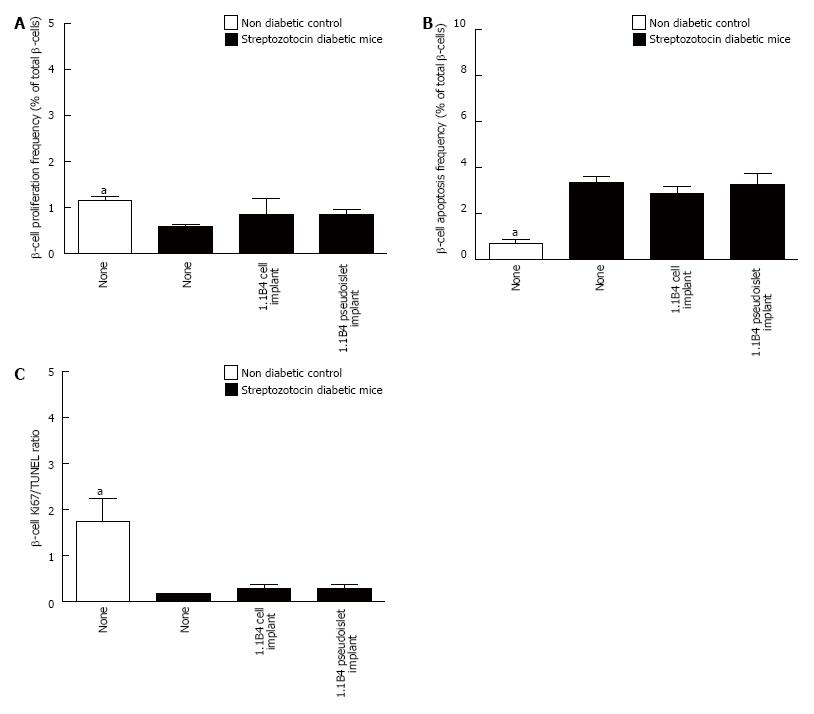
Figure 5 Frequency of β-cell proliferation (A) and apoptosis (B) and ratio of Ki67 to TUNEL positive β-cells (C) were determined by histological analysis.
Values are mean ± SEM (n = 4). Approximately 1000 β-cells were counted per replicate. aP < 0.05 vs diabetic controls.
- Citation: Green AD, Vasu S, McClenaghan NH, Flatt PR. Implanting 1.1B4 human β-cell pseudoislets improves glycaemic control in diabetic severe combined immune deficient mice. World J Diabetes 2016; 7(19): 523-533
- URL: https://www.wjgnet.com/1948-9358/full/v7/i19/523.htm
- DOI: https://dx.doi.org/10.4239/wjd.v7.i19.523


