Copyright
©The Author(s) 2016.
World J Diabetes. Jul 10, 2016; 7(13): 271-278
Published online Jul 10, 2016. doi: 10.4239/wjd.v7.i13.271
Published online Jul 10, 2016. doi: 10.4239/wjd.v7.i13.271
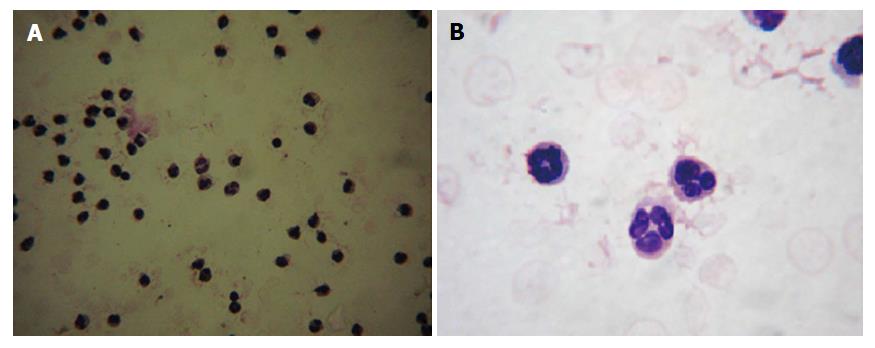
Figure 1 Morphological analysis of isolated neutrophils.
Isolated neutrophils were smeared on a glass slide and labeled with Leishman stain. Under the 20 × magnification, cells appeared homogeneous (A) and 40 × magnification exhibited the multi-lobulated nucleus (B).
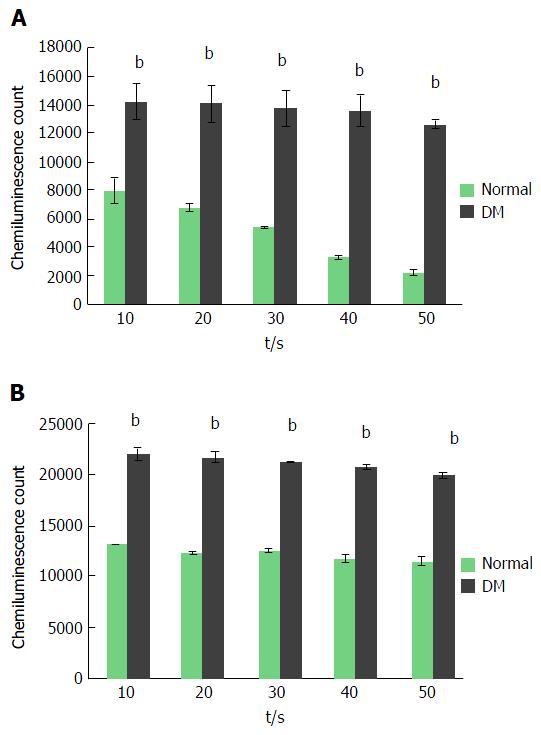
Figure 2 Temporal analysis of reactive oxygen species secreted by neutrophils of non-diabetic and diabetic subjects.
Isolated neutrophils were measured for ROS secretion via chemiluminescence method at every 10 s over a period of 50 s. Neutrophils isolated from diabetic patients showed a higher and consistent secretion of ROS in resting condition (A). PMA stimulation elevated the ROS secretion from neutrophils of both non-diabetic and diabetic subjects. Neutrophils from diabetic patients produced a higher amount of ROS compared to non-diabetic subjects. ROS production was determined at every 10 s beginning from the administration of PMA to the time point where the ROS production reached a maximal level and started to decline (B). Data expressed as mean ± SD and the statistical significance was determined at bP value ≤ 0.001. ROS: Reactive oxygen species; PMA: Phorbol myristate acetate.
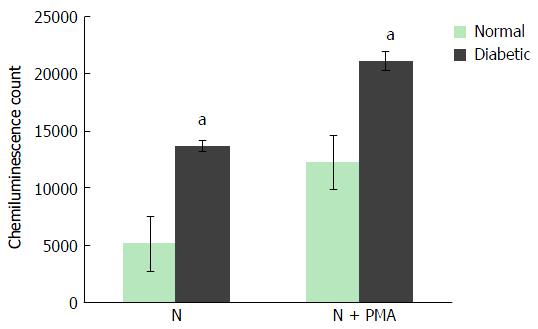
Figure 3 Total reactive oxygen species produced by neutrophils of non-diabetic and diabetic subjects.
Neutrophils isolated from non-diabetic individuals and diabetic patients subjected for ROS secretion at resting condition and upon stimulation with PMA. The maximal production of ROS at any time point over a period of 50 s was recorded and compared. Neutrophils from diabetic patients showed a higher production of ROS at resting and activated conditions. Data expressed as mean ± SD and the statistical significance was determined at aP value ≤ 0.05. ROS: Reactive oxygen species; PMA: Phorbol myristate acetate.
- Citation: Ridzuan N, John CM, Sandrasaigaran P, Maqbool M, Liew LC, Lim J, Ramasamy R. Preliminary study on overproduction of reactive oxygen species by neutrophils in diabetes mellitus. World J Diabetes 2016; 7(13): 271-278
- URL: https://www.wjgnet.com/1948-9358/full/v7/i13/271.htm
- DOI: https://dx.doi.org/10.4239/wjd.v7.i13.271


