Copyright
©The Author(s) 2015.
World J Diabetes. Apr 15, 2015; 6(3): 517-526
Published online Apr 15, 2015. doi: 10.4239/wjd.v6.i3.517
Published online Apr 15, 2015. doi: 10.4239/wjd.v6.i3.517
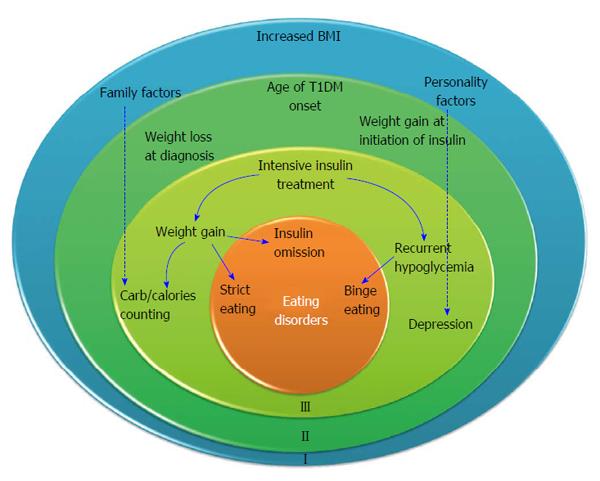
Figure 1 Three level models describing the development of eating disorders in adolescents with type 1 diabetes mellitus.
The outer circle delineates the premorbid status. The middle circle delineates weight changes at diagnosis and with initiation of treatment. The inner circle includes factors associated with the management of T1DM that predispose to eating disorders. Dashed arrows imply that the specific factor extends on all levels. T1DM: Type 1 diabetes mellitus; BMI: Body mass index.
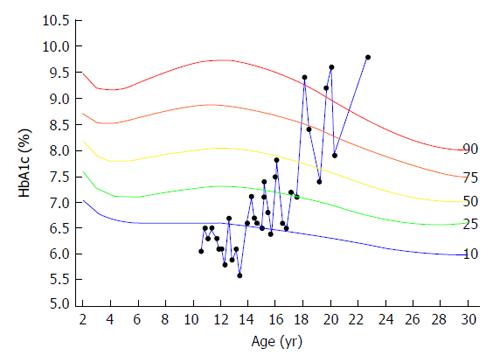
Figure 2 Typical example of the course of HbA1c levels in a patient, with intentional insulin omission for weight loss, plotted on the HbA1c percentile reference curves.
HbA1c levels were around the 10th percentile from age 10 to 14 years. From age 18 the pattern changed and was characterized by sharp increases to levels above the 90th percentile, sharp decreases and multiple measurements above the 90th percentile.
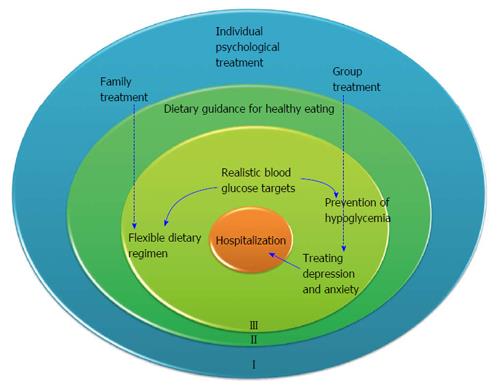
Figure 3 Three level models describing treatment modalities of eating disorders in adolescents with type 1 diabetes mellitus.
The outer circle addresses treatment for premorbid variables. The middle circle delineates. The inner circle includes factors associated with the management of T1DM that predispose to eating disorders. T1DM: Type 1 diabetes mellitus.
- Citation: Pinhas-Hamiel O, Hamiel U, Levy-Shraga Y. Eating disorders in adolescents with type 1 diabetes: Challenges in diagnosis and treatment. World J Diabetes 2015; 6(3): 517-526
- URL: https://www.wjgnet.com/1948-9358/full/v6/i3/517.htm
- DOI: https://dx.doi.org/10.4239/wjd.v6.i3.517


