Copyright
©The Author(s) 2015.
World J Diabetes. Mar 15, 2015; 6(2): 338-344
Published online Mar 15, 2015. doi: 10.4239/wjd.v6.i2.338
Published online Mar 15, 2015. doi: 10.4239/wjd.v6.i2.338
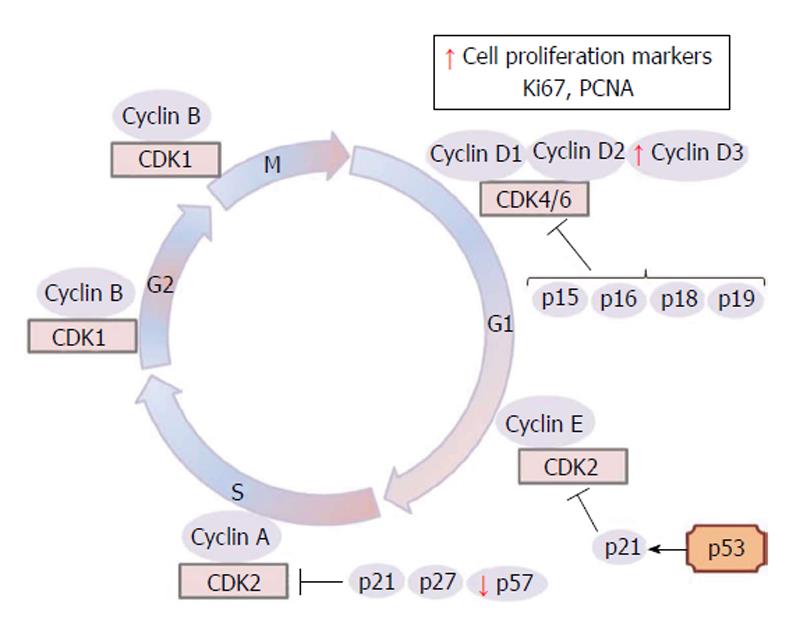
Figure 1 Schematic representation of eukaryotic cell cycle and key regulatory proteins which allow the transition from one cell cycle phase to another.
CDKs inhibitors, such as p15, p16, p18, p19 (INK4 group), p21, p27 and p57 (CIP/KIP class) and proliferative markers are also showed. The arrows in red indicate increased or decreased expression of some trophoblast key regulatory proteins, CDKs inhibitors and proliferative markers in maternal diabetes. G1: Gap 1 phase; S: synthesis phase; G2: Gap 2 phase; M: Mitosis; CDKs: Cyclin-dependent kinases; PCNA: Proliferating cell nuclear antigen; p53: Tumor protein p53.
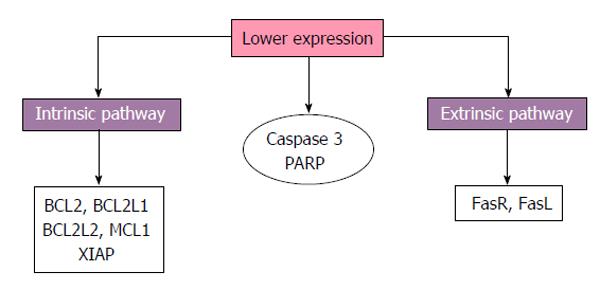
Figure 2 Schematic representation of trophoblast apoptosis findings in maternal diabetes.
Reduced expression of apoptotic components from both intrinsic and extrinsic pathways, caspase-3 and poly (ADP-ribose) polymerase (PARP) are reported by some works. FasR: Fas receptor; FasL: Fas ligand; MCL1: Myeloid cell leukemia 1; BCL2: B-cell lymphoma 2; BCL2L1: BCL2-like 1; XIAP: X-linked inhibitor of apoptosis; BCL2L2: BCL2-like 2.
- Citation: Aires MB, Santos ACVD. Effects of maternal diabetes on trophoblast cells. World J Diabetes 2015; 6(2): 338-344
- URL: https://www.wjgnet.com/1948-9358/full/v6/i2/338.htm
- DOI: https://dx.doi.org/10.4239/wjd.v6.i2.338


