Copyright
©2014 Baishideng Publishing Group Co.
World J Diabetes. Apr 15, 2014; 5(2): 97-114
Published online Apr 15, 2014. doi: 10.4239/wjd.v5.i2.97
Published online Apr 15, 2014. doi: 10.4239/wjd.v5.i2.97
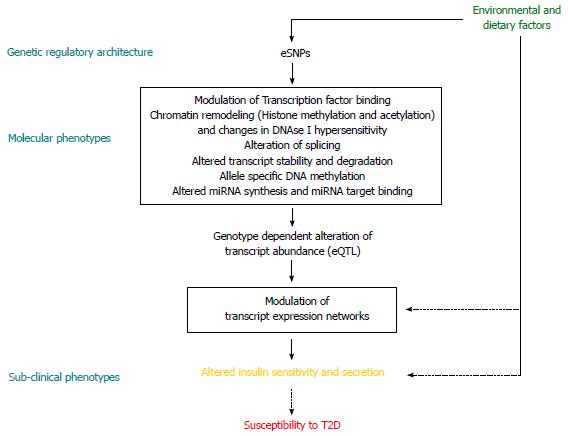
Figure 1 A causal model of genetic susceptibility.
Genetic regulatory architecture modulates molecular phenotypes in interaction with environmental factors and alters disease susceptibility. eSNP: Expression regulatory SNP; eQTL: Expression quantitative trait loci; T2D: Type 2 diabetes.
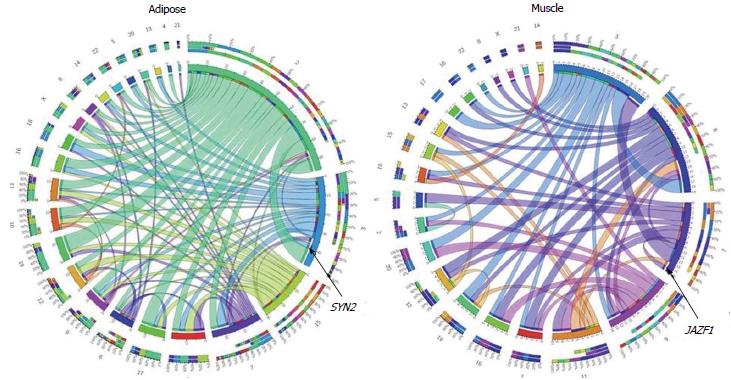
Figure 2 Type 2 diabetes or glucose homeostasis traits associated variants are expression regulatory SNP.
We tested Cis and Trans regulatory role of 68 SNPs that showed reproducible associations with T2D or Glucose homeostasis traits[72]. At a threshold of P < 0.0001, 25 and 19 of these SNPs in adipose and muscle, respectively, showed association with expression of a cis- or trans-transcript. This figure represents a CIRCOS plot of eQTL and eSNP chromosomal location relationships, indicating the predominance of trans-regulation among 183 and 62 significant (P < 0.0001) eQTL-eSNPs associations in adipose and muscle respectively. Rare cis-regulation (SYN2 in adipose and JAZF1 in muscle) is marked. eSNP: Expression regulatory SNP; eQTL: Expression quantitative trait loci; T2D: Type 2 diabetes.
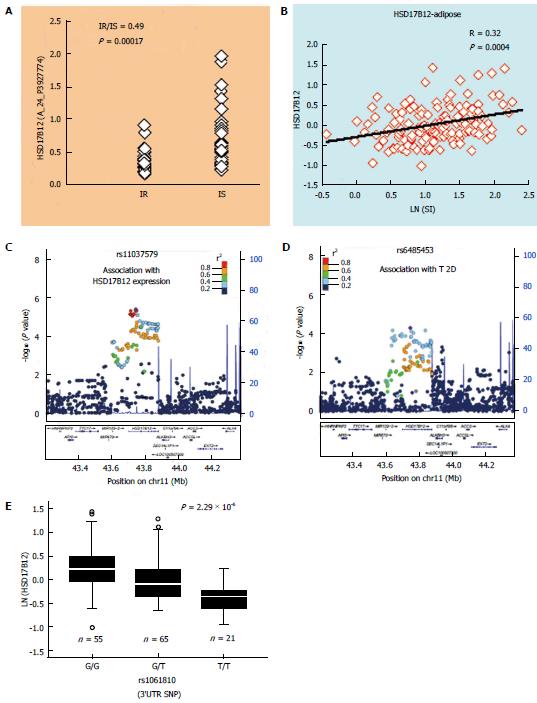
Figure 3 Prioritizing type 2 diabetes-associated variants by expression quantitative trait loci analysis: An example.
HSD17B12 is one of 172 genes differentially expressed in adipose tissue of insulin-resistant (IR, n = 31) vs insulin-sensitive (IS, n = 31) subjects in a genome-wide study (A) by Elbein et al[76]. Its expression in subcutaneous adipose of non-diabetic subjects (n = 141) also shows a significant correlation (B) with insulin sensitivity (SI). Strongest cis-eSNP for adipose tissue (C) expression of HSD17B12 (in adipose eQTL from the MuTHER project)[55] is also associated with T2D (D) in a large GWAS meta-analysis (in DIAGRAM.v3 data from 12171 T2D and 56862 controls)[13]. This locus also includes a 3’UTR SNP rs1061810 that shows association (E) with T2D and expression of HSD17B12 (in qRT-PCR analysis in adipose tissue from 141 non-diabetic subjects). eSNP: Expression regulatory SNP; eQTL: Expression quantitative trait loci; T2D: Type 2 diabetes.
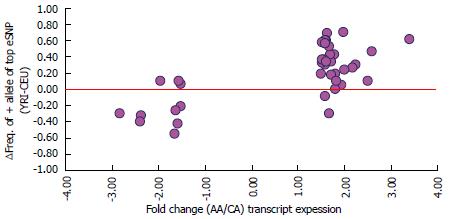
Figure 4 Population differences in expression of transcripts in adipose tissue is accounted for by the effect allele frequency difference of expression regulatory SNPs among racial groups.
X axis: Fold change in average expression of 41 transcripts between African-American (AA, n = 37) and Caucasian (CA, n = 99) subjects. Y axis: Differences in strongest eSNP allele frequency of these transcripts between HapMap subjects of Caucasian (CEU) and African (YRI) ancestry for alleles associated with higher expression. eSNP: Expression regulatory SNP.
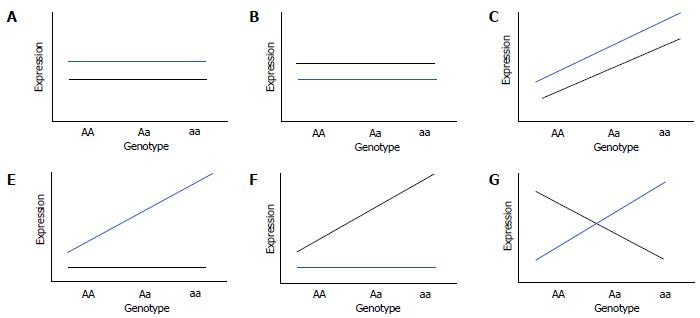
Figure 5 Types of gene-by-environment interactions in cellular genomic models to study gene-by-environment expression quantitative trait locis.
Cells from a cohort of subjects are grown in pairs under uniform in vitro treated and untreated conditions to study environment-dependent or -independent effects of genotype on expression of transcripts (a quantitative trait). β1 and β2 are genotype effects on transcript expression under treated and control conditions, respectively. Different models of gene-by-environment (GXE) includes Null model: β1 = β2 = 0 (A and B); No-interaction eQTL model: β1 = β2 ≠ 0 (C); Treated-only expression quantitative trait loci model: β1 ≠ 0 and β2 = 0 (D); Control-only eQTL model: β1 = 0 and β2 ≠ 0 (E); and General interaction eQTL model: β1 ≠ 0 and β2 ≠ 0 but β1 ≠β2 (F). Black line indicates expression in cells under control condition (untreated) while blue line indicates expression in environmental/dietary factor treated cells.
- Citation: Das SK, Sharma NK. Expression quantitative trait analyses to identify causal genetic variants for type 2 diabetes susceptibility. World J Diabetes 2014; 5(2): 97-114
- URL: https://www.wjgnet.com/1948-9358/full/v5/i2/97.htm
- DOI: https://dx.doi.org/10.4239/wjd.v5.i2.97


