Copyright
©2013 Baishideng Publishing Group Co.
World J Diabetes. Aug 15, 2013; 4(4): 145-150
Published online Aug 15, 2013. doi: 10.4239/wjd.v4.i4.145
Published online Aug 15, 2013. doi: 10.4239/wjd.v4.i4.145
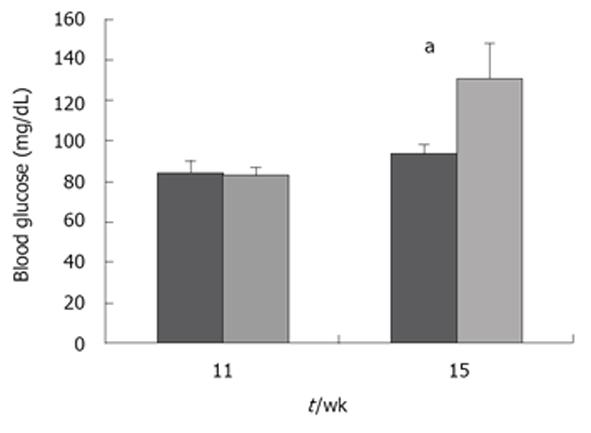
Figure 1 Comparison of blood glucose (mg/dL) in non-obese diabetic (dark gray bars) and syngenic non-diabetic (light gray bars) mice at 11 and 15 wk demonstrates initiation of the type 1 diabetic phenotype.
Error bars represent SEM. At five, eight (data not shown) and eleven there was no difference in blood glucose levels between strains of mice. aHowever at 15 wk, non-obese diabetic mice had significantly greater blood glucose than NOD.scid mice and concentration was indicative of diabetes (< 120 mg/dL).
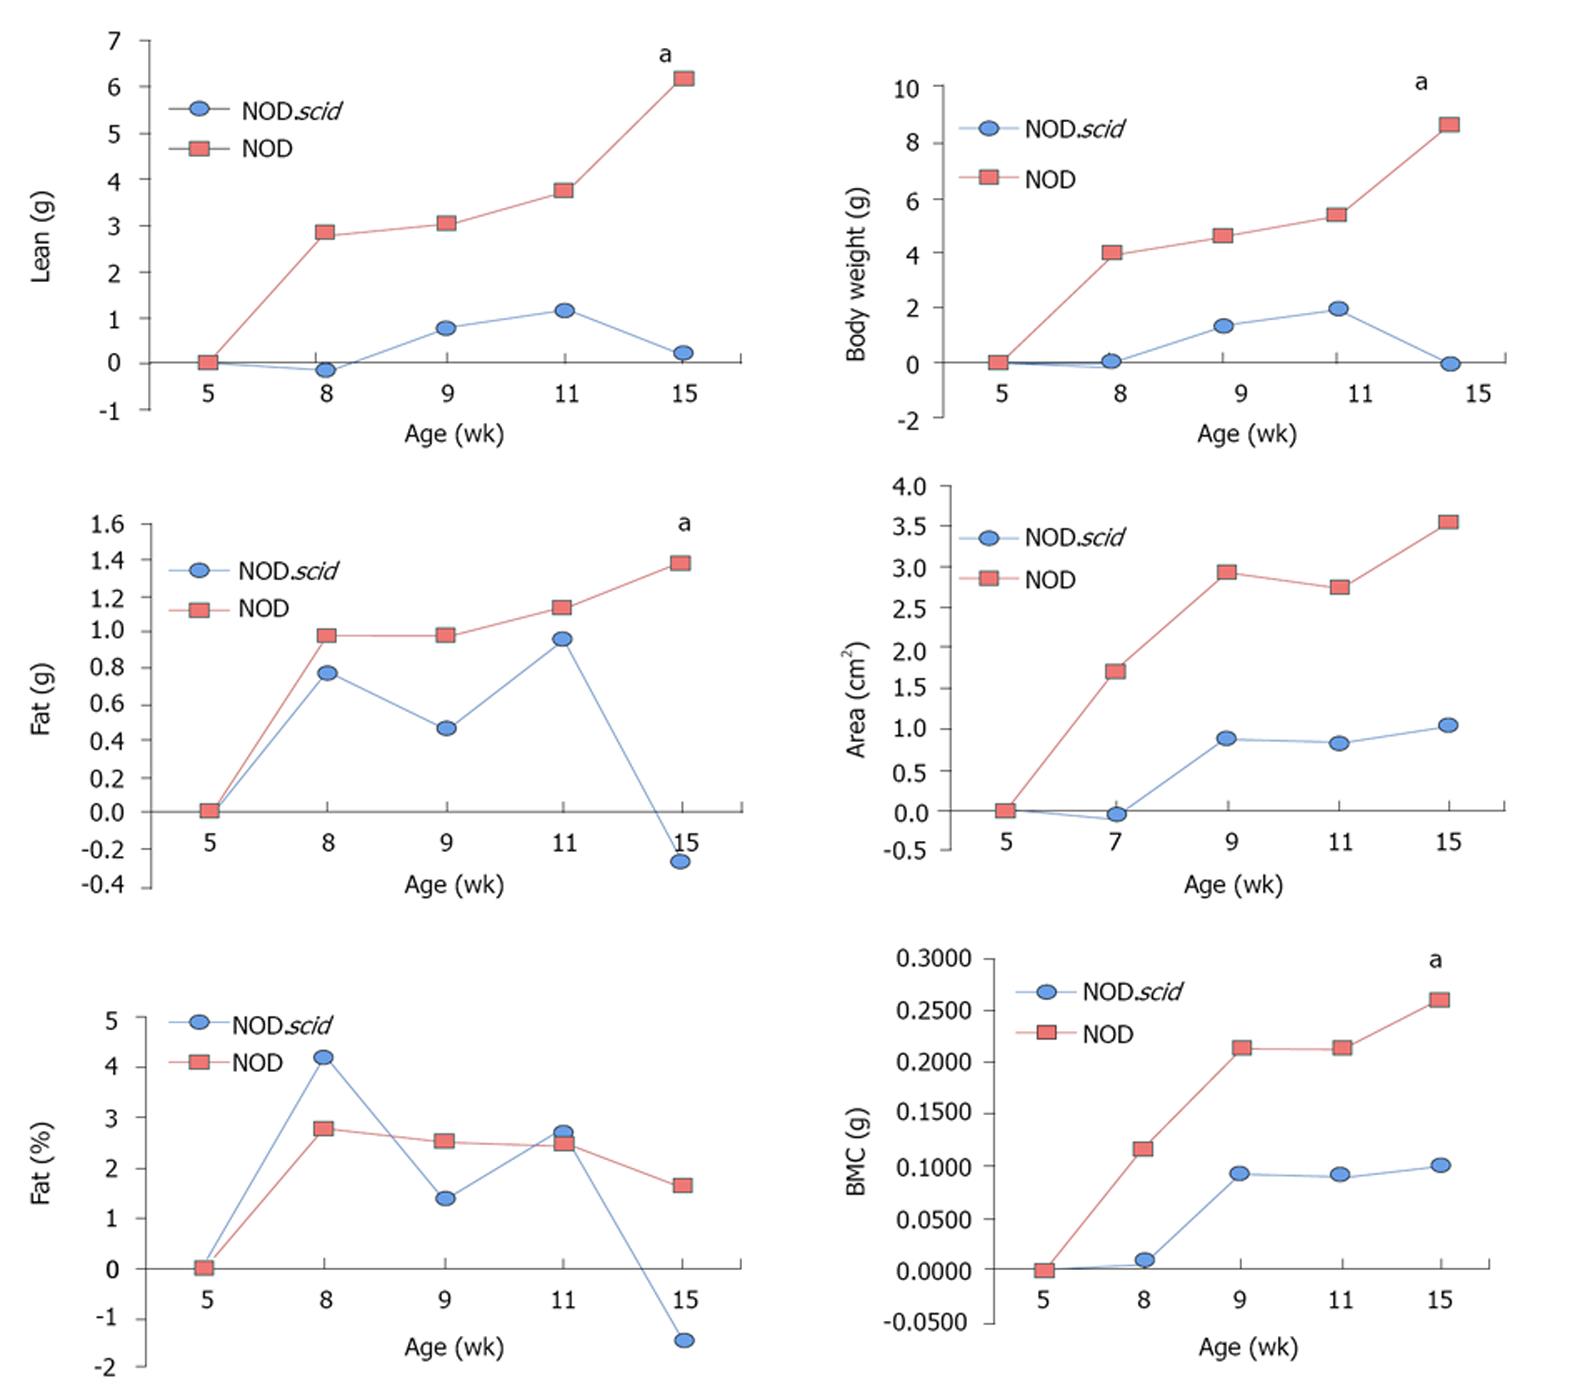
Figure 2 Comparison of changes in body composition parameters as assessed by dual-energy X-ray absorptiometry at 5, 8, 11 and 15 wk.
aNon-obese diabetic mice were significantly heavier.
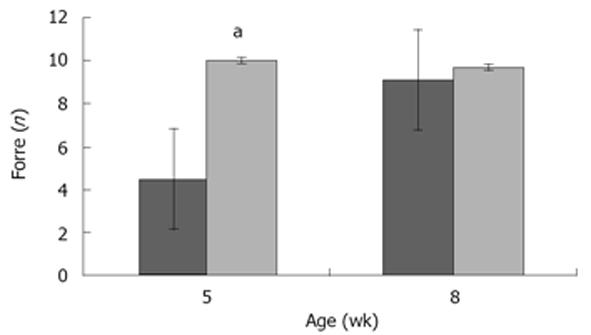
Figure 3 Tibia strength by 3-point breakage analysis using the NTS 85MTS Minibionix8 with a 100 N load cell.
The span was 9 mm and the bones were loaded with a rate of 0.1 mm/s to evaluate maximum load to failure in 5 and 8 wk in non-obese diabetic (dark gray bars) and syngenic non-diabetic (light gray bars). Error bars represent SEM. aNon-obese diabetic mice demonstrated less mechanical strength than syngenic non-diabetic mice at 5 wk.
- Citation: Casazza K, Hanks LJ, Clines GA, Tse HM, Eberhardt AW. Diabetes-related impairment in bone strength is established early in the life course. World J Diabetes 2013; 4(4): 145-150
- URL: https://www.wjgnet.com/1948-9358/full/v4/i4/145.htm
- DOI: https://dx.doi.org/10.4239/wjd.v4.i4.145


