Copyright
©2012 Baishideng.
World J Diabetes. Sep 15, 2012; 3(9): 161-169
Published online Sep 15, 2012. doi: 10.4239/wjd.v3.i9.161
Published online Sep 15, 2012. doi: 10.4239/wjd.v3.i9.161
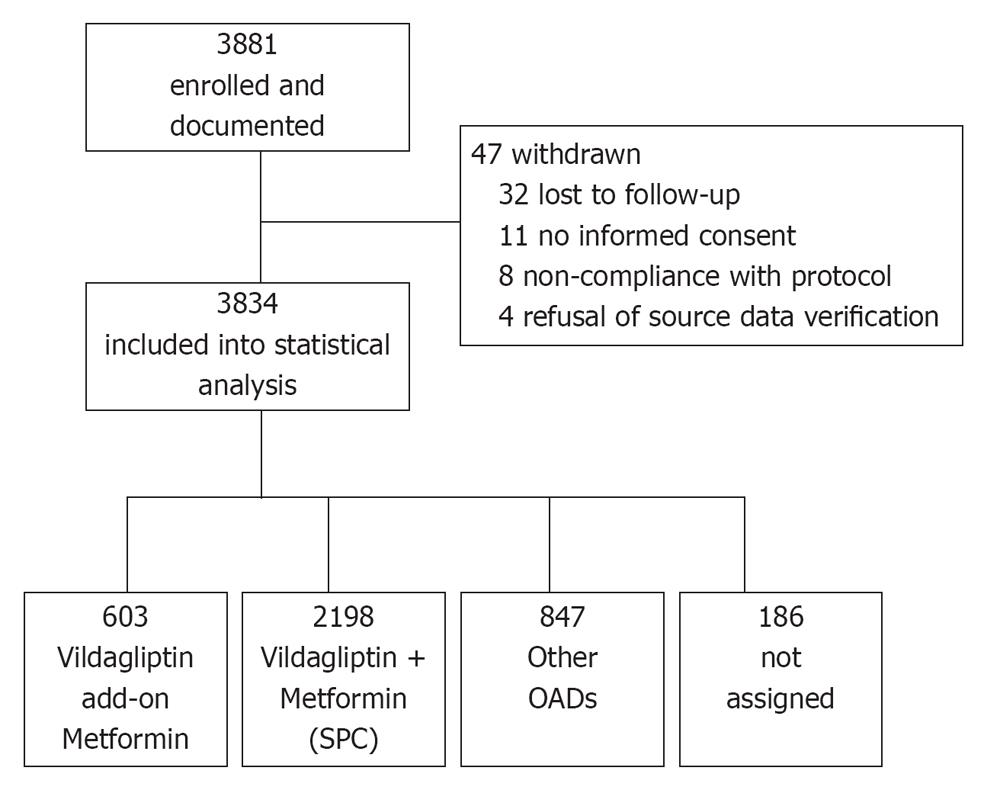
Figure 1 Study flow chart.
Patient flow throughout the study. In total 3881 patients fulfilled the in- and exclusion criteria and were enrolled into the study. 3834 patients completed the study and were included into the statistical analysis. OADs: Oral antidiabetic drugs; SPC: Single pill combination.
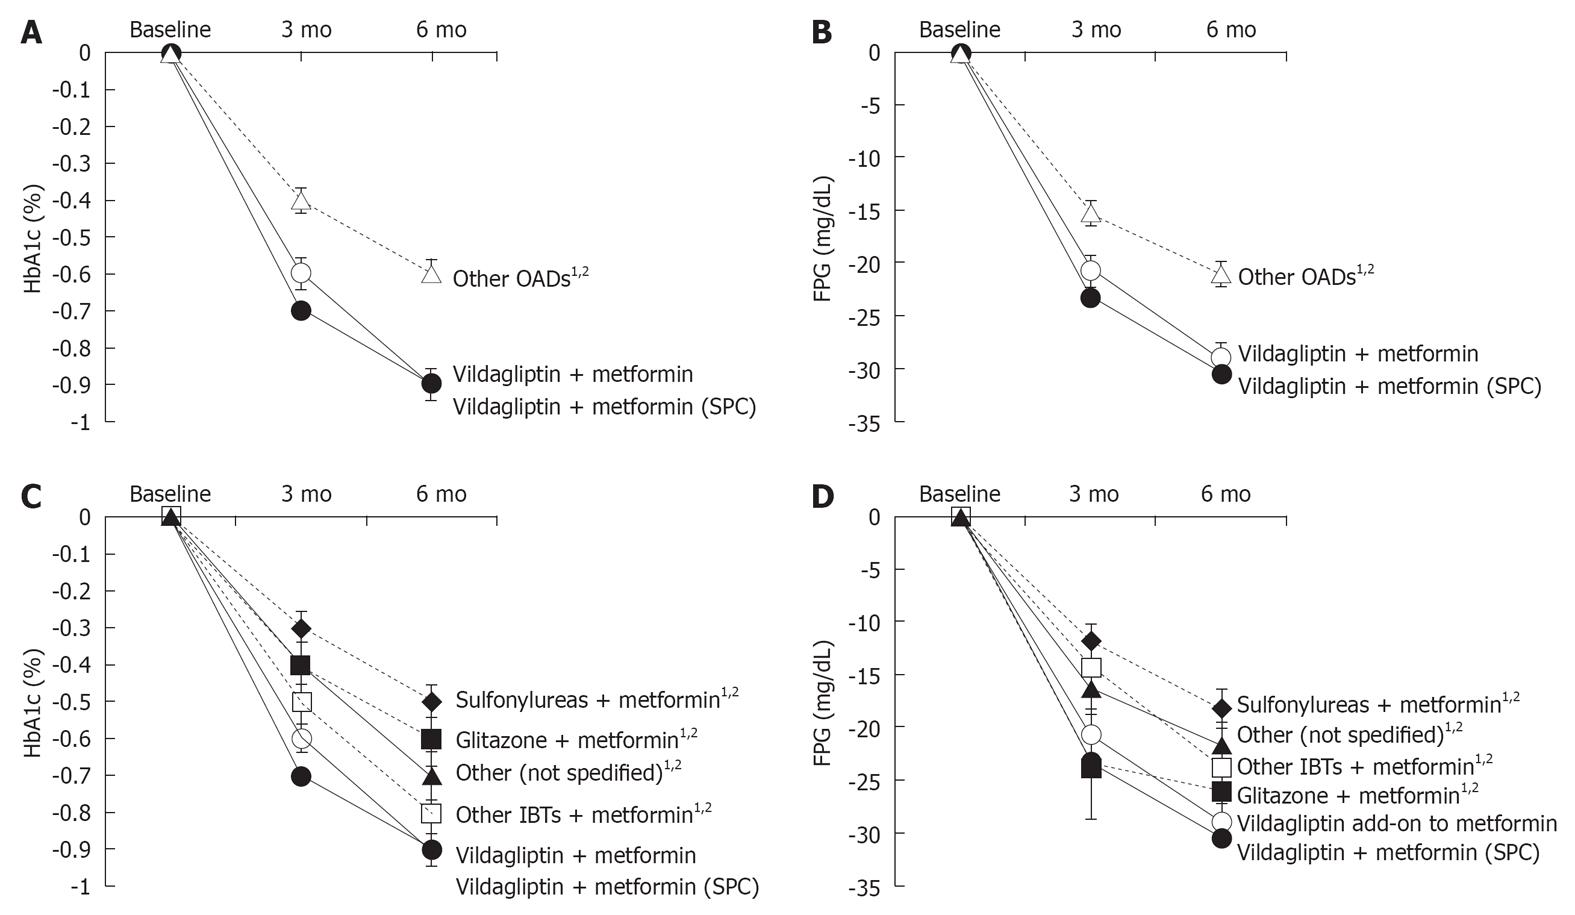
Figure 2 Difference in HbA1c and fasting plasma glucose after 3 and 6 mo of treatment.
A: Changes in HbA1c in the vildagliptin add-on to metformin groups and combined other oral antidiabetic drugs (OADs); B: Changes in fasting plasma glucose (FPG) in the vildagliptin add-on to metformin groups and other OADs; C: Difference in HbA1c during treatment-vildagliptin add-on to metformin, vildagliptin + metformin [single-pill combination (SPC)] and other antidiabetics (individual substance classes); D: Difference in FPG during treatment-vildagliptin add-on to metformin, vildagliptin + metformin (SPC) and other antidiabetics (individual substance classes). 1Statistically significant difference to vildagliptin add-on to metformin at 6 mo; 2Statistically significant difference to vildagliptin + metformin (SPC) at 6 mo. IBTs: Incretin-based therapies.
- Citation: Blüher M, Kurz I, Dannenmaier S, Dworak M. Efficacy and safety of vildagliptin in clinical practice-results of the PROVIL-study. World J Diabetes 2012; 3(9): 161-169
- URL: https://www.wjgnet.com/1948-9358/full/v3/i9/161.htm
- DOI: https://dx.doi.org/10.4239/wjd.v3.i9.161


