Copyright
©2012 Baishideng.
World J Diabetes. Aug 15, 2012; 3(8): 142-148
Published online Aug 15, 2012. doi: 10.4239/wjd.v3.i8.142
Published online Aug 15, 2012. doi: 10.4239/wjd.v3.i8.142
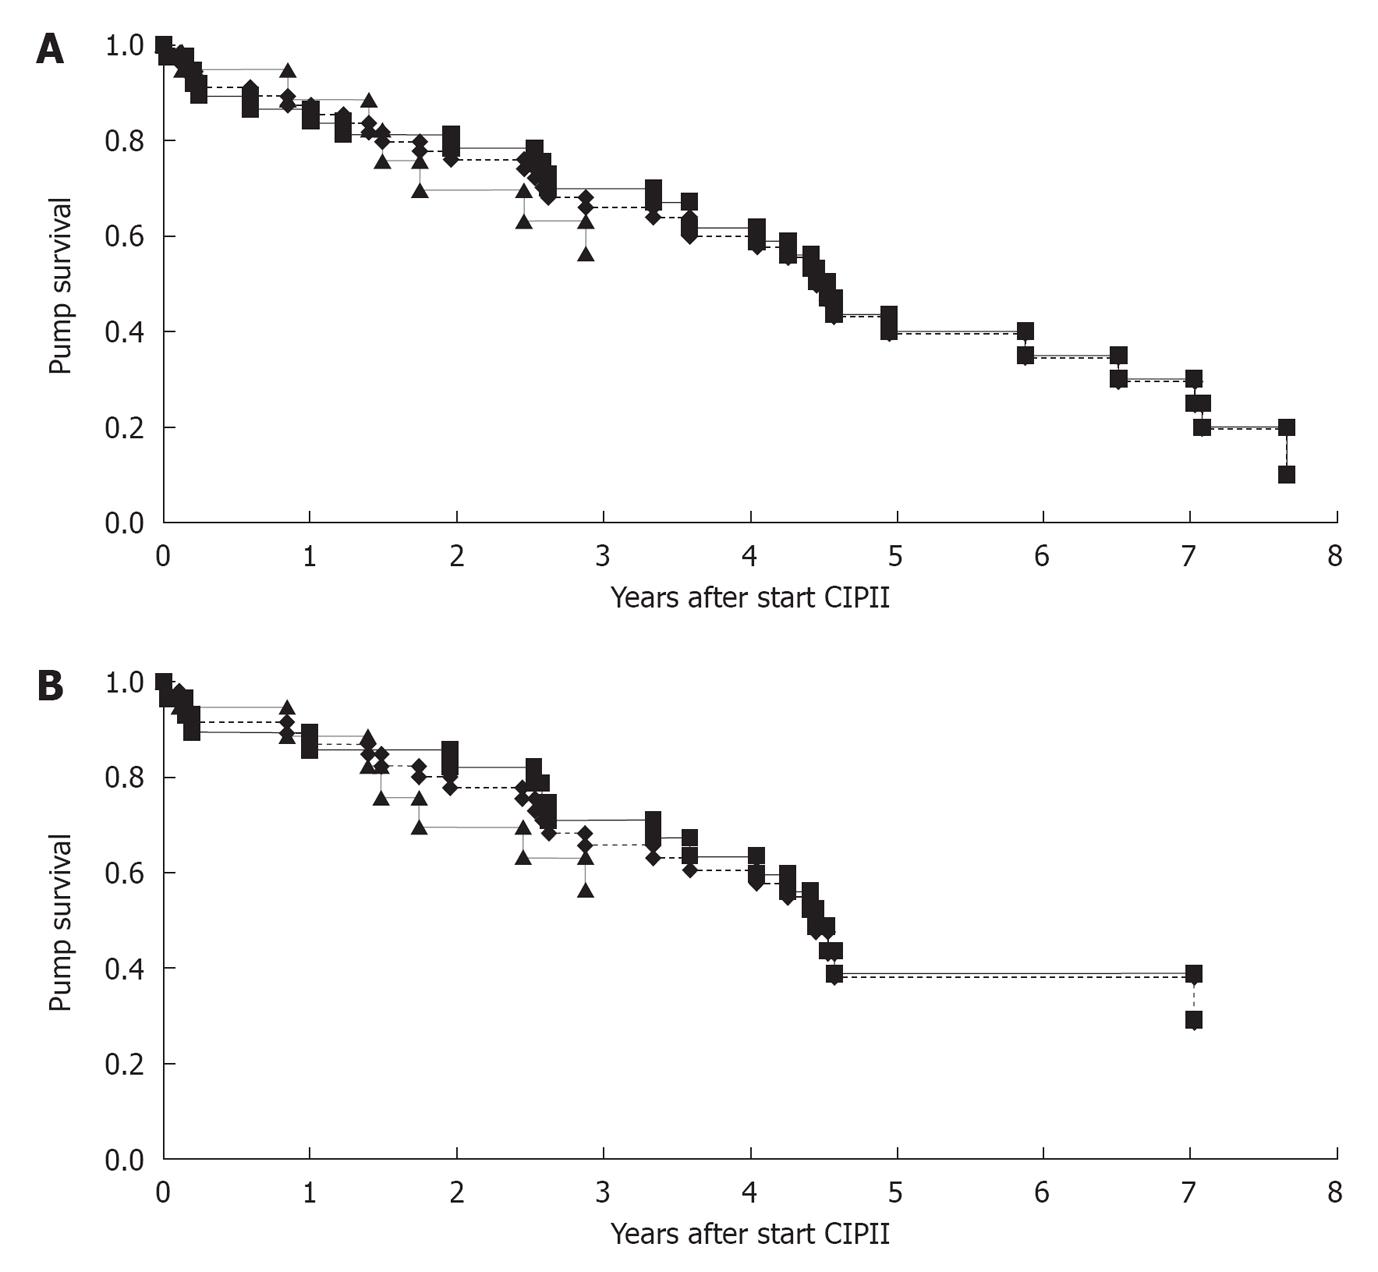
Figure 1 Time between initial implantation and first re-operation, for all reasons (n = 56) (A) and only for complications (n = 47) (B).
The dotted line represents all patients. The balck line and grey line represent patients groups who started continuous intraperitoneal insulin infusion (CIPII) between 2000 and 2007 or between 2007 and 2011, respectively (log rank test for differences, A: P = 0.8; B: P = 0.72).
- Citation: Dijk PRV, Logtenberg SJ, Groenier KH, Haveman JW, Kleefstra N, Bilo HJ. Complications of continuous intraperitoneal insulin infusion with an implantable pump. World J Diabetes 2012; 3(8): 142-148
- URL: https://www.wjgnet.com/1948-9358/full/v3/i8/142.htm
- DOI: https://dx.doi.org/10.4239/wjd.v3.i8.142


