Copyright
©2012 Baishideng Publishing Group Co.
World J Diabetes. Jul 15, 2012; 3(7): 135-141
Published online Jul 15, 2012. doi: 10.4239/wjd.v3.i7.135
Published online Jul 15, 2012. doi: 10.4239/wjd.v3.i7.135
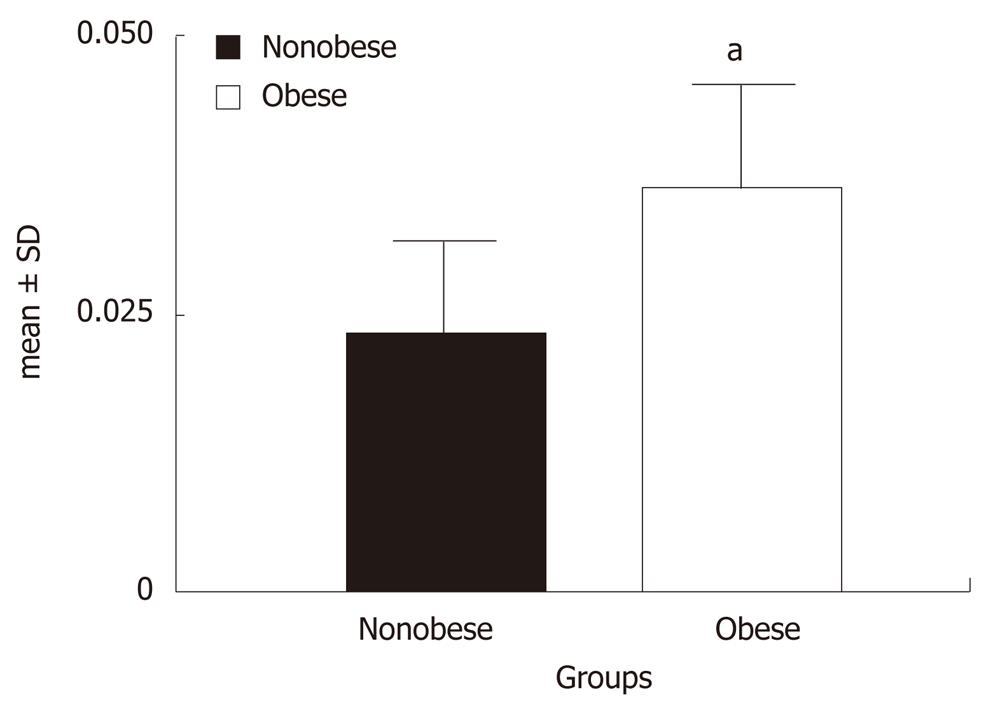
Figure 1 Relative subcutaneous adipose tissue resistin mRNA expressions of two groups.
aP < 0.001 vs non obese (by Student’s t test).
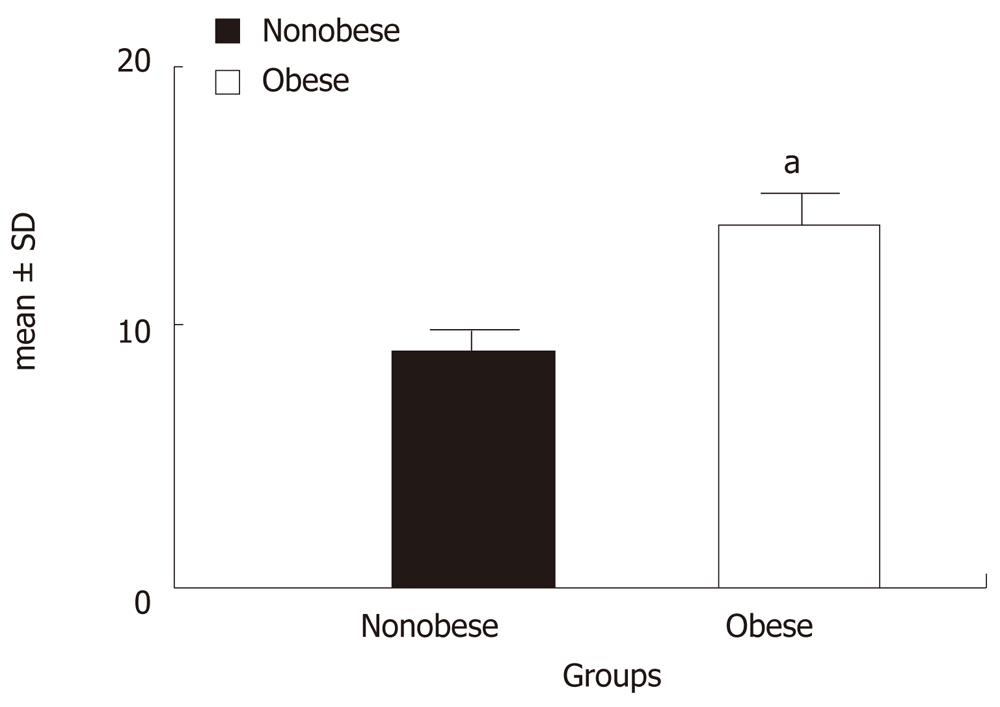
Figure 2 Mean serum resistin levels (ng/mL) of two groups.
aP < 0.001 vs non obese (by Student’s t test).
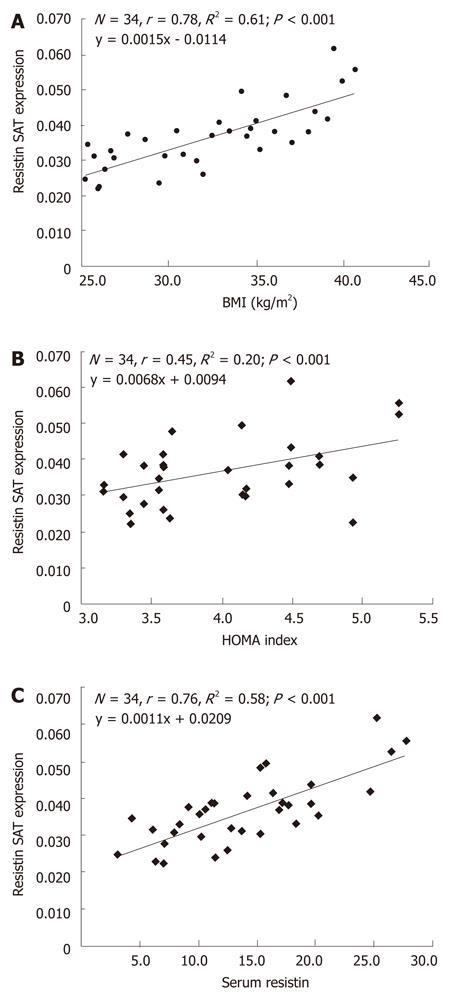
Figure 3 Correlation and simple linear regression of subcutaneous adipose tissue resistin mRNA expression with body mass index (A), homeostasis model assessment index (B) and serum resistin levels (C) in postmenopausal obese women.
HOMA: Homeostasis model assessment; BMI: Body mass index.
- Citation: Sadashiv, Tiwari S, Paul BN, Kumar S, Chandra A, Dhananjai S, Negi MP. Over expression of resistin in adipose tissue of the obese induces insulin resistance. World J Diabetes 2012; 3(7): 135-141
- URL: https://www.wjgnet.com/1948-9358/full/v3/i7/135.htm
- DOI: https://dx.doi.org/10.4239/wjd.v3.i7.135


