Copyright
©The Author(s) 2025.
World J Diabetes. Jul 15, 2025; 16(7): 107335
Published online Jul 15, 2025. doi: 10.4239/wjd.v16.i7.107335
Published online Jul 15, 2025. doi: 10.4239/wjd.v16.i7.107335
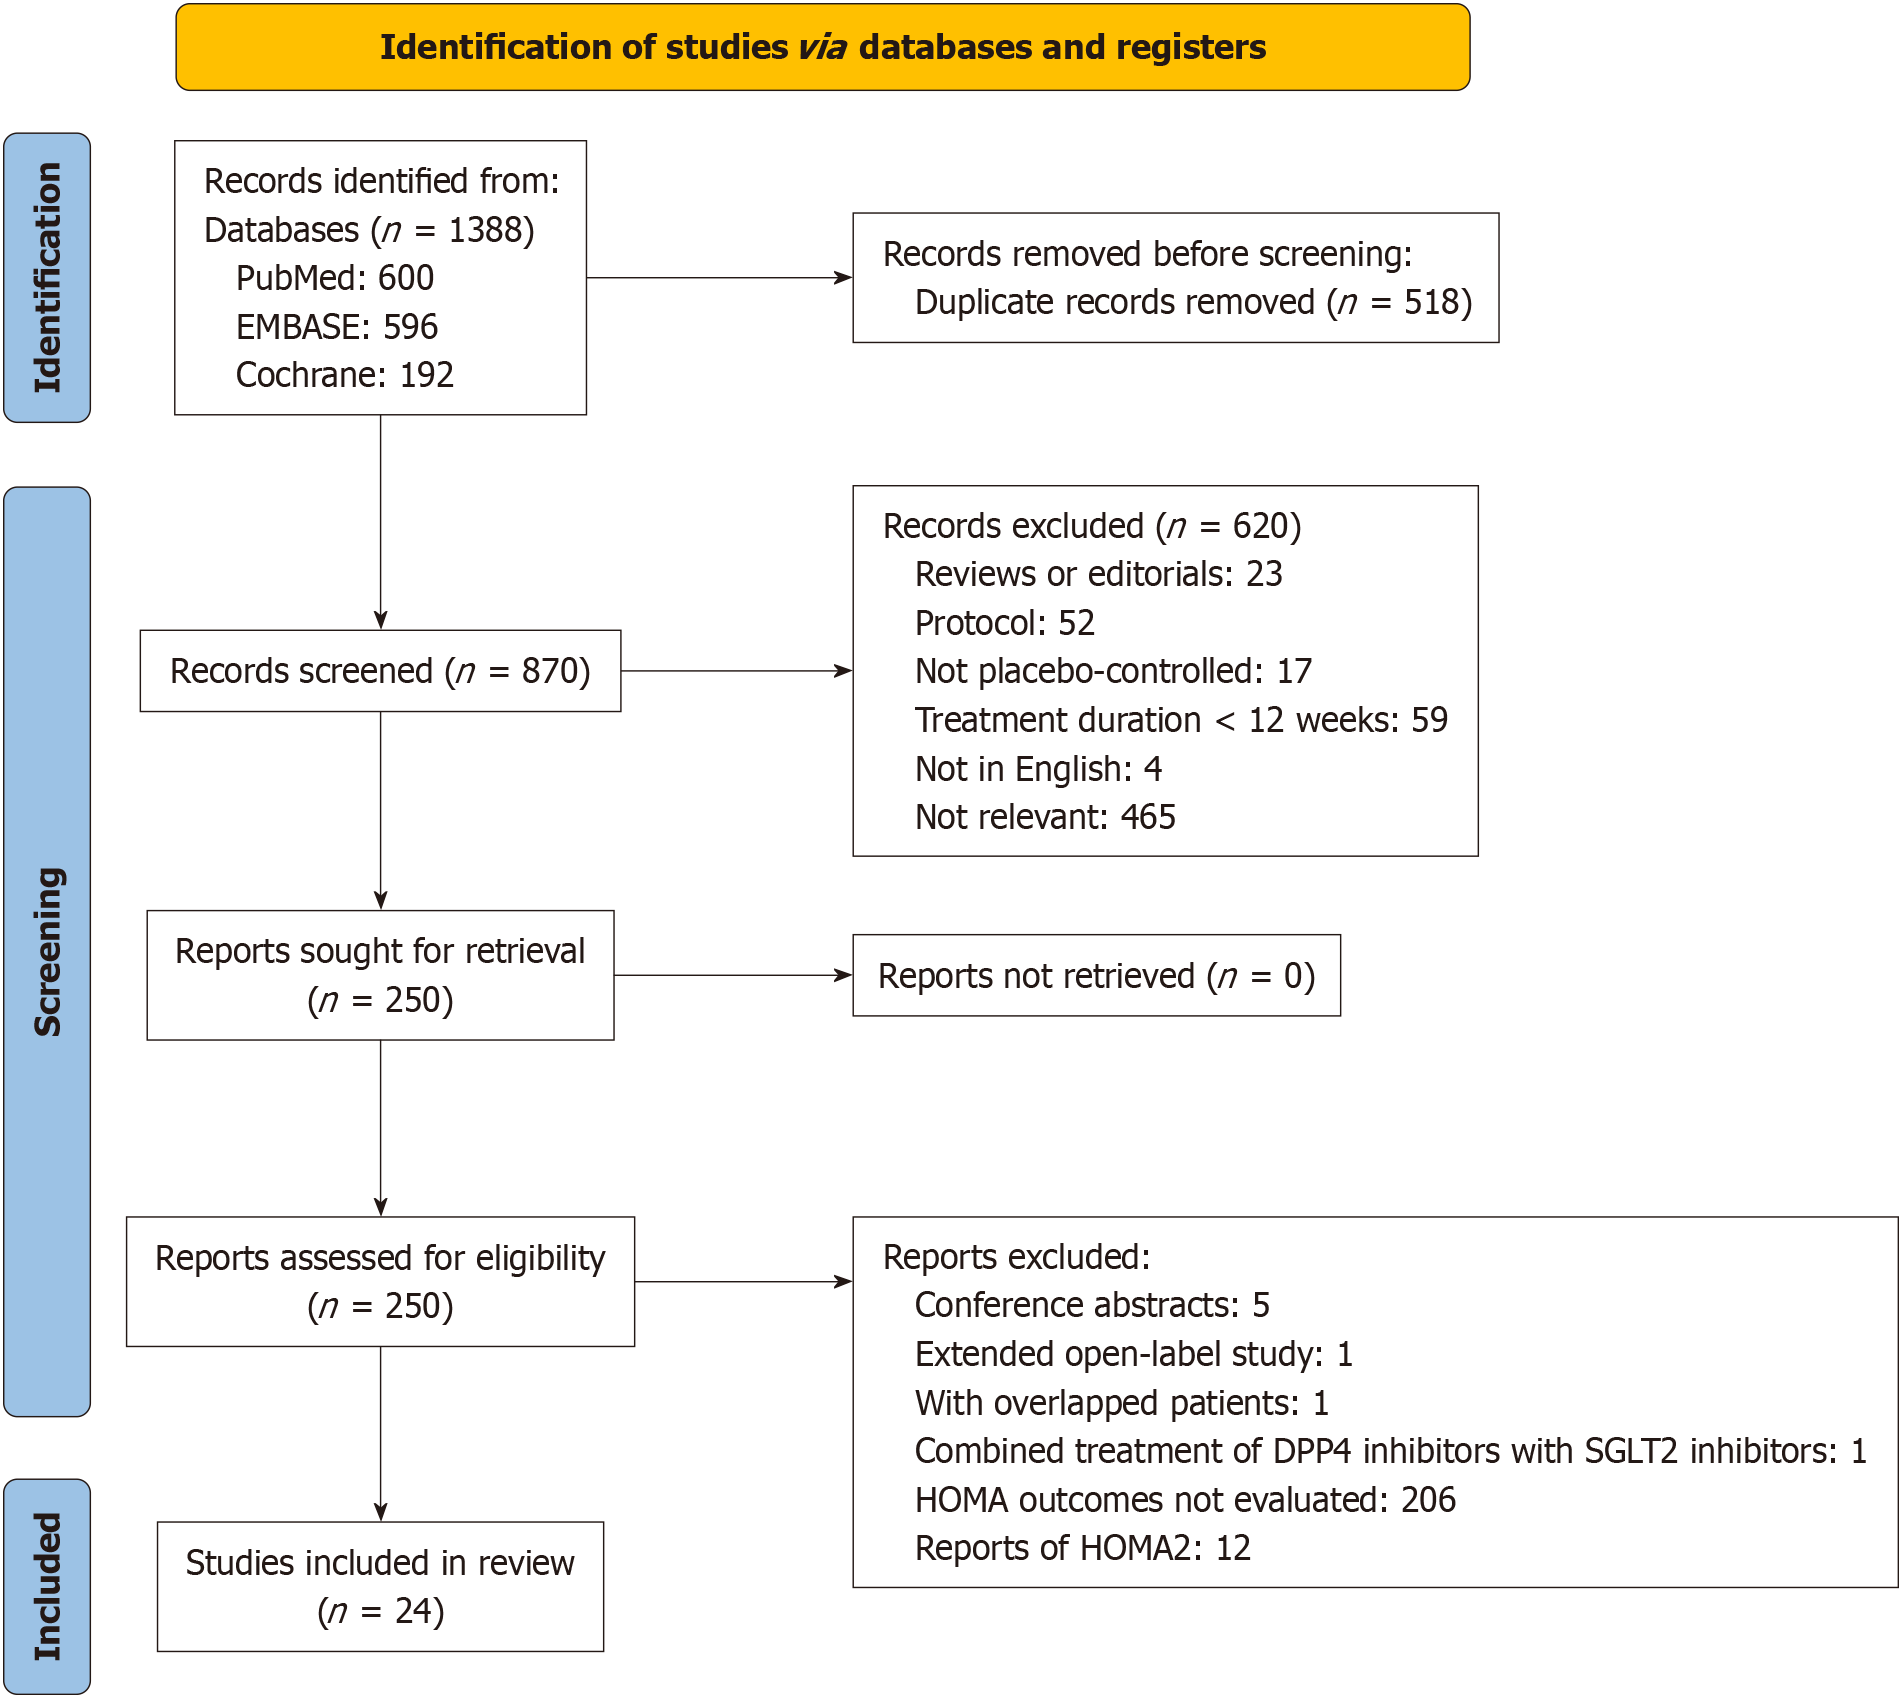
Figure 1 Flowchart for the literature search and study inclusion.
DPP4: Dipeptidyl peptidase 4; SGLT2: Sodium-glucose cotransporter 2; HOMA: Homeostasis model assessment.
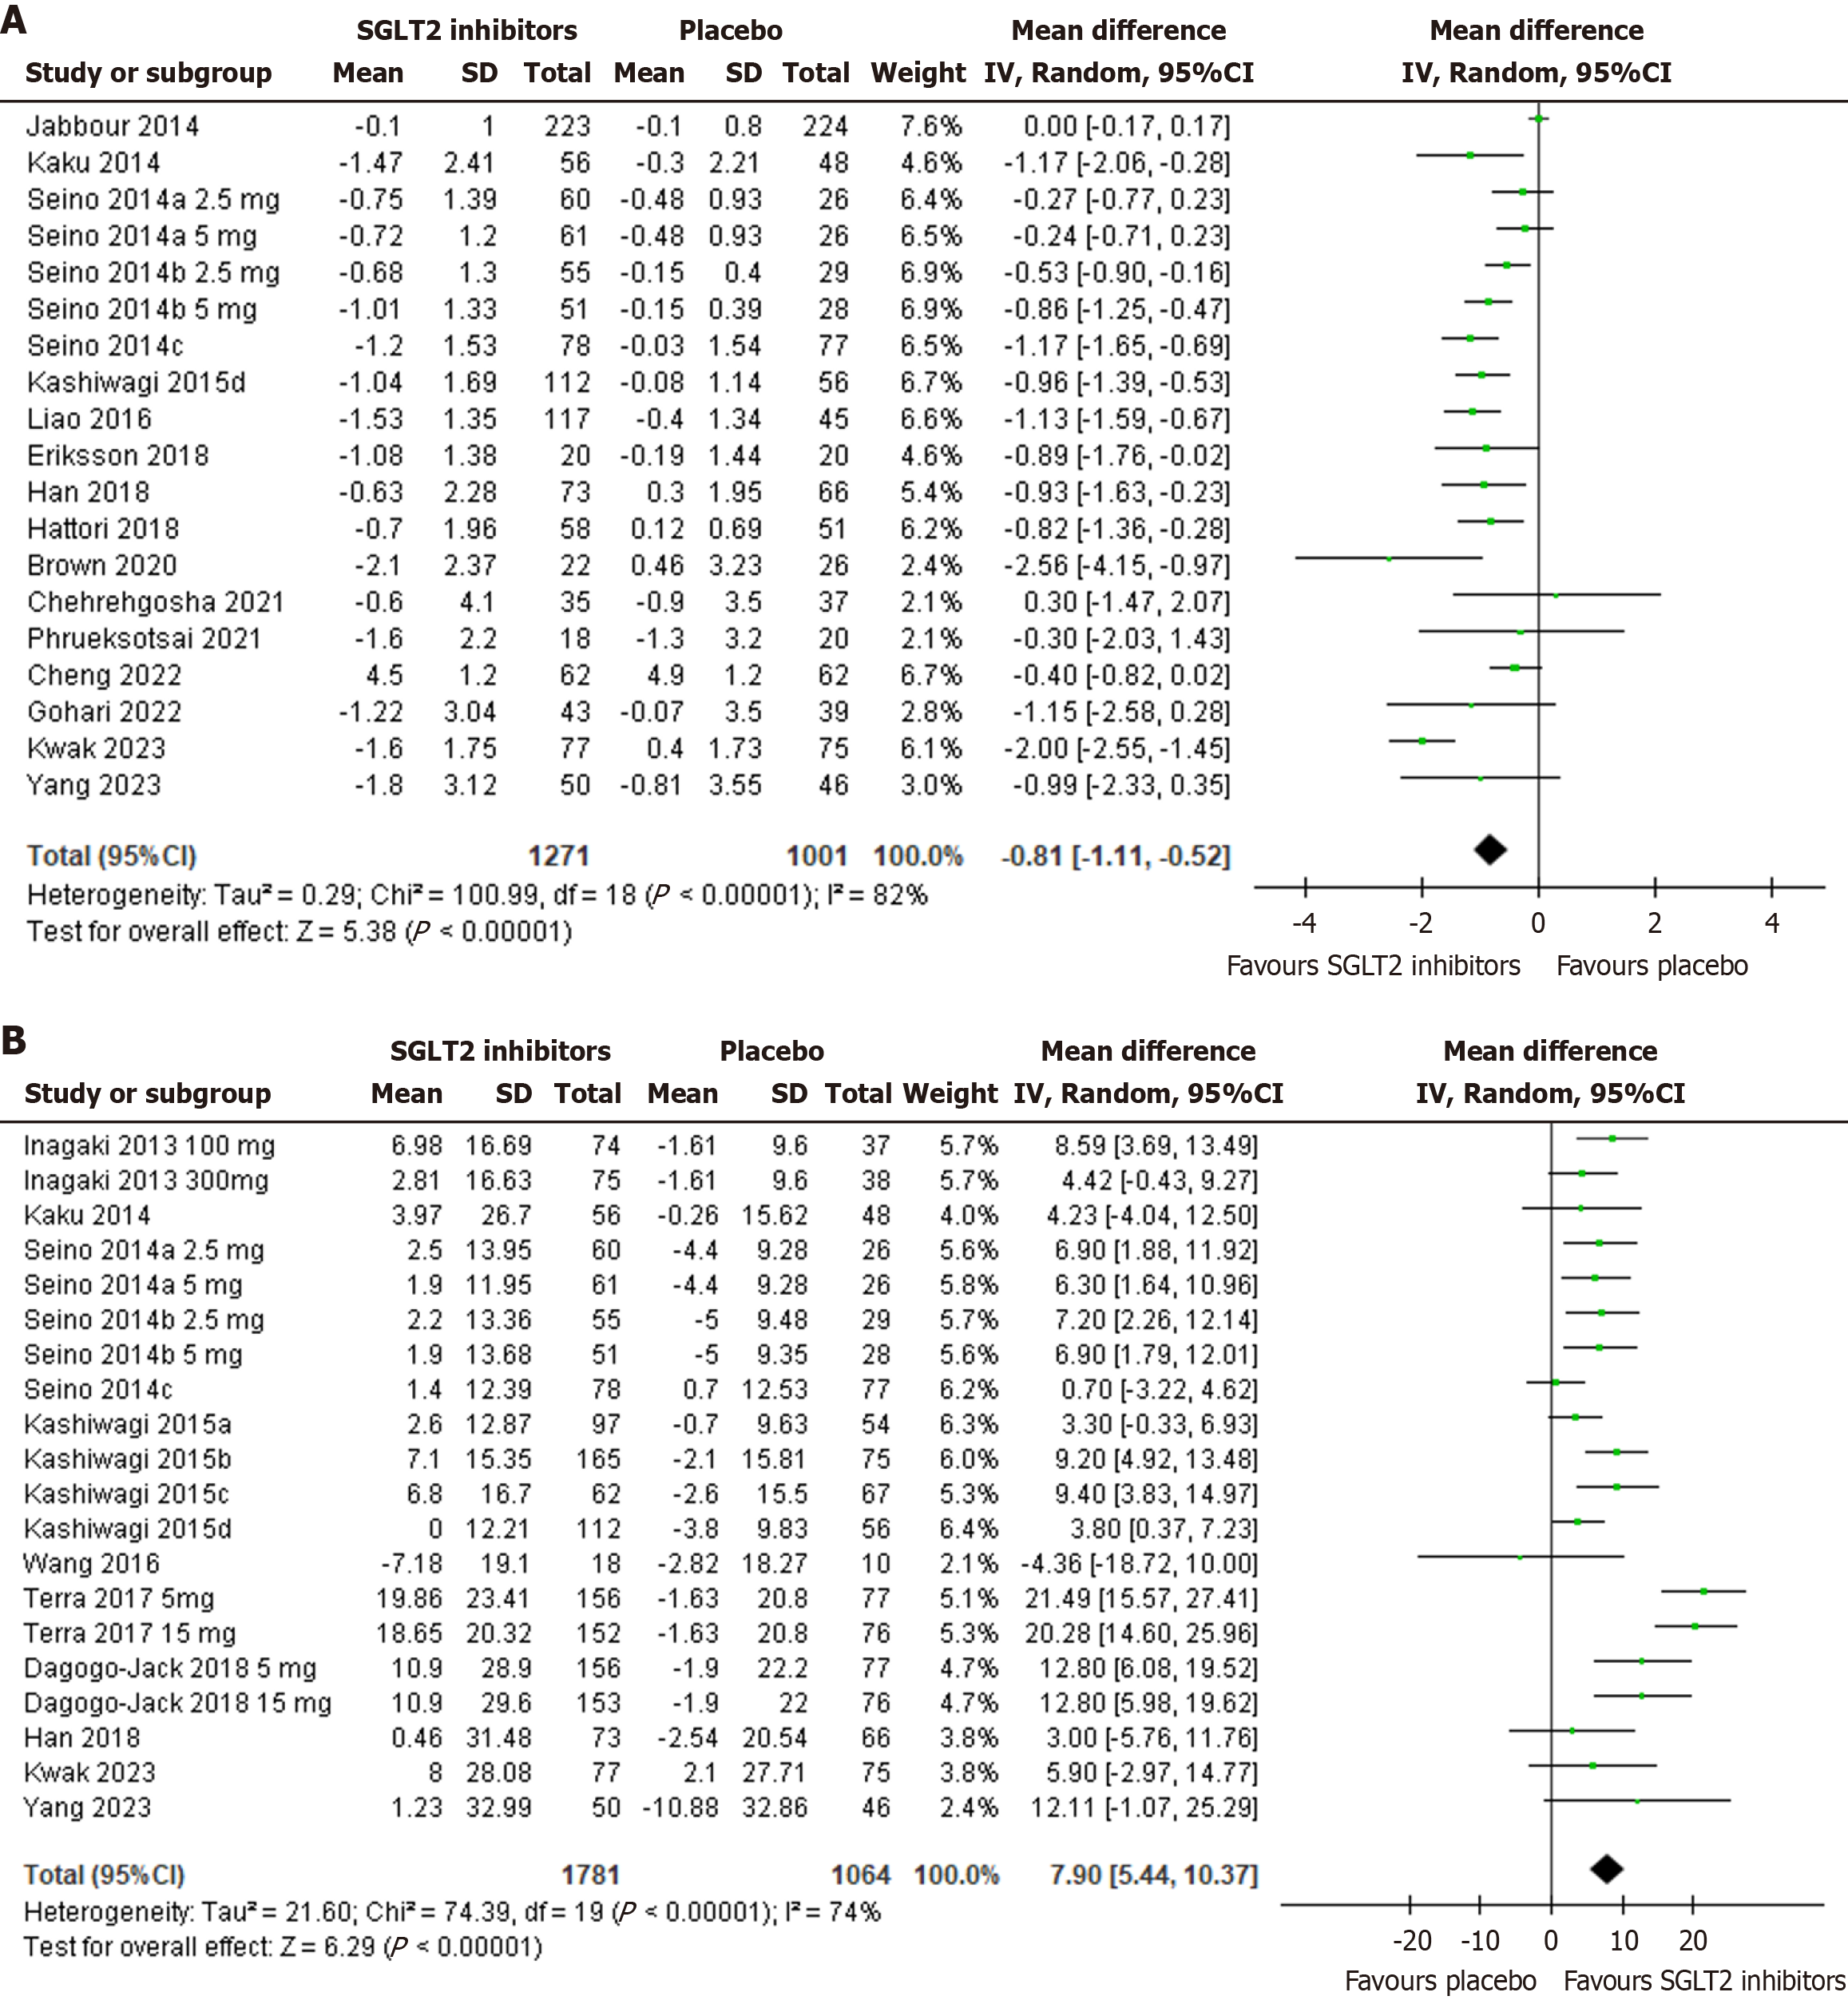
Figure 2 Forest plots for the meta-analyses comparing the influence of sodium-glucose cotransporter 2 inhibitors vs placebo on homeo
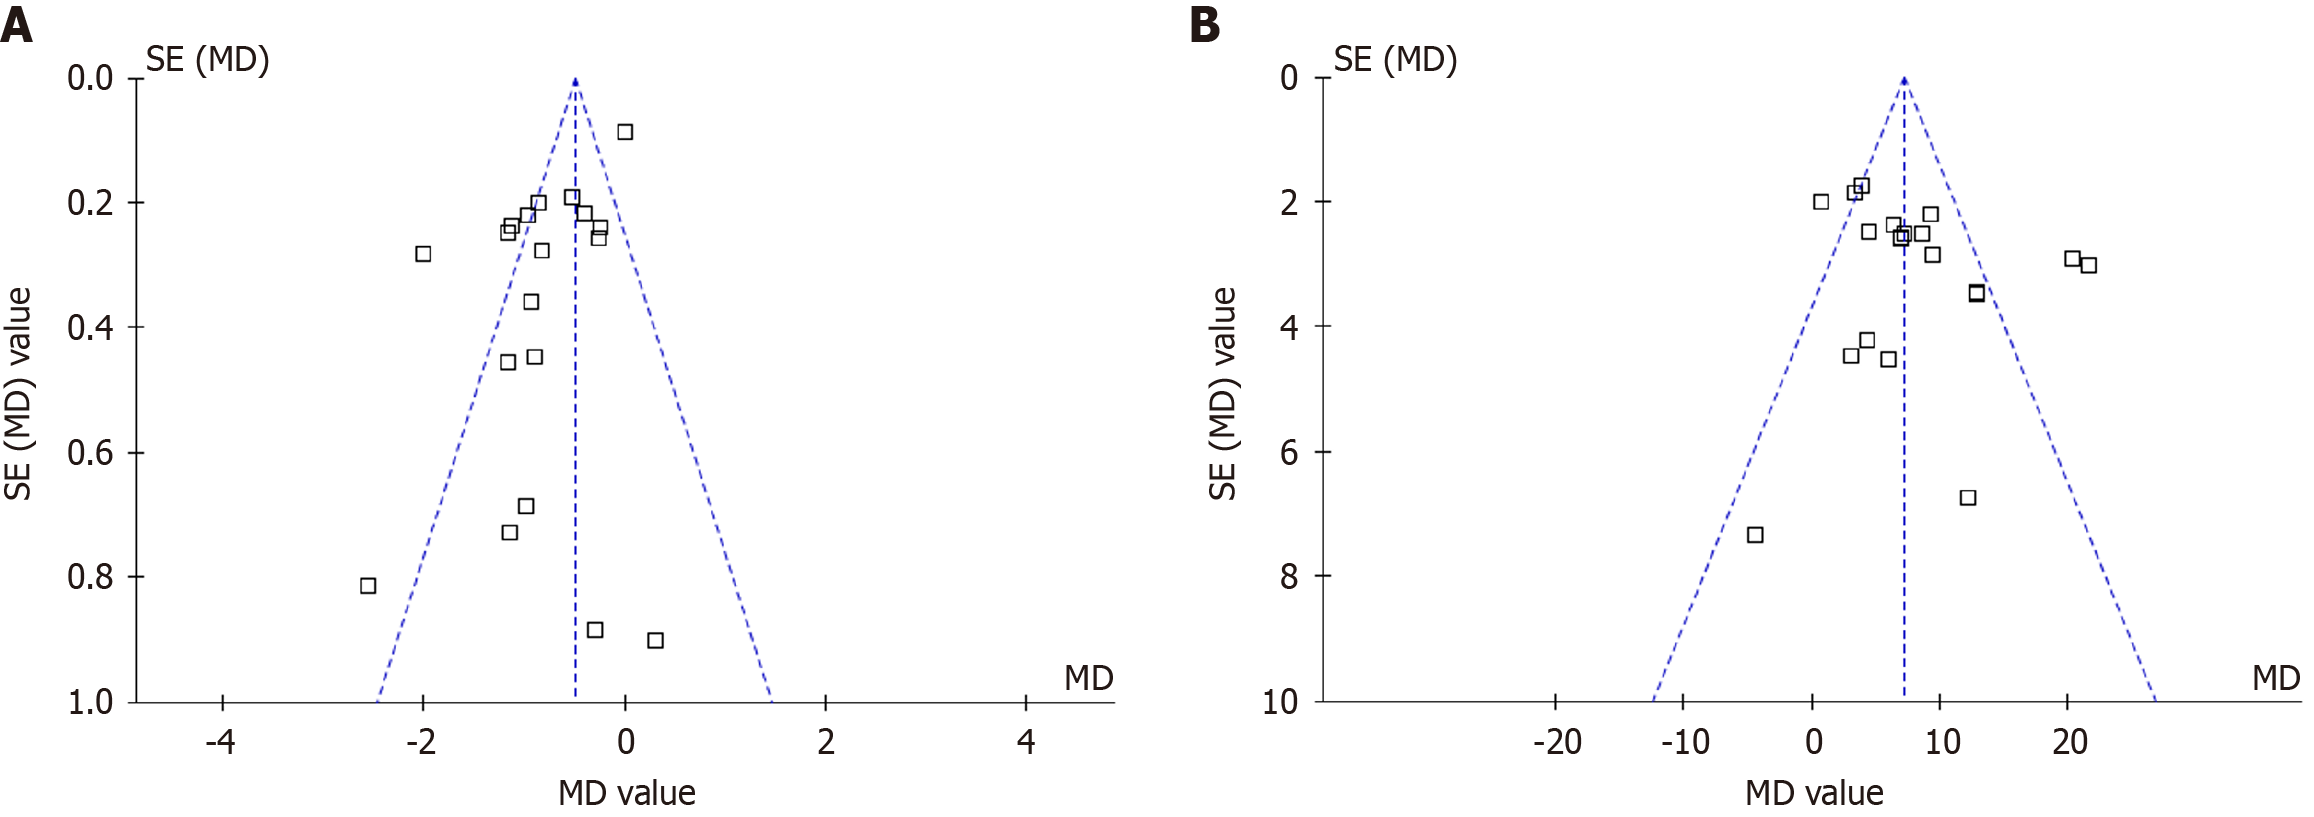
Figure 3 Funnel plots evaluating the publication bias underlying the meta-analyses comparing the influence of sodium-glucose cotransporter 2 inhibitors vs placebo on homeostasis model assessment of insulin resistance and β-cell function in patients with type 2 diabetes.
A: Funnel plot for the outcome of homeostasis model assessment of insulin resistance; B: Funnel plot for the outcome of homeostasis model assessment of β-cell function. MD: Mean difference.
- Citation: Chai SY, Zhang RY, Ning ZY, Zheng YM, Swapnil R, Ji LN. Sodium-glucose co-transporter 2 inhibitors improve insulin resistance and β-cell function in type 2 diabetes: A meta-analysis. World J Diabetes 2025; 16(7): 107335
- URL: https://www.wjgnet.com/1948-9358/full/v16/i7/107335.htm
- DOI: https://dx.doi.org/10.4239/wjd.v16.i7.107335


