Copyright
©The Author(s) 2025.
World J Diabetes. Jun 15, 2025; 16(6): 105447
Published online Jun 15, 2025. doi: 10.4239/wjd.v16.i6.105447
Published online Jun 15, 2025. doi: 10.4239/wjd.v16.i6.105447
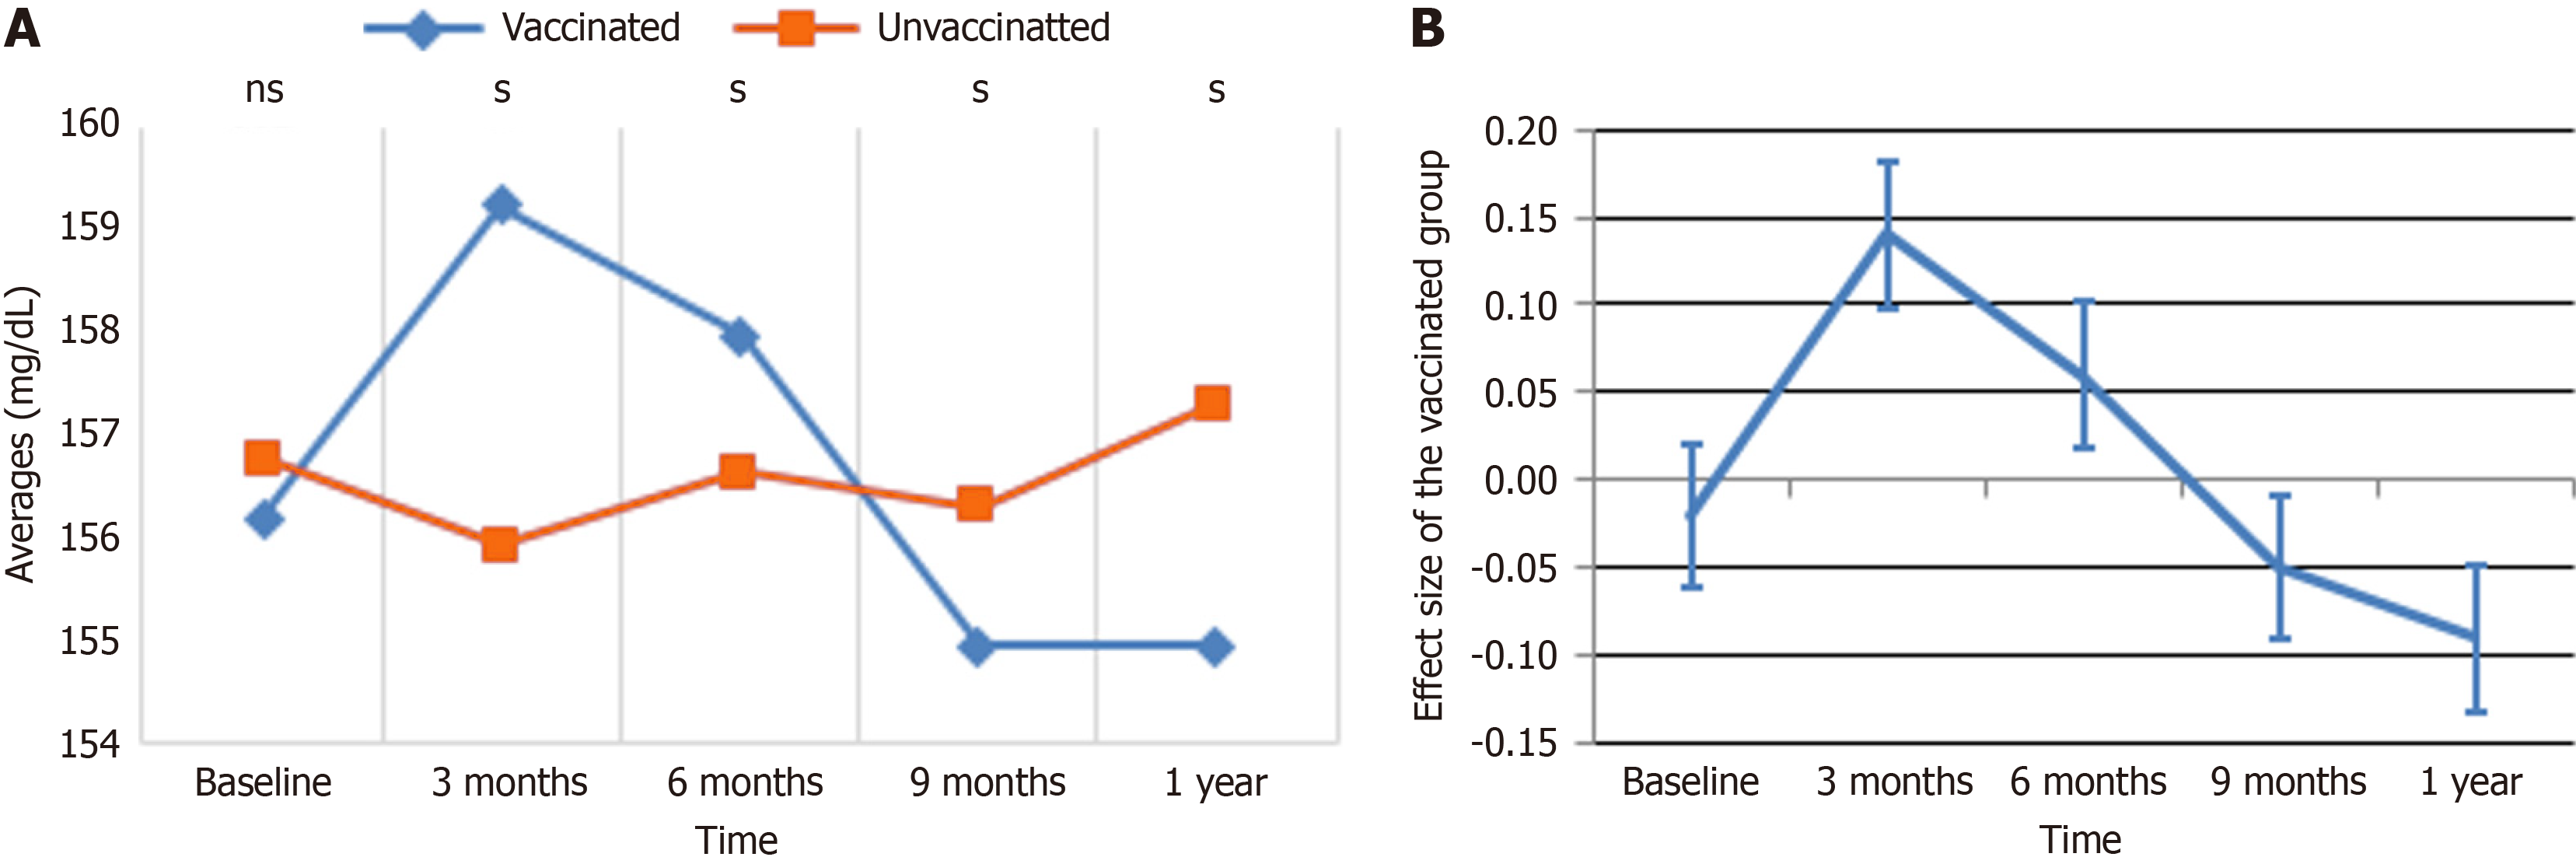
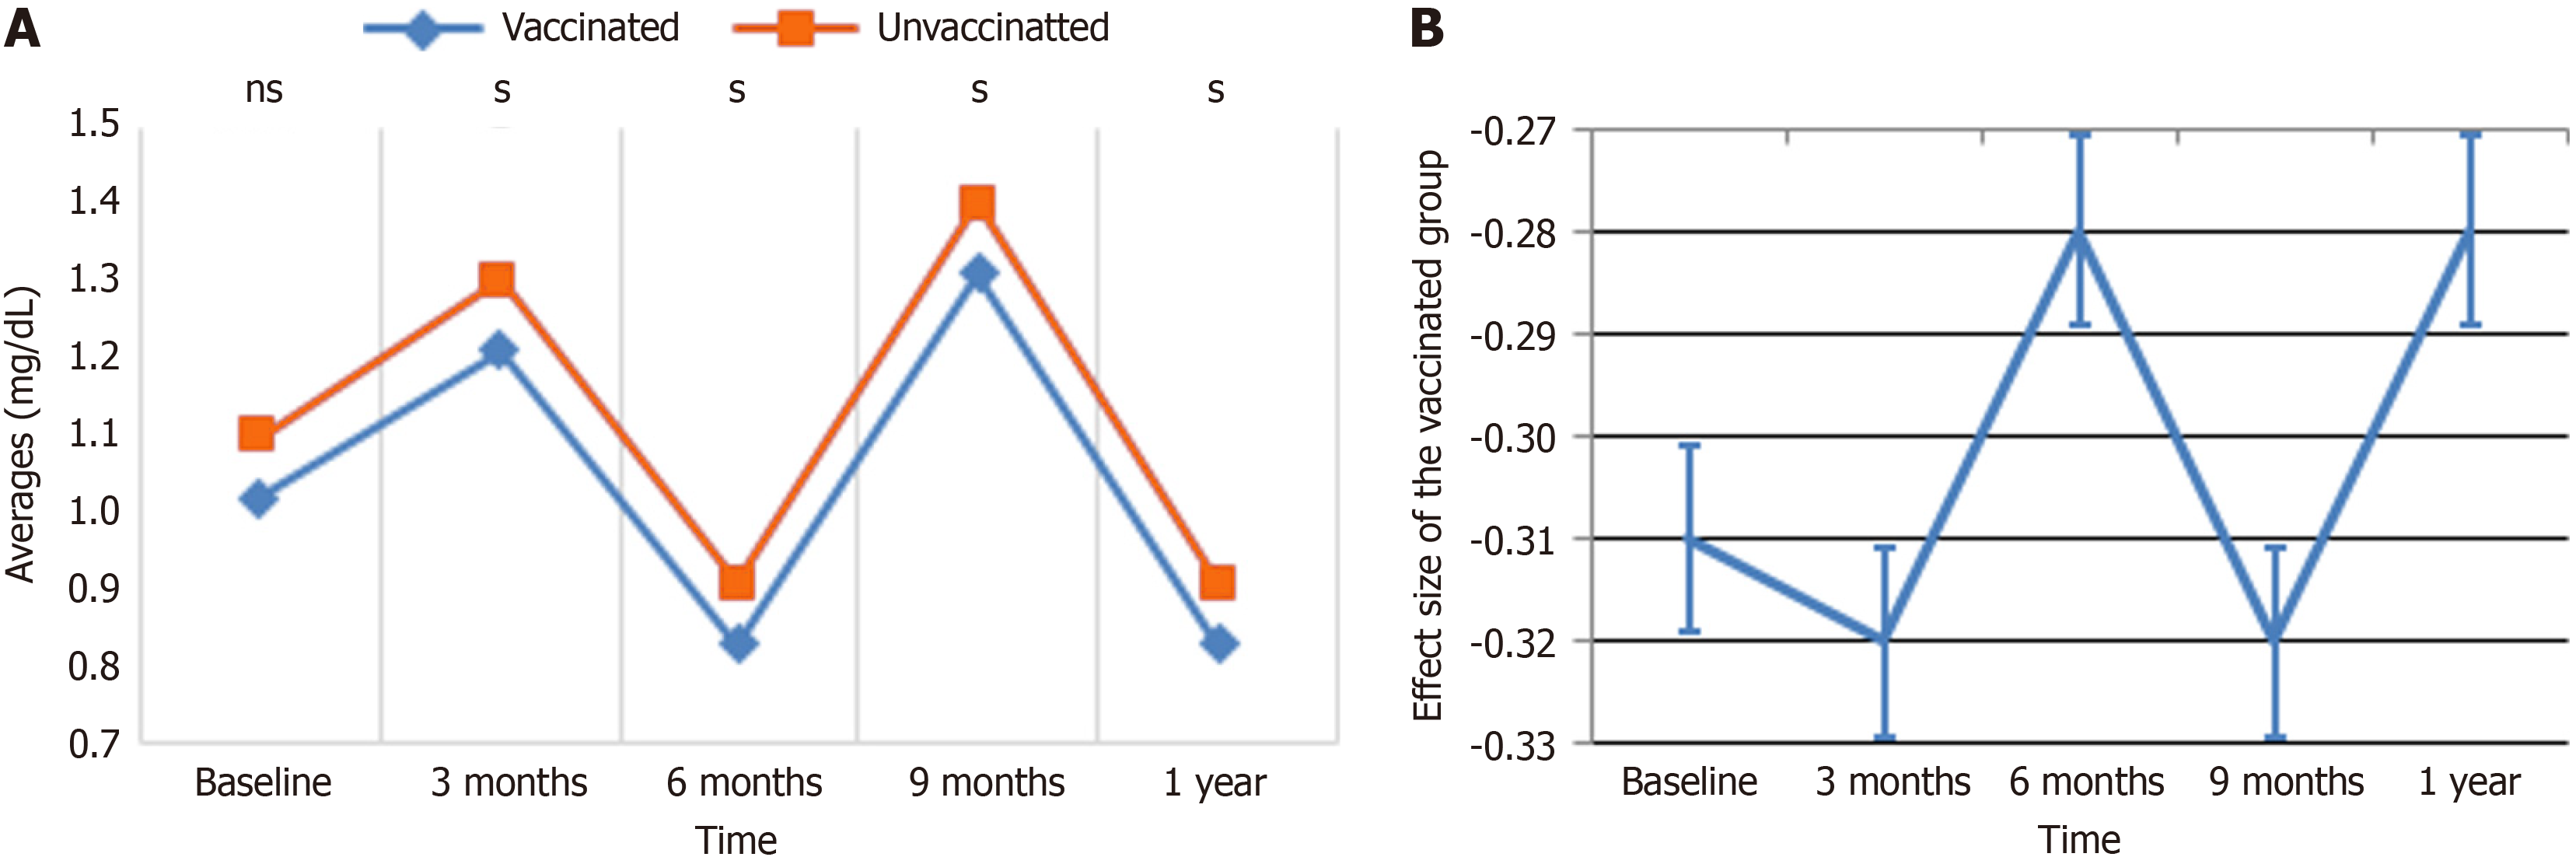
Figure 1 Triglyceride level over time.
A: Average trend of triglyceride (TG) for unvaccinated and vaccinated groups over time. The letter "s" indicates statistically significant differences (P < 0.05) between the groups at each time point, while "ns" denotes no significant difference; B: Effect size of TG for vaccinated groups over time.
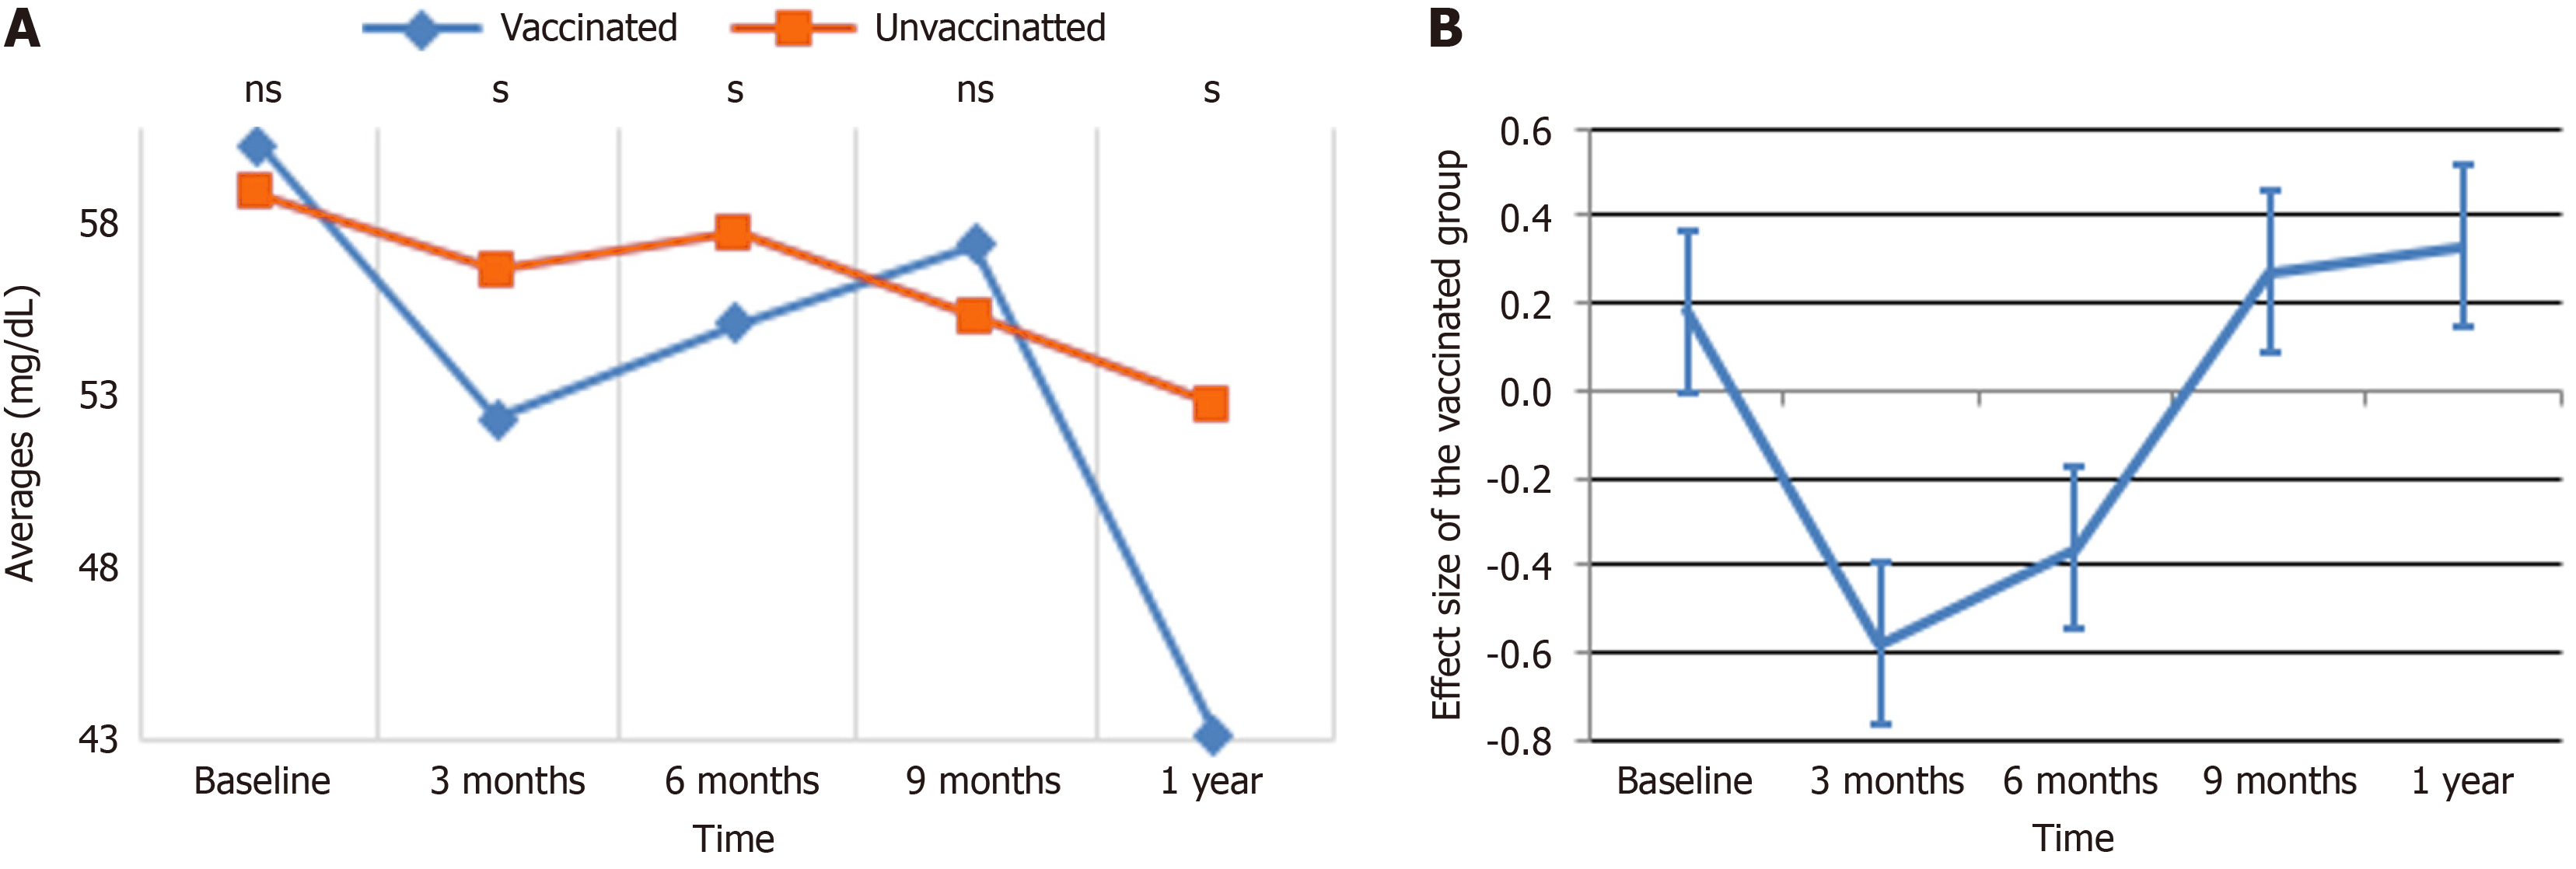
Figure 2 High-density lipoprotein level over time.
A: Average trend of high-density lipoprotein (HDL) for unvaccinated and vaccinated groups over time. The letter "s" indicates statistically significant differences (P < 0.05) between the groups at each time point, while "ns" denotes no significant difference; B: Effect size of HDL for vaccinated groups over time.
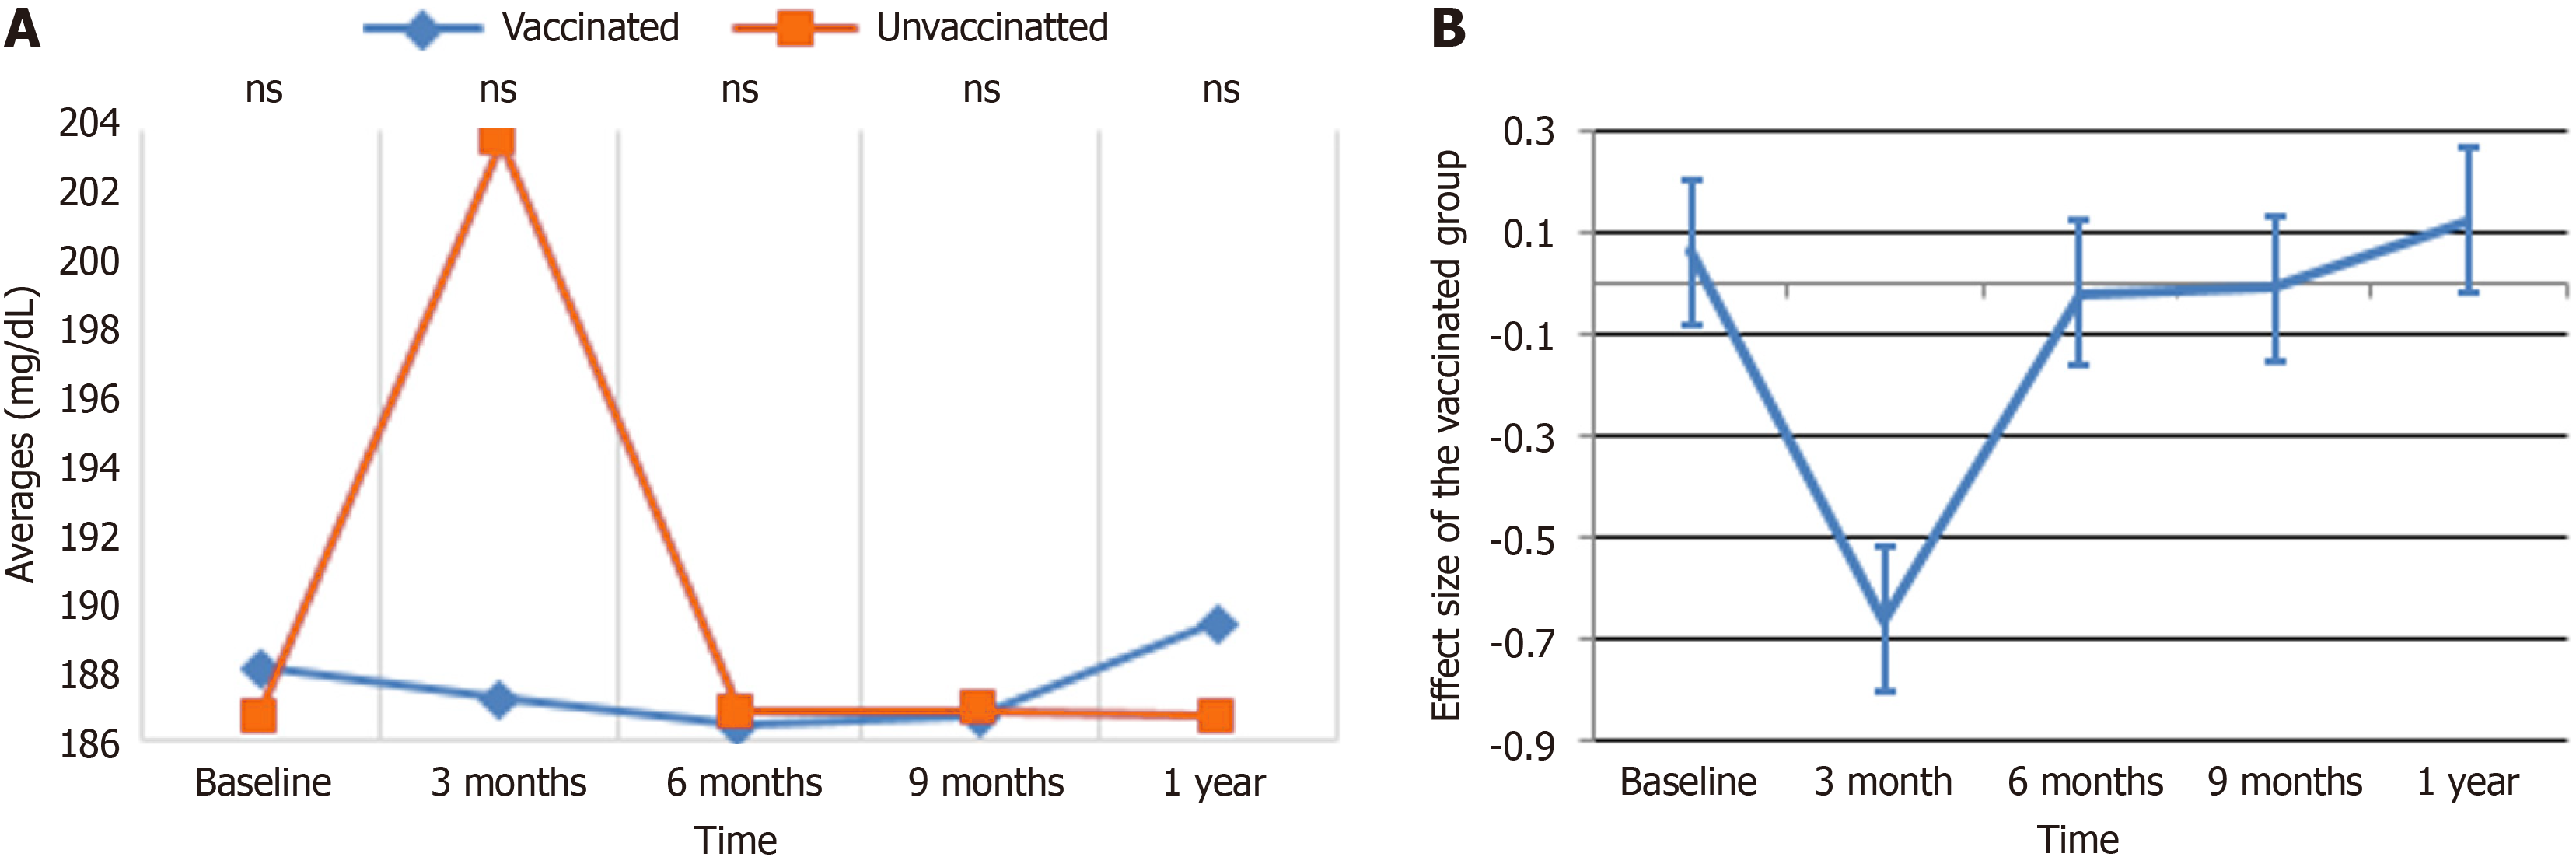
Figure 3 Total cholesterol level over time.
A: Average trend of total cholesterol (TC) for unvaccinated and vaccinated groups over time. The letter "s" indicates statistically significant differences (P < 0.05) between the groups at each time point, while "ns" denotes no significant difference; B: Effect size of TC for vaccinated groups over time.
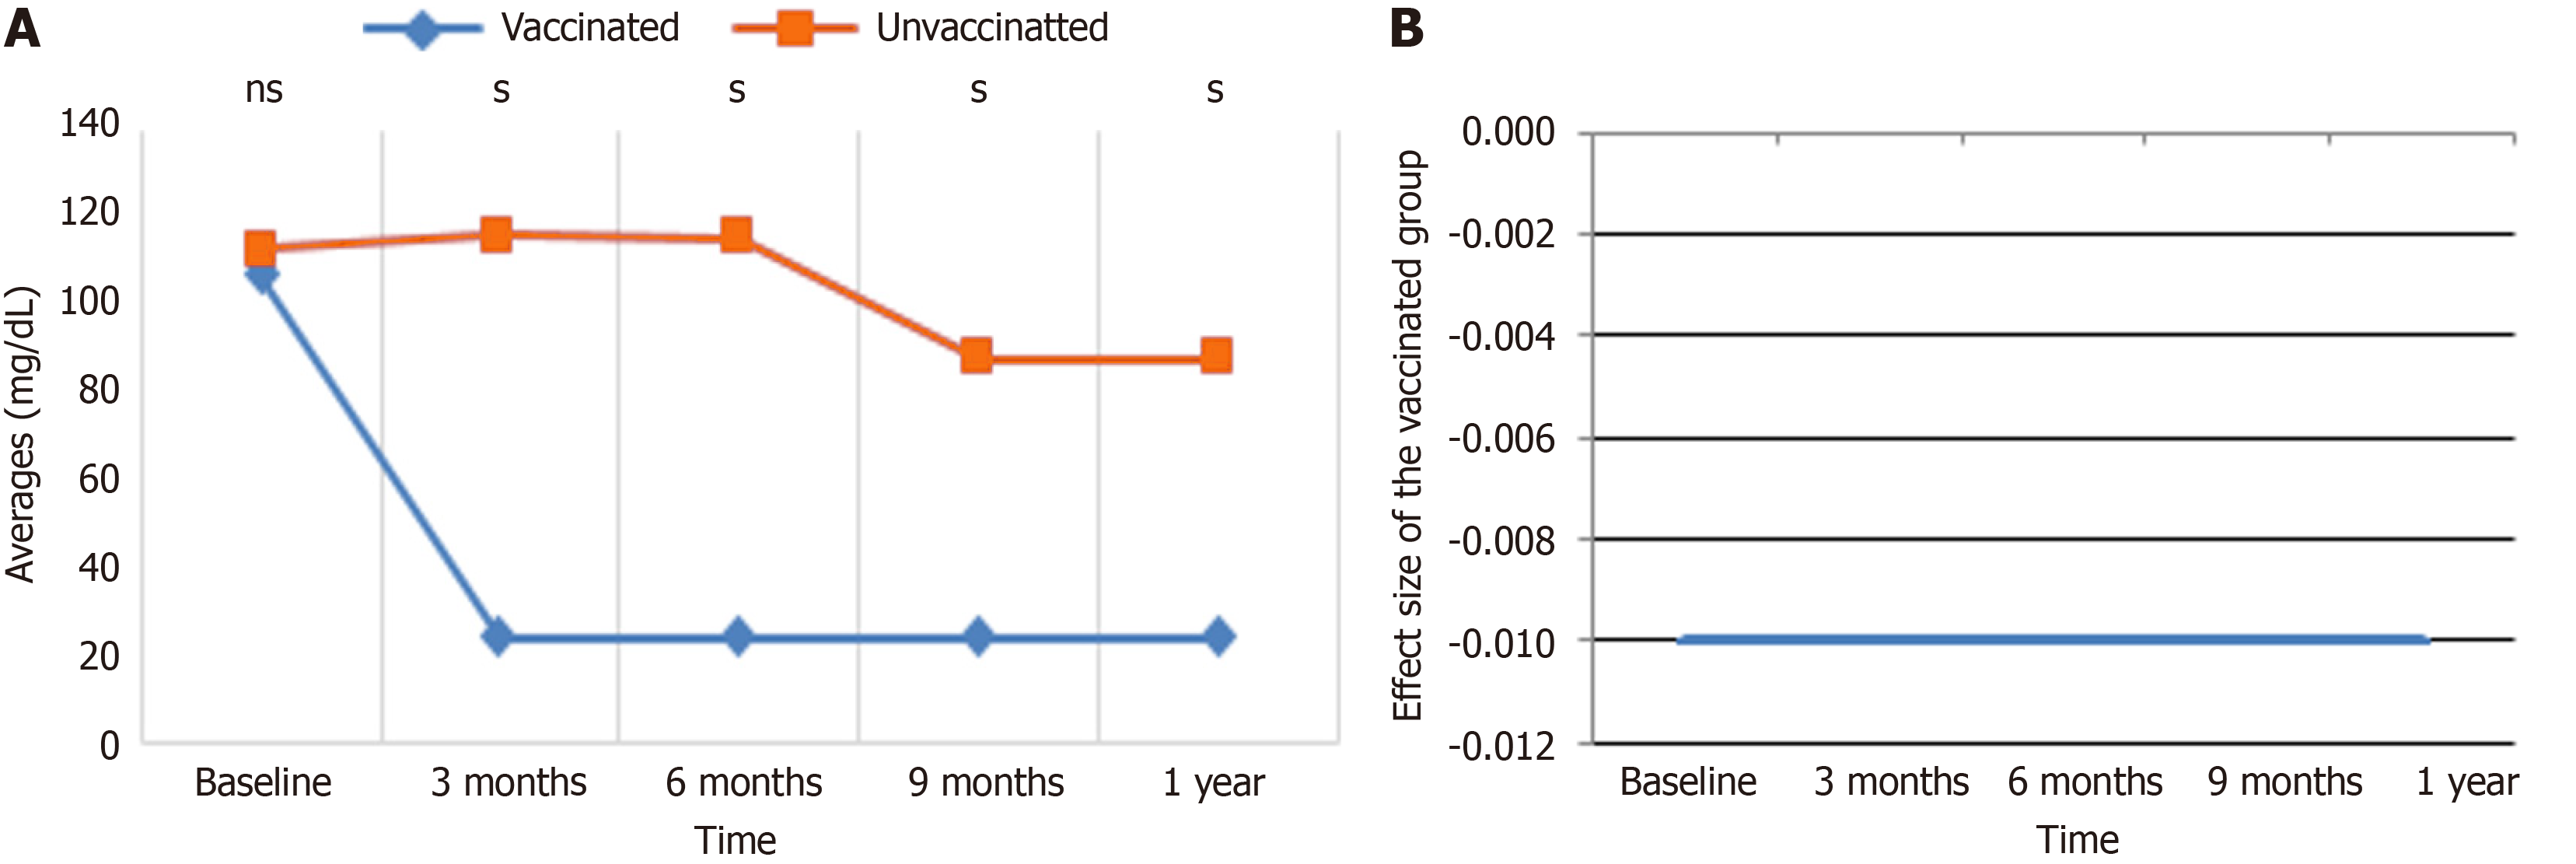
Figure 4 Prostaglandin levels over time.
A: Average trend of prostaglandin (PG) for unvaccinated and vaccinated groups. The letter "s" indicates statistically significant differences (P < 0.05) between the groups at each time point, while "ns" denotes no significant difference; B: Effect size of PG for vaccinated groups.
Figure 5 Thromboxane level over time.
A: Average trend of thromboxane (TX) for unvaccinated and vaccinated groups over time. The letter "s" indicates statistically significant differences (P < 0.05) between the groups at each time point, while "ns" denotes no significant difference; B: TX for vaccinated groups over time.
- Citation: Edae CK, Bedada AT, Teklemariam MD, Girma T, Gebre SG. Longitudinal effects of Johnson & Johnson COVID-19 vaccination on metabolic biomarkers in type 2 diabetes mellitus in Ethiopia. World J Diabetes 2025; 16(6): 105447
- URL: https://www.wjgnet.com/1948-9358/full/v16/i6/105447.htm
- DOI: https://dx.doi.org/10.4239/wjd.v16.i6.105447


