Copyright
©The Author(s) 2021.
World J Diabetes. Sep 15, 2021; 12(9): 1401-1425
Published online Sep 15, 2021. doi: 10.4239/wjd.v12.i9.1401
Published online Sep 15, 2021. doi: 10.4239/wjd.v12.i9.1401
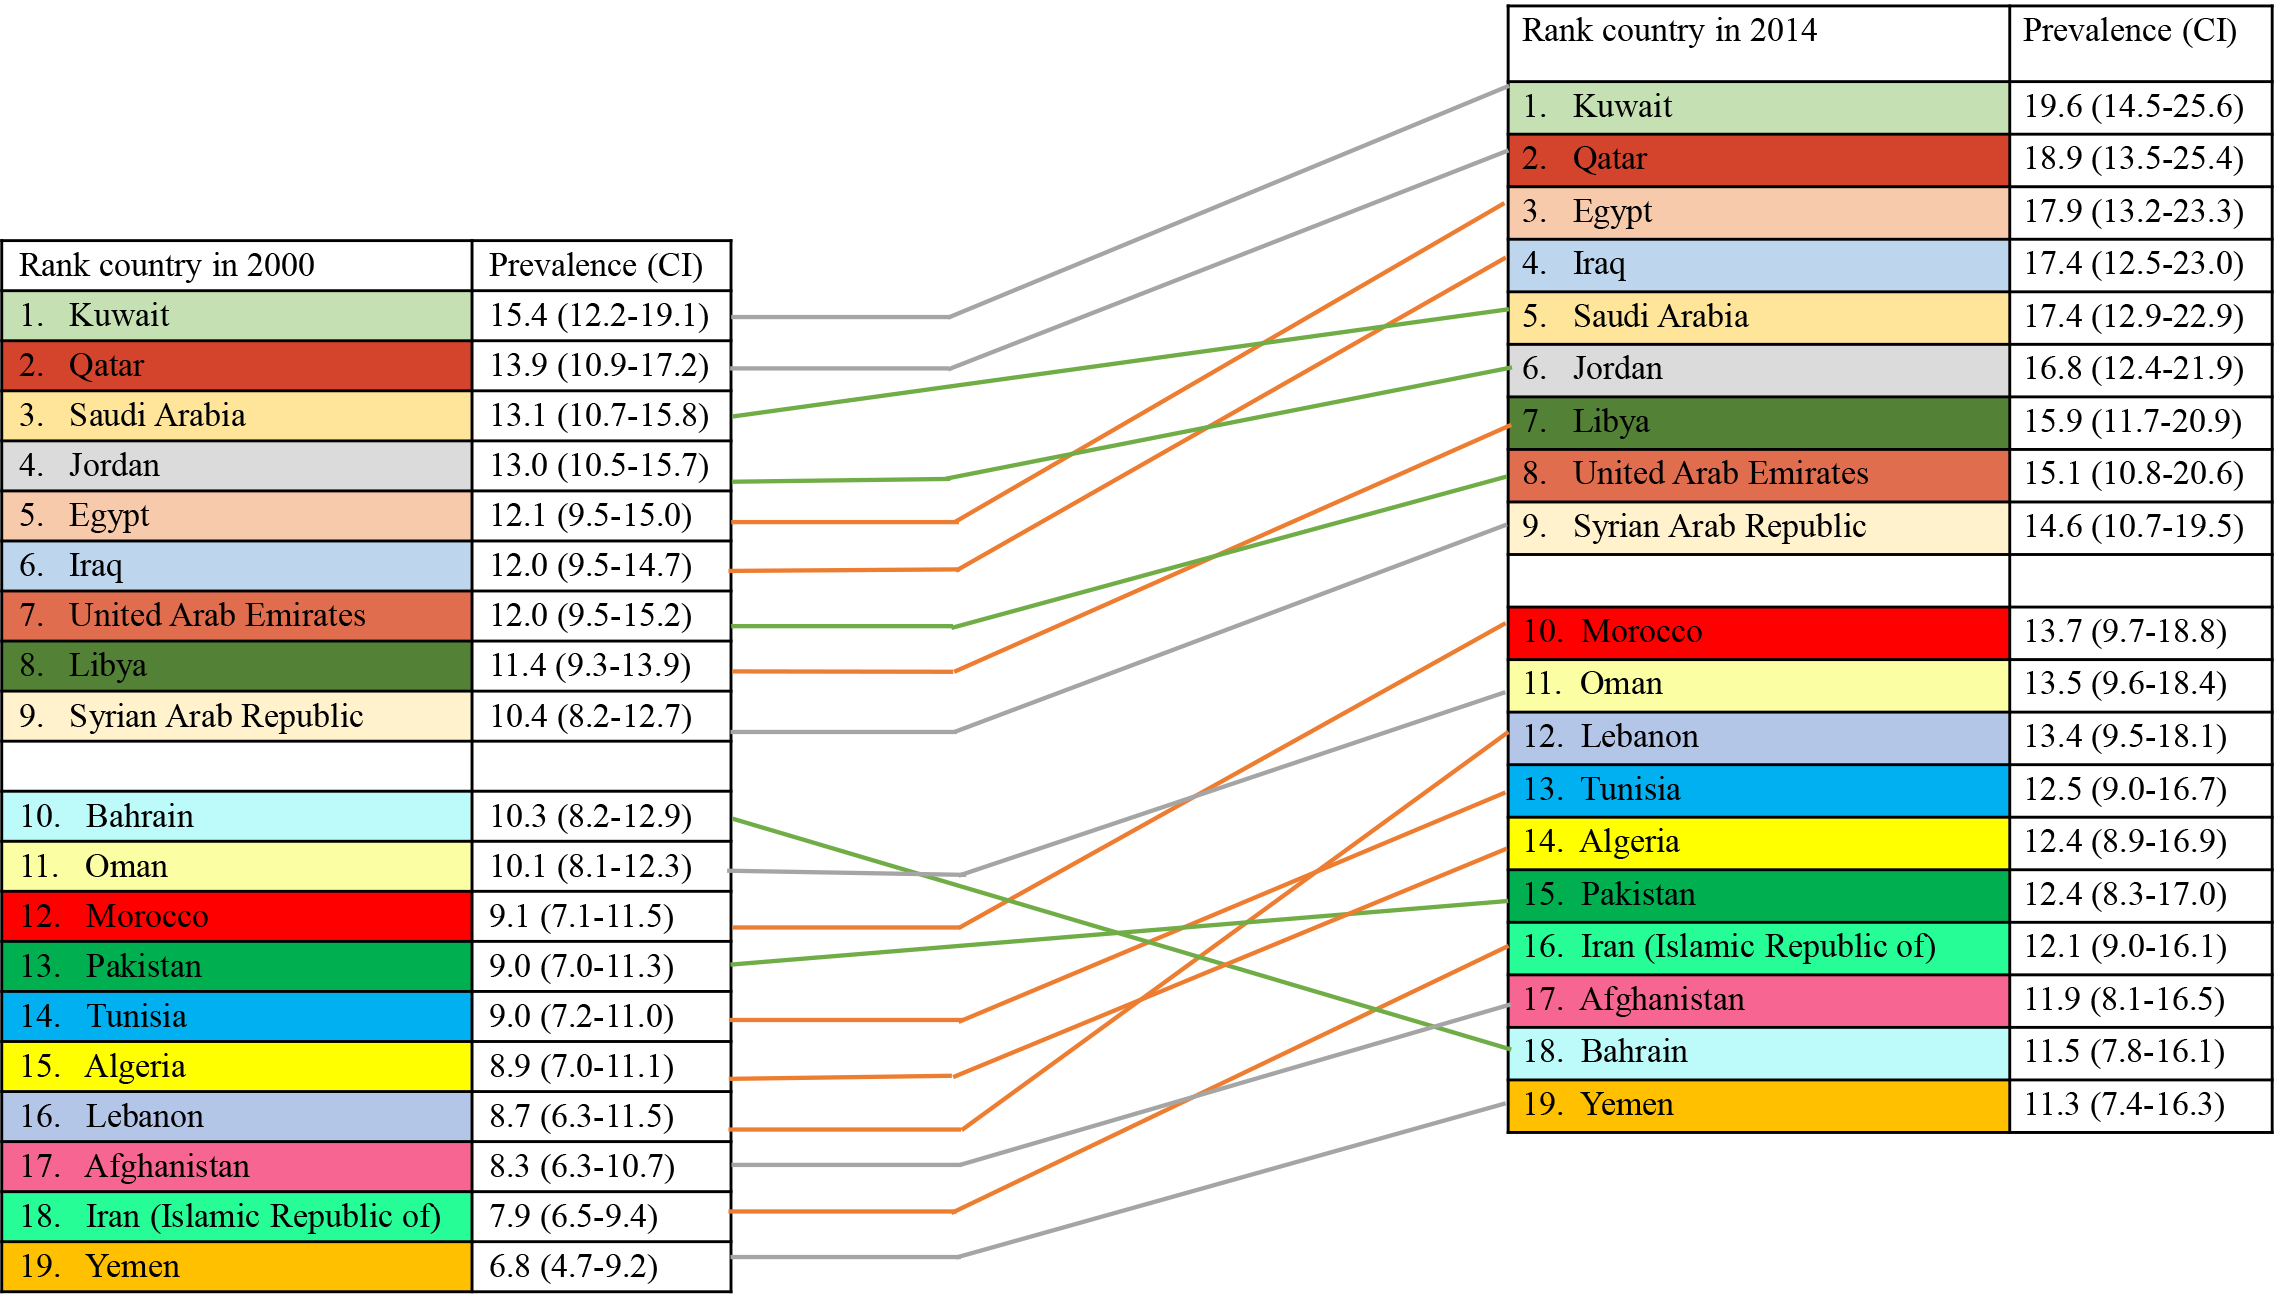
Figure 1 Middle East and North Africa countries ranked by prevalence of type 2 diabetes in 2000 and 2014 (prevalence and confidence intervals are in %)[1].
CI: Confidence interval.
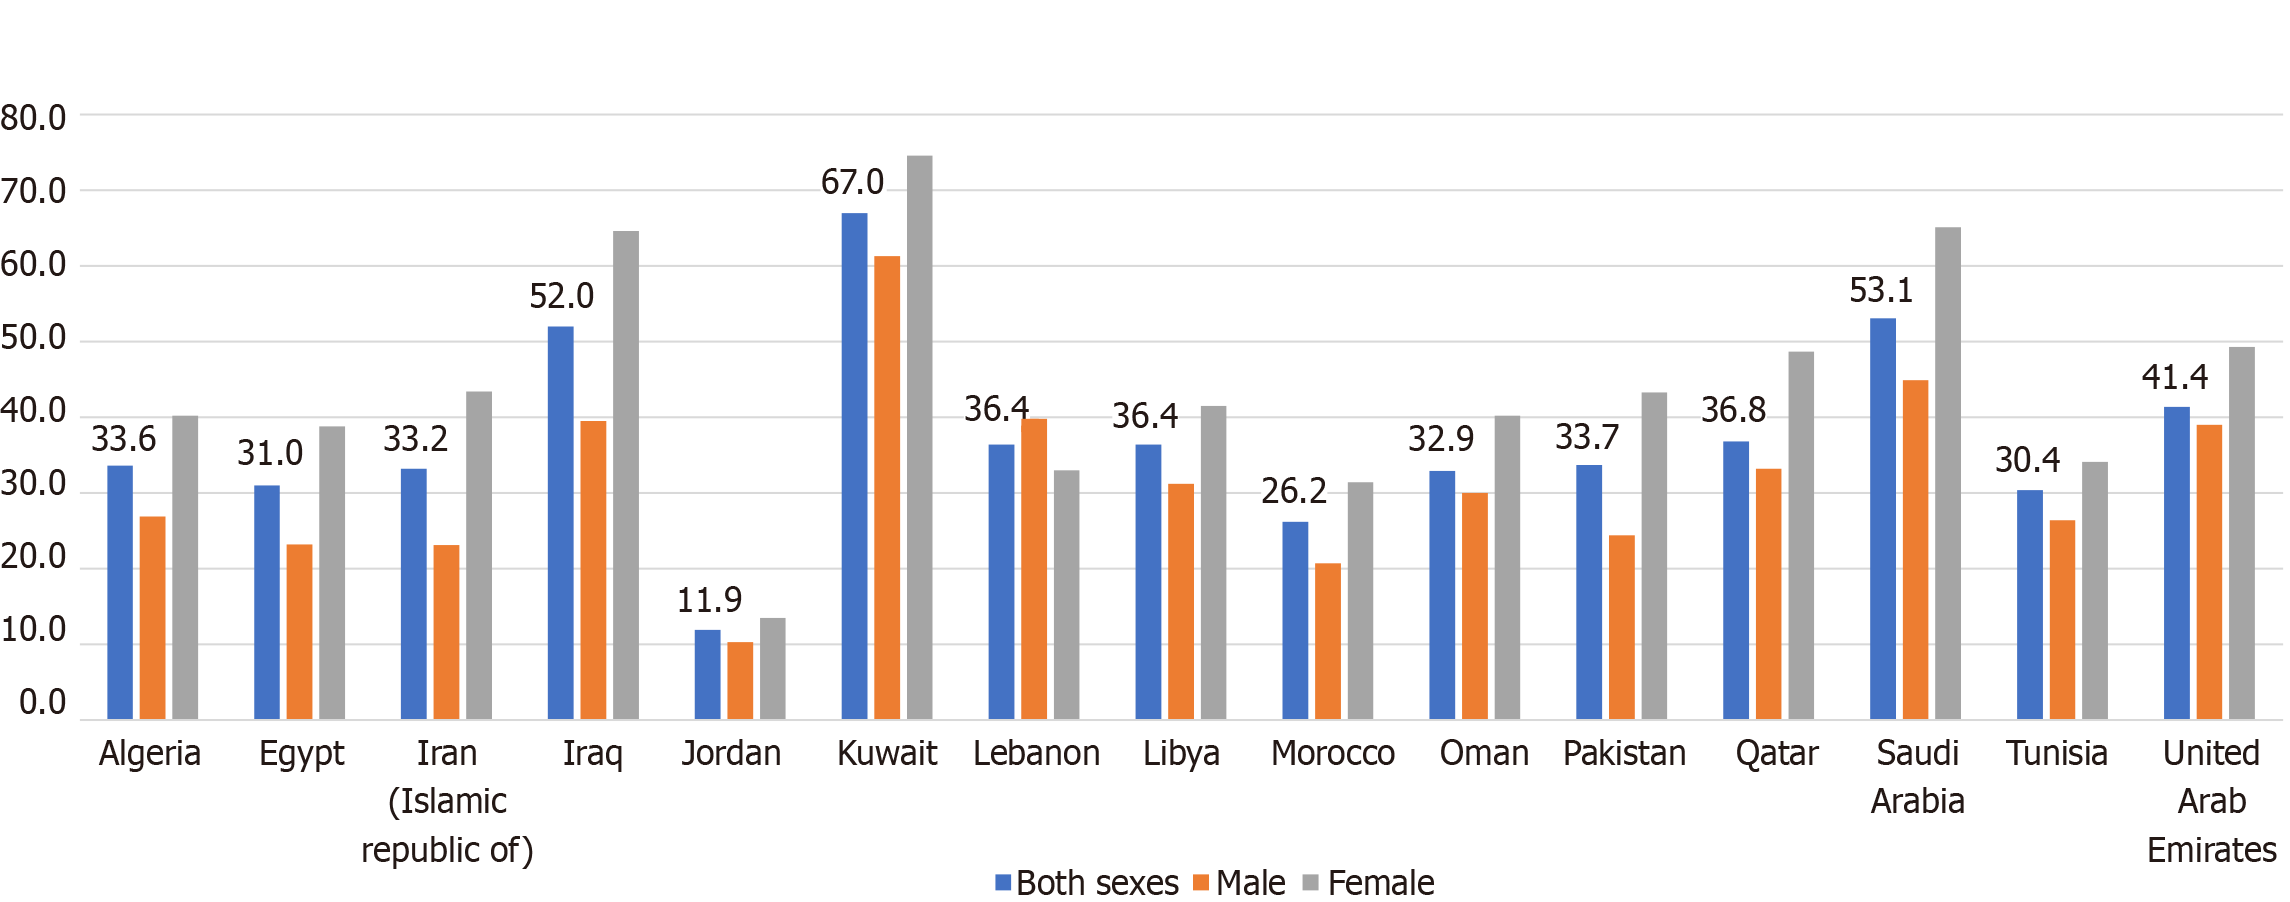
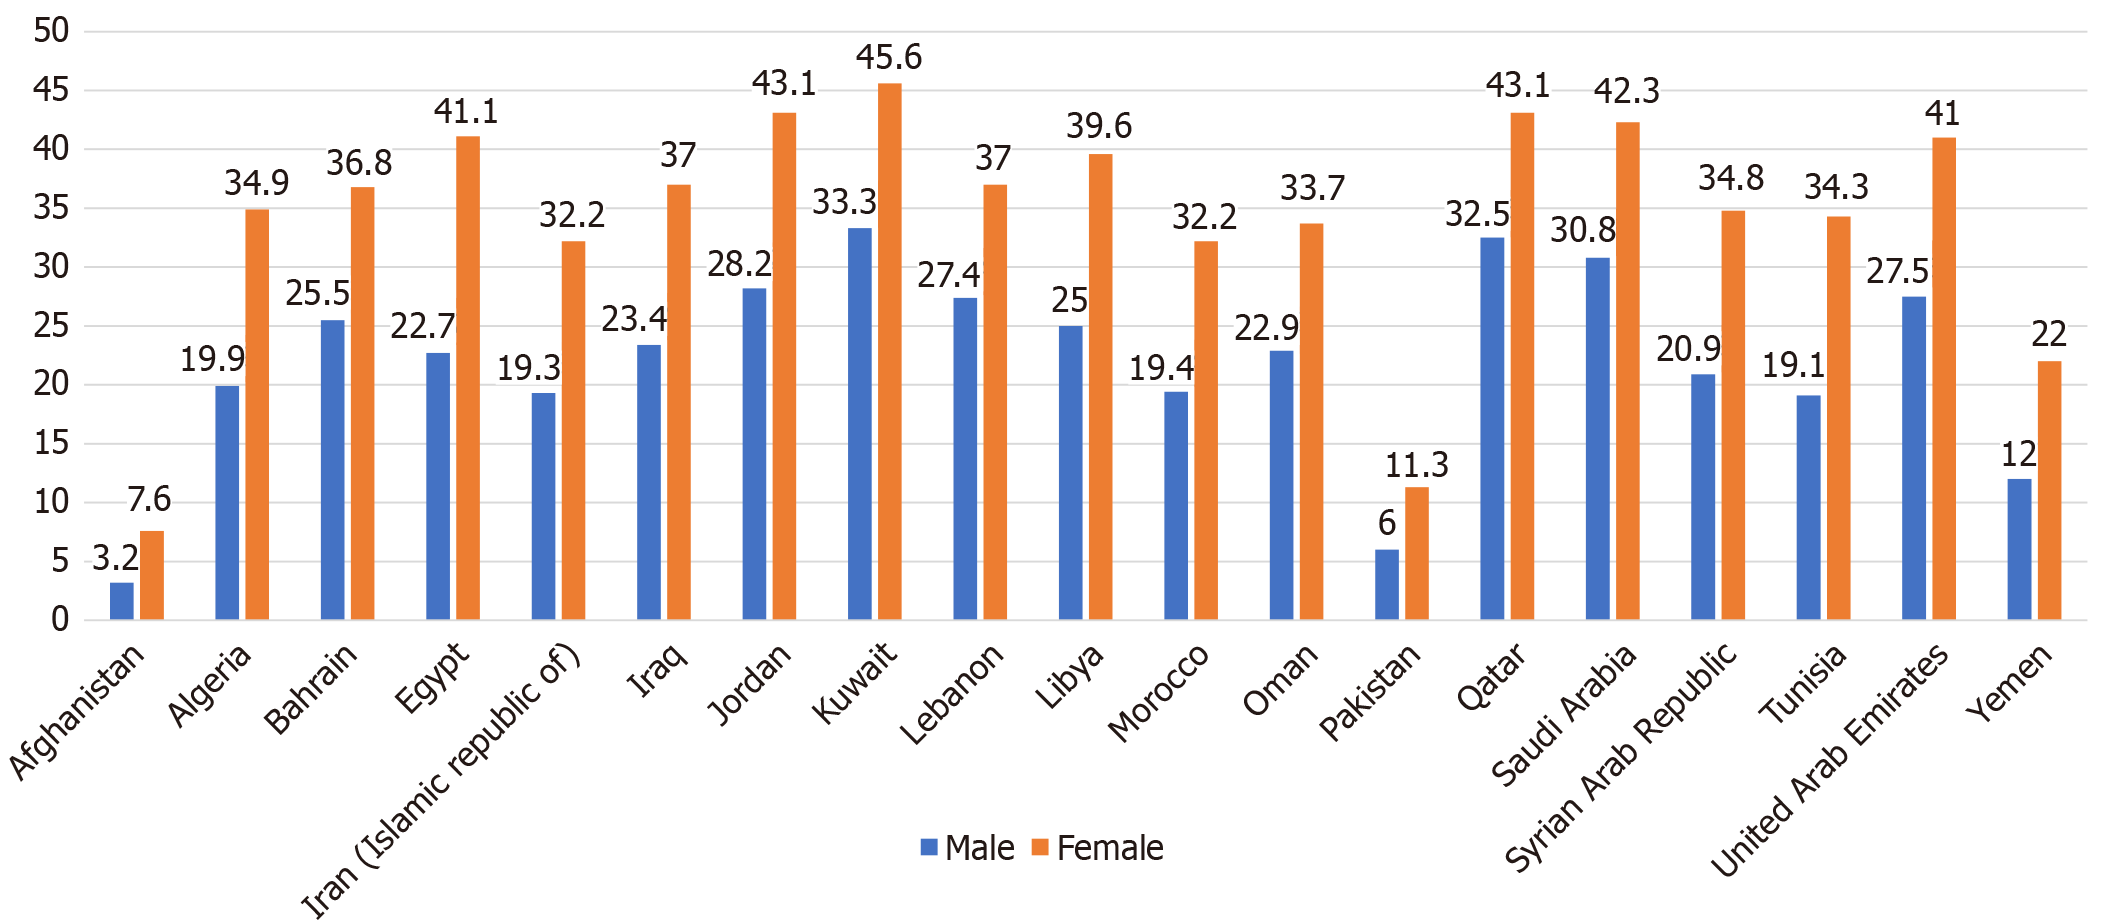
Figure 3 Prevalence (%) of insufficient physical activity among adults aged 18+ year in 2016 (age-standardized estimate)[1].
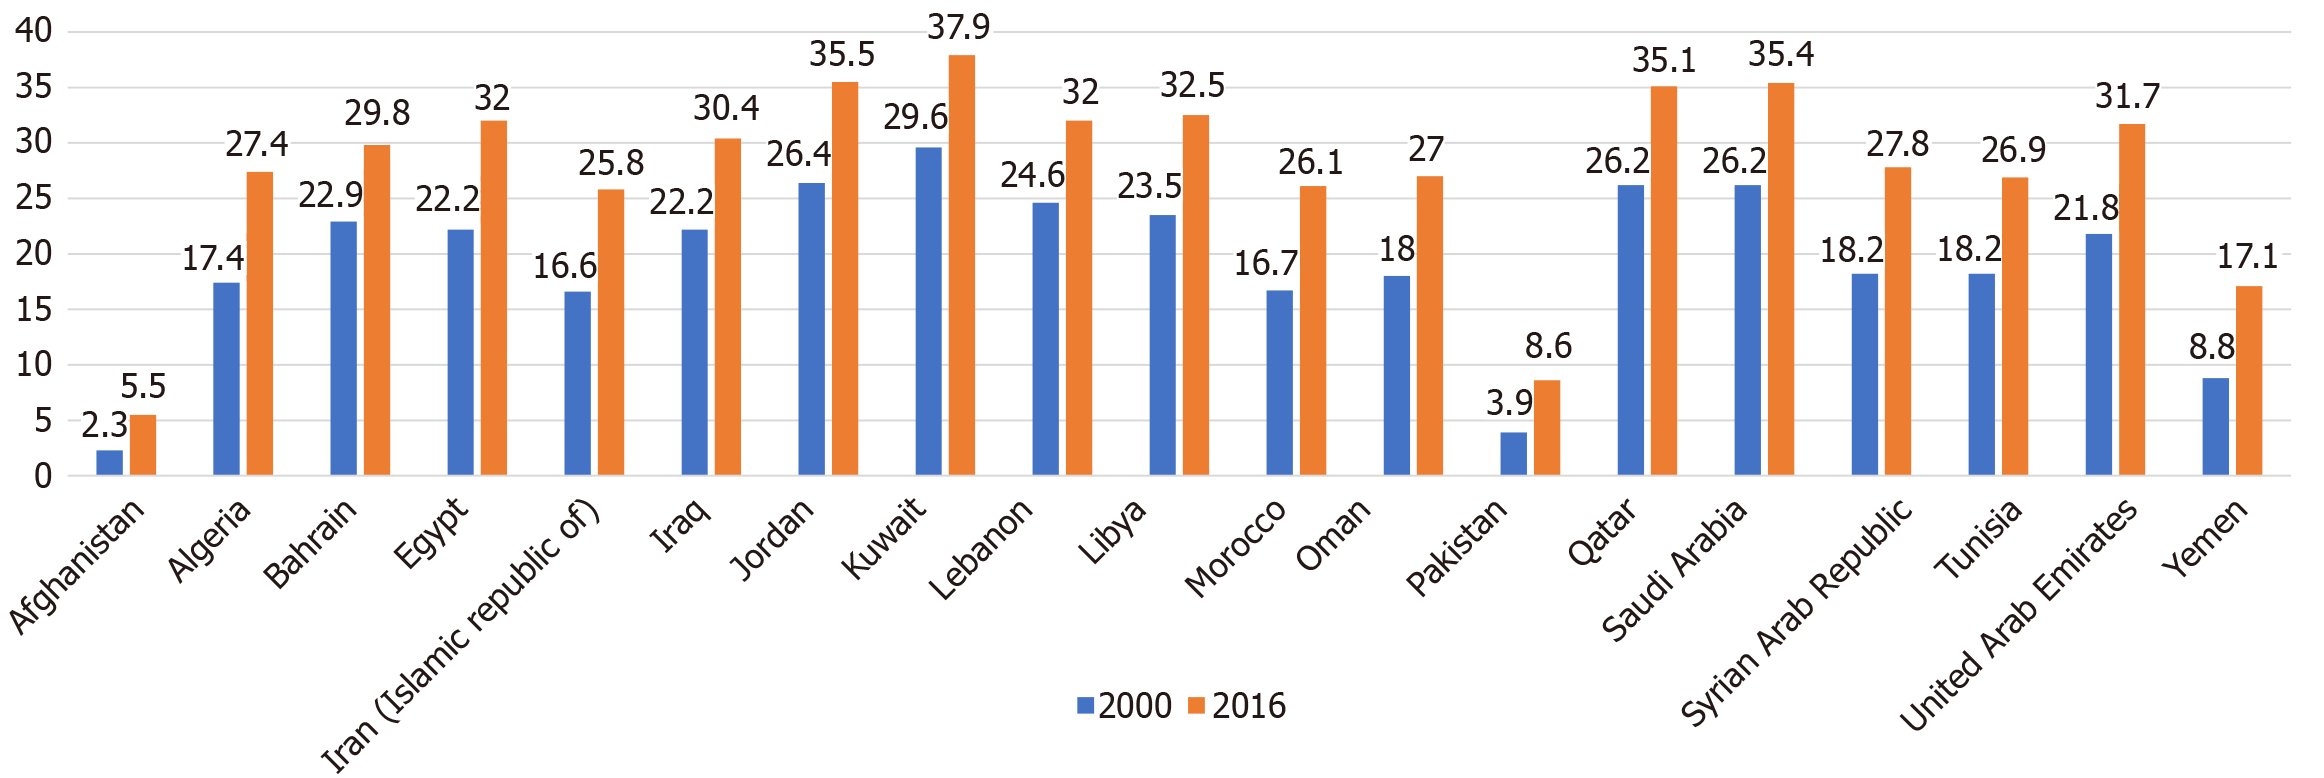
Figure 4 Prevalence (%) of obesity by country among adults aged 18 years or older, defined as body mass index ≥ 30 kg/m2 (age-standardized estimate) in 2000 and 2016[70].
Figure 5 Prevalence (%) of obesity by country among male and female adults aged 18 years or older.
Obesity defined as body mass index ≥ 30 kg/m2 (age-standardized estimate) in 2000 and 2016[70].
- Citation: El-Kebbi IM, Bidikian NH, Hneiny L, Nasrallah MP. Epidemiology of type 2 diabetes in the Middle East and North Africa: Challenges and call for action. World J Diabetes 2021; 12(9): 1401-1425
- URL: https://www.wjgnet.com/1948-9358/full/v12/i9/1401.htm
- DOI: https://dx.doi.org/10.4239/wjd.v12.i9.1401


