Copyright
©The Author(s) 2021.
World J Diabetes. May 15, 2021; 12(5): 673-684
Published online May 15, 2021. doi: 10.4239/wjd.v12.i5.673
Published online May 15, 2021. doi: 10.4239/wjd.v12.i5.673
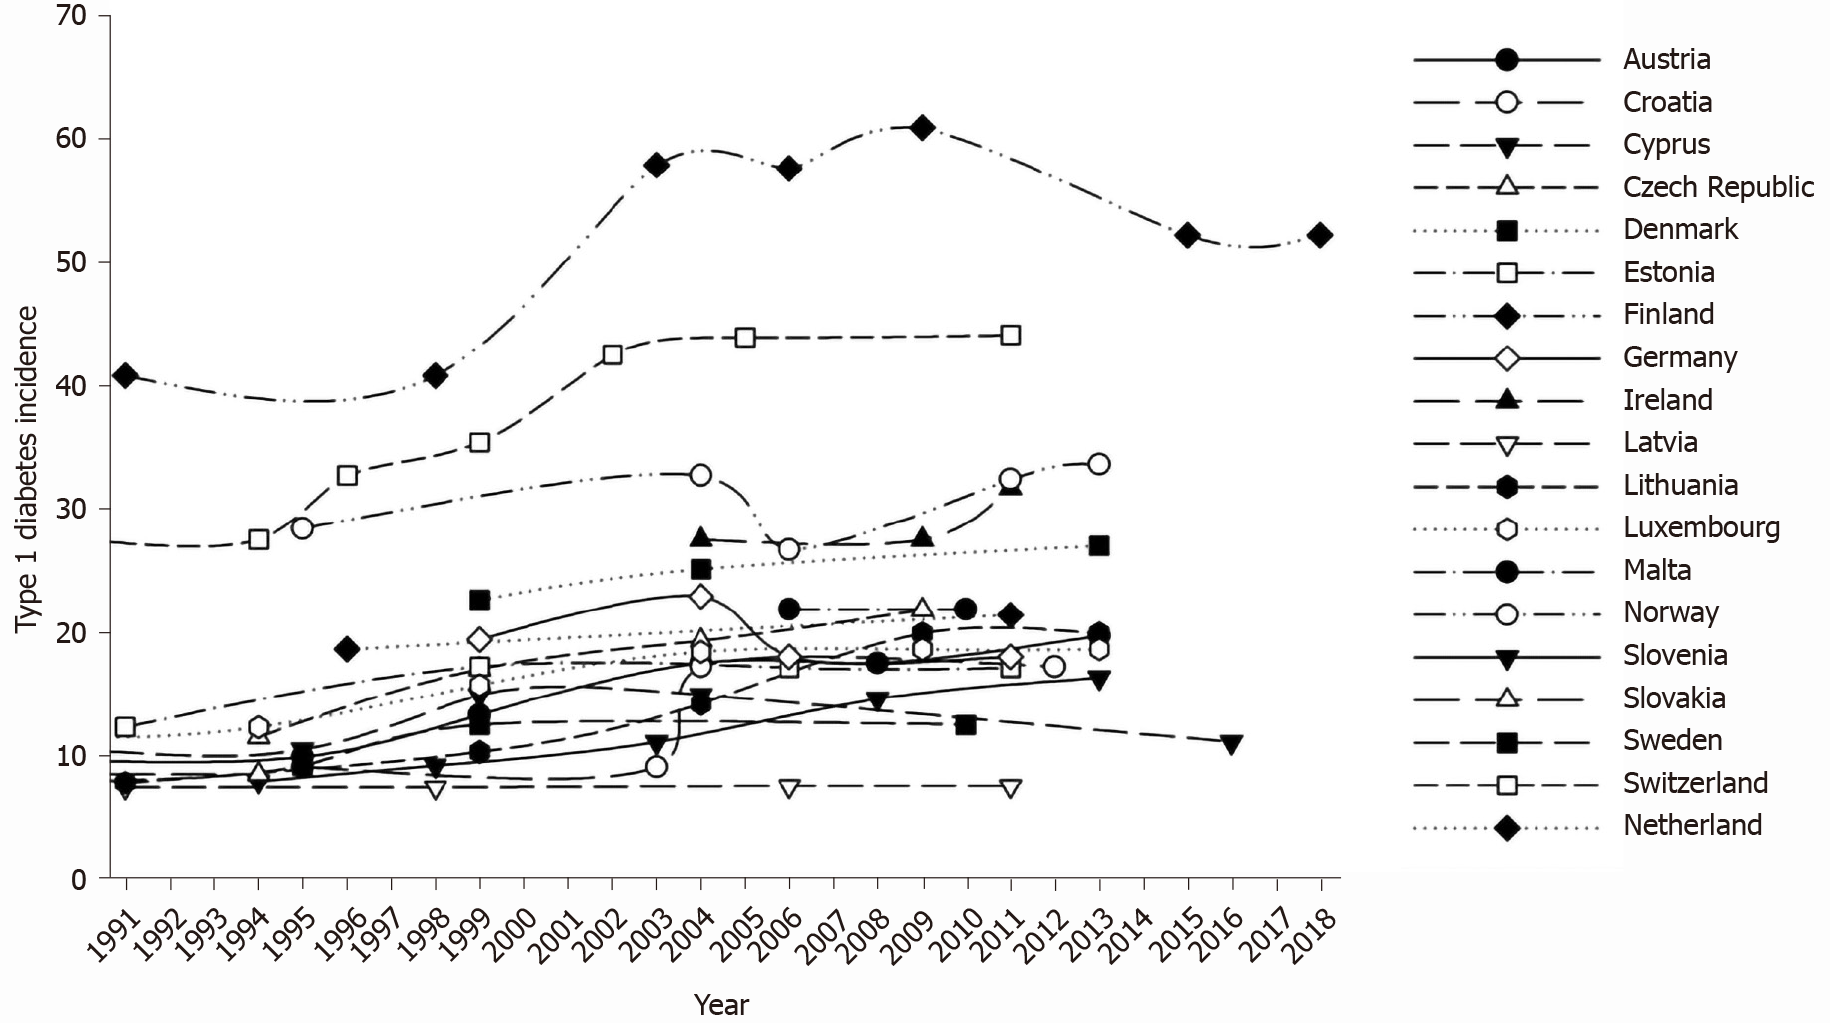
Figure 1 Age-standardized incidence of type 1 diabetes (× 100000) in children from 19 European countries, according to time.
Incidence data were recorded at various time intervals in the period 1990-2018 and were combined. Data for boys and girls have been pooled.
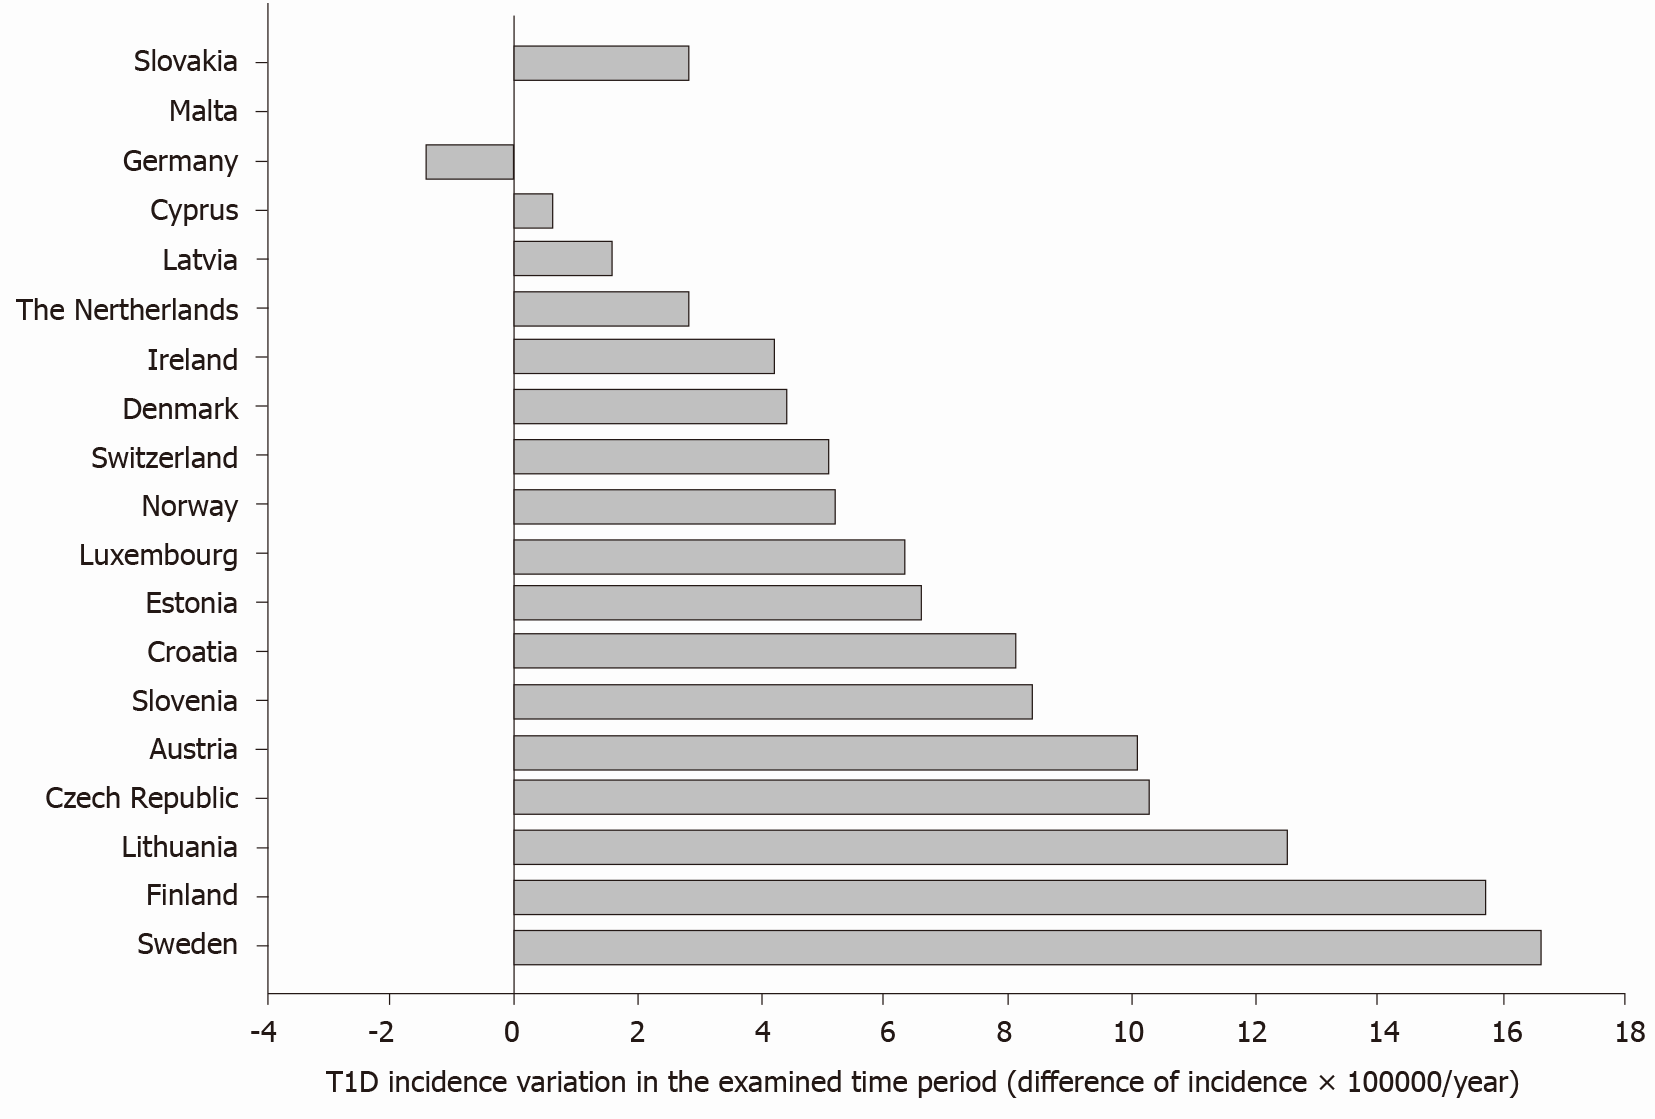
Figure 2 Type 1 diabetes incidence variation in the period 1990-2018.
Data are presented as absolute difference between the recorded incidence (× 100000) in the last vs first report, in each country. Malta was excluded from the analysis, since type 1 diabetes incidence was assessed in a single report exploring a single time period. T1D: Type 1 diabetes.
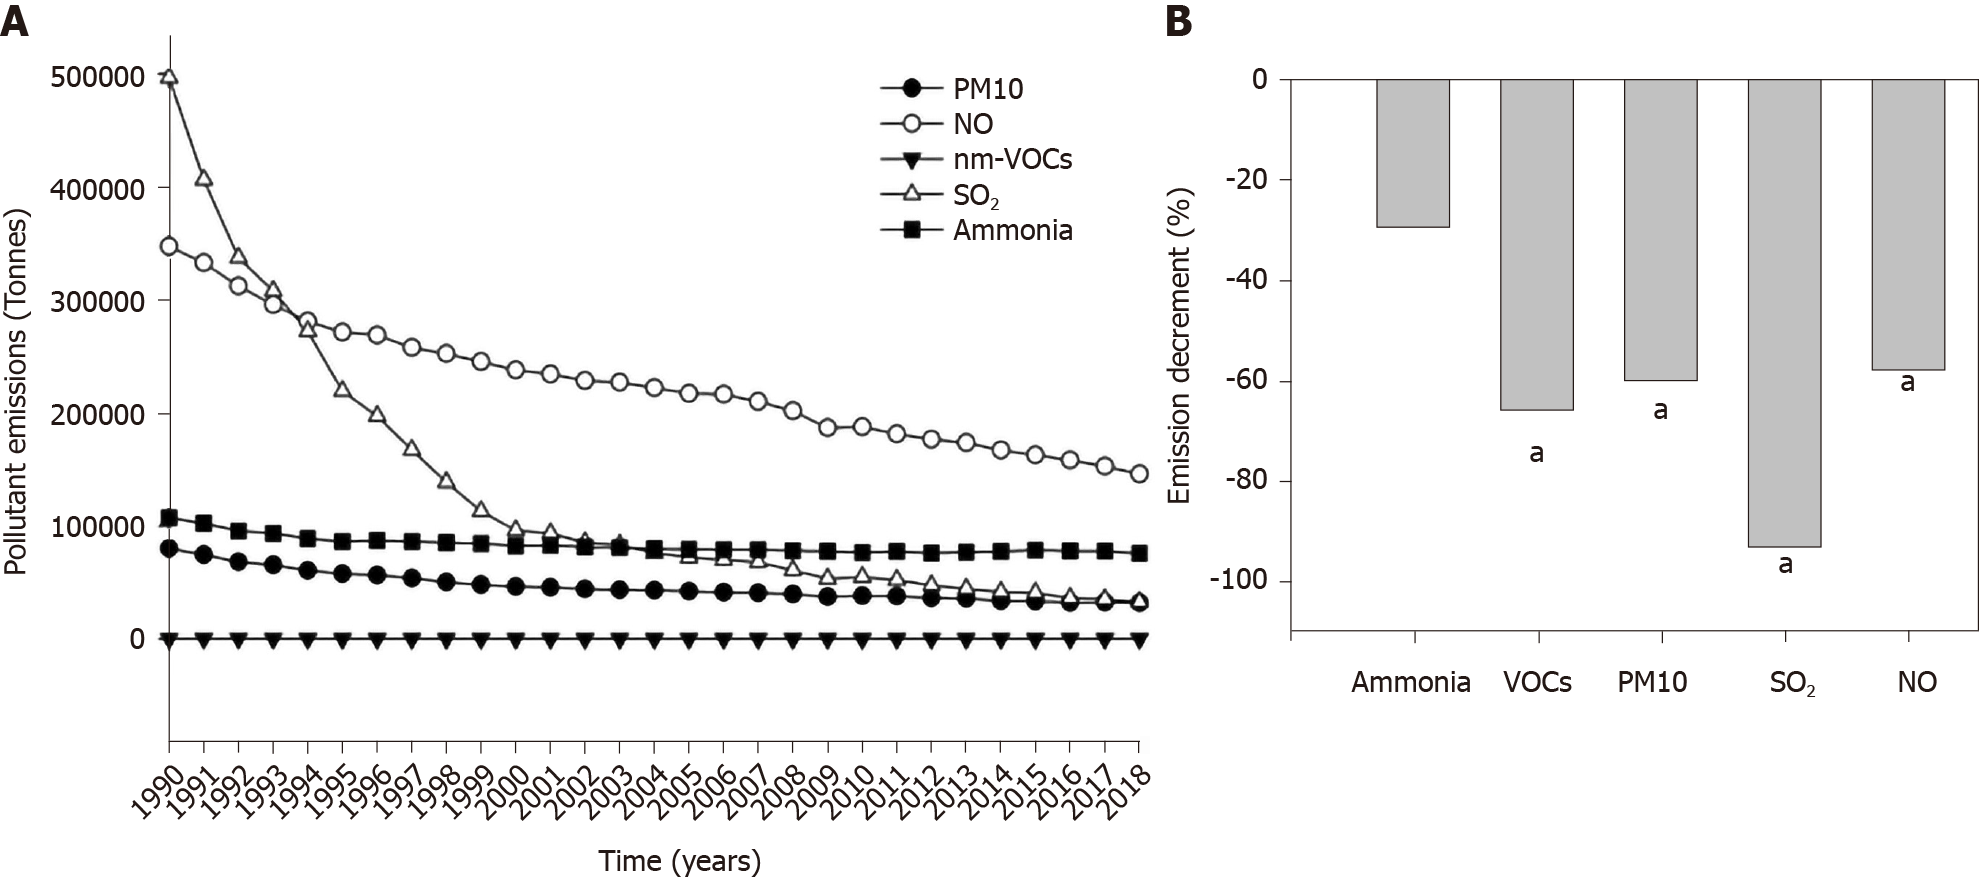
Figure 3 Pollutant emissions.
A: Time variations in the nationwide production of pollutants (tonnes per year, total sector of emissions for each pollutant) recorded in 19 European countries from 1990 to 2018. Symbols indicate average values; B: Percent decrement (2018 vs 1990) in the nationwide production of pollutants (aP < 0.05, last vs first year, Mann-Whitney). NO: Nitrogen oxides; PM10: Particulate matter < 10 μm; SO2: Sulphur oxide; VOCs: Volatile organic compounds.
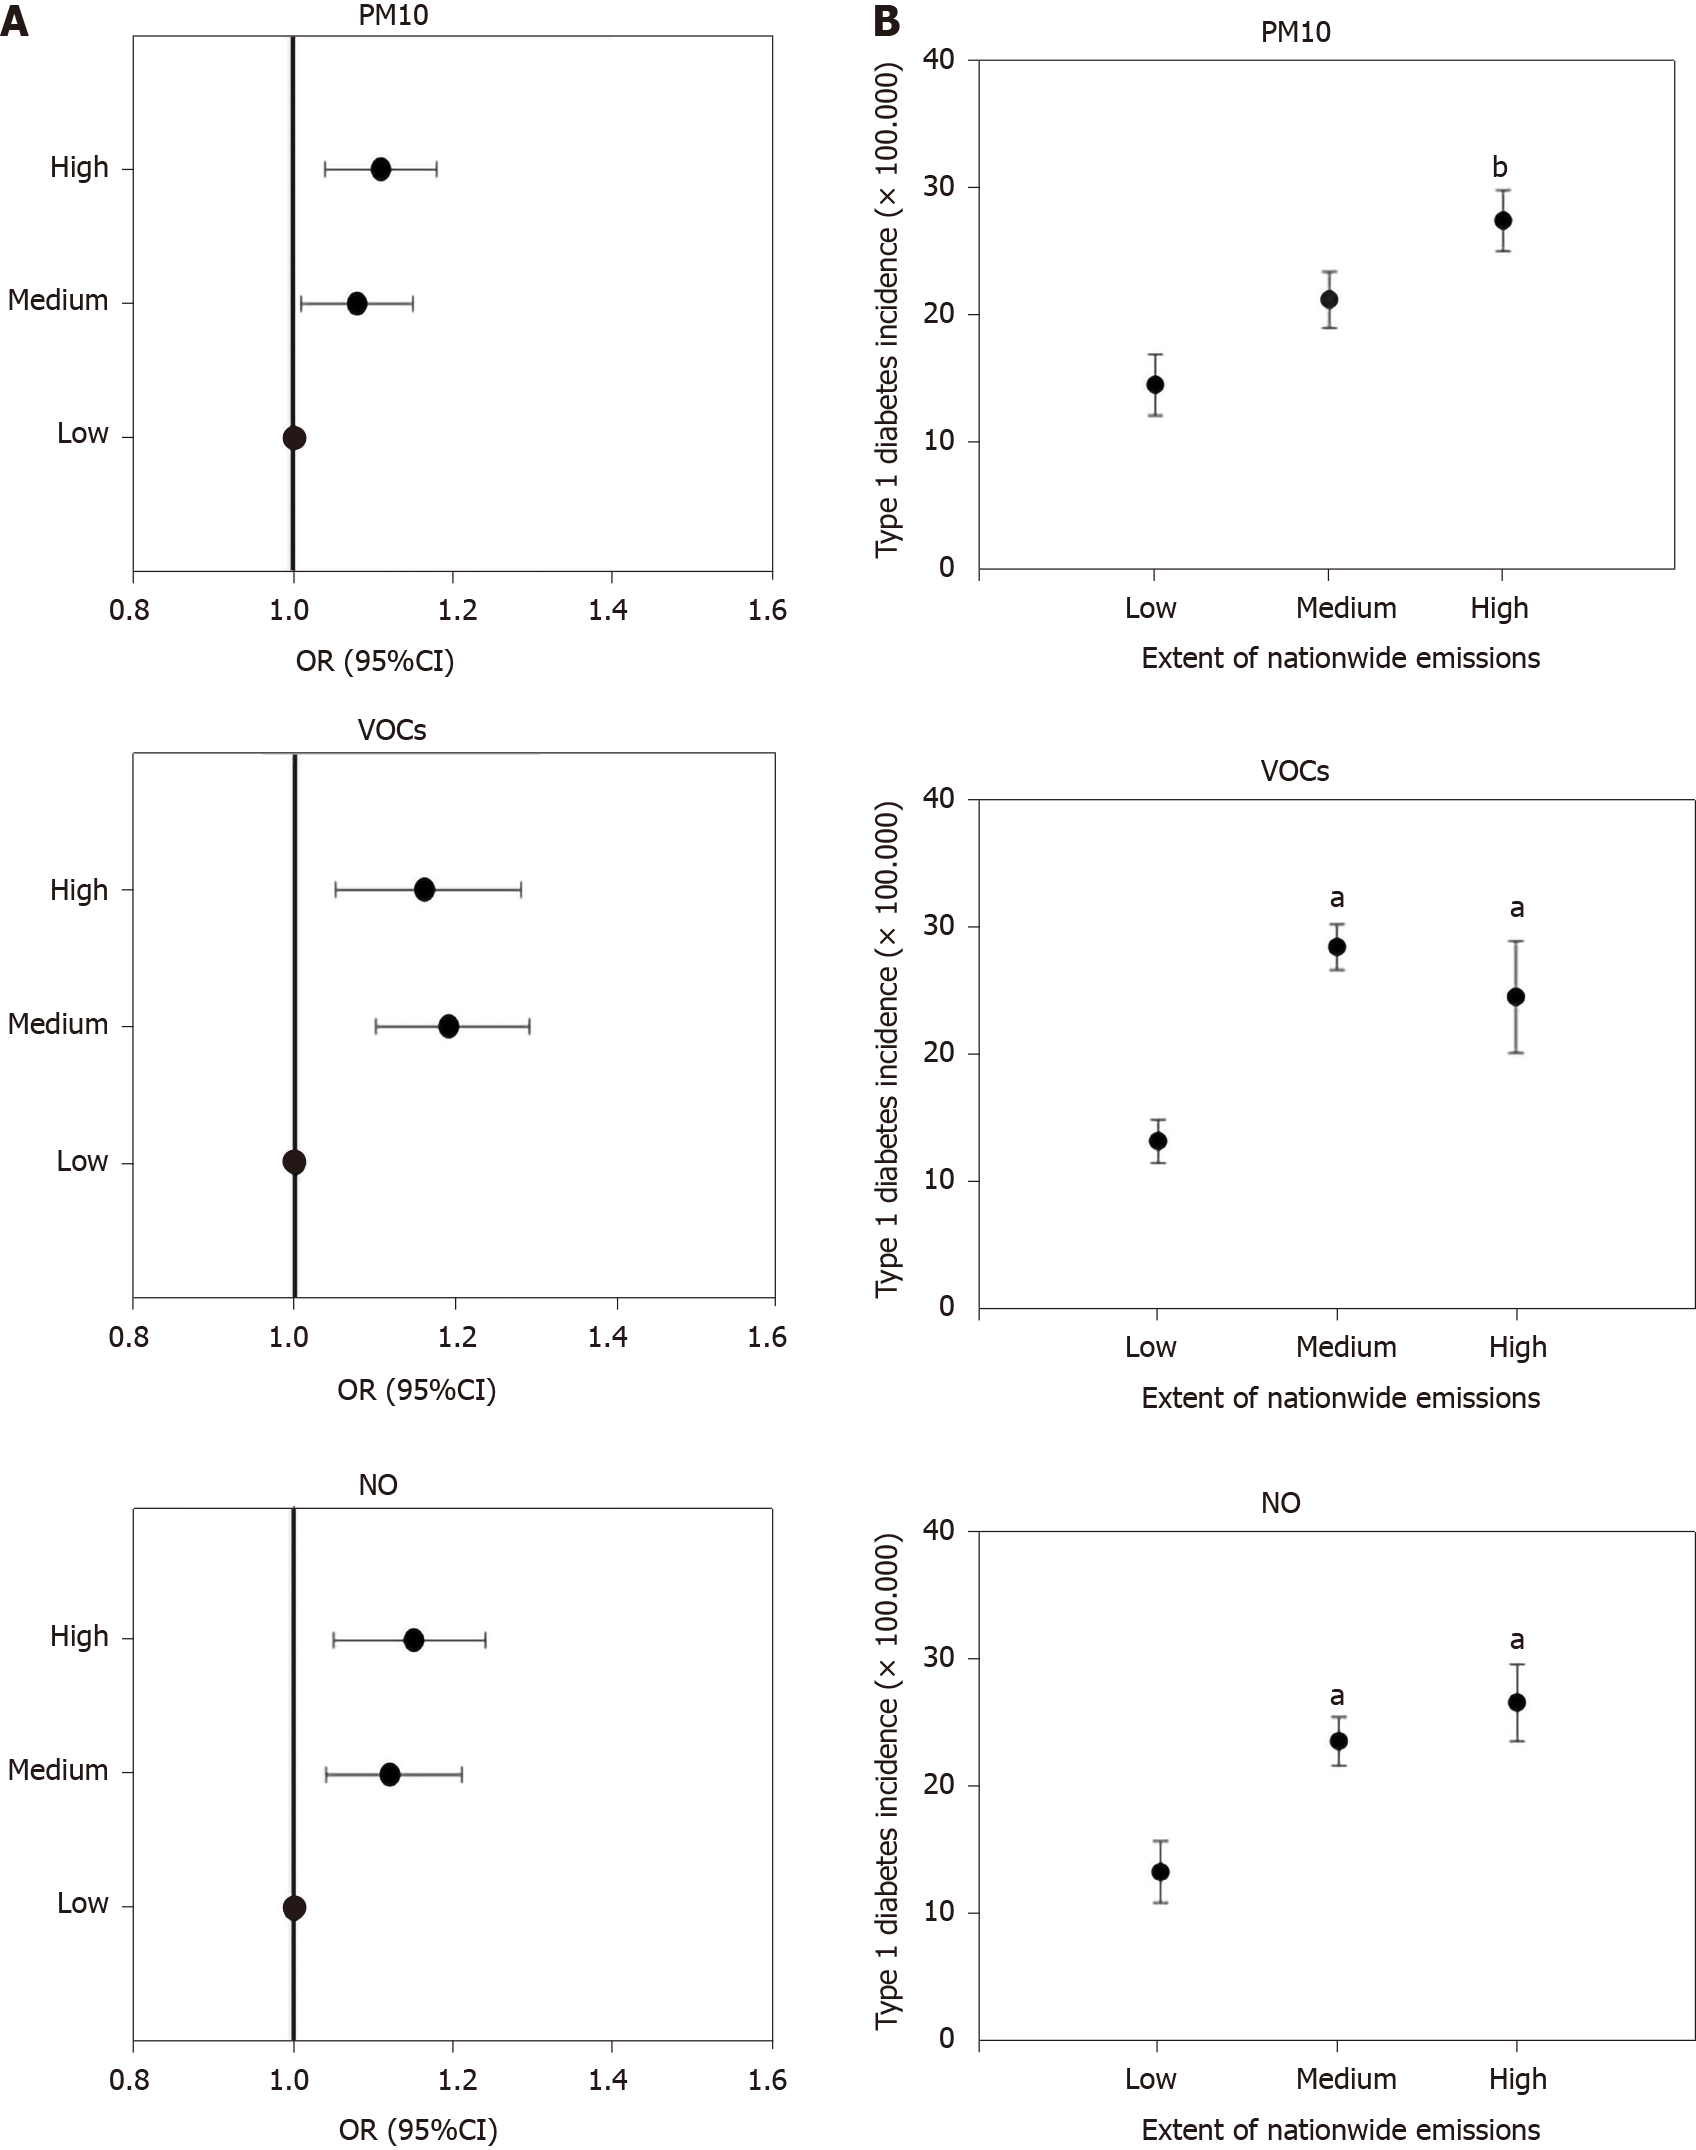
Figure 4 Odds ratios, 95% confidence interval, and incidence of type 1 diabetes in 19 European countries grouped according to tertiles of emissions of particulate matter < 10 μm, volatile organic compounds, and nitrogen oxides.
A: Odds ratios and 95% confidence intervals of type 1 diabetes incidence in 19 European countries grouped according to tertiles of particulate matter < 10 μm, volatile organic compounds, and nitrogen oxides (NO) emissions (total sector of emissions for each pollutant in each country). Values were calculated by logistic regression models, with type 1 diabetes incidence as the dependent variable, and tertiles of each pollutant (low, medium and high pollutant emissions) as the independent variable; B: Type 1 diabetes incidence in 19 European countries grouped according to tertiles (low, medium, high) of emissions of particulate matter < 10 μm, volatile organic compounds, and nitrogen oxides. The amount of pollutant emissions and the average type 1 diabetes incidence were calculated for each country in the same time period. Data are means ± standard error. aP < 0.05 vs countries in the low tertile of emissions (Kruskal-Wallis analysis of variance by ranks followed by multiple-comparison Z-value test); bP < 0.05 vs countries in the low and medium tertile of emissions. CI: Confidence interval; NO: Nitrogen oxides; OR: Odds ratios; PM10: Particulate matter < 10 μm; VOCs: Volatile organic compounds.
- Citation: Di Ciaula A, Portincasa P. Relationships between emissions of toxic airborne molecules and type 1 diabetes incidence in children: An ecologic study. World J Diabetes 2021; 12(5): 673-684
- URL: https://www.wjgnet.com/1948-9358/full/v12/i5/673.htm
- DOI: https://dx.doi.org/10.4239/wjd.v12.i5.673


