Copyright
©The Author(s) 2021.
World J Diabetes. May 15, 2021; 12(5): 658-672
Published online May 15, 2021. doi: 10.4239/wjd.v12.i5.658
Published online May 15, 2021. doi: 10.4239/wjd.v12.i5.658
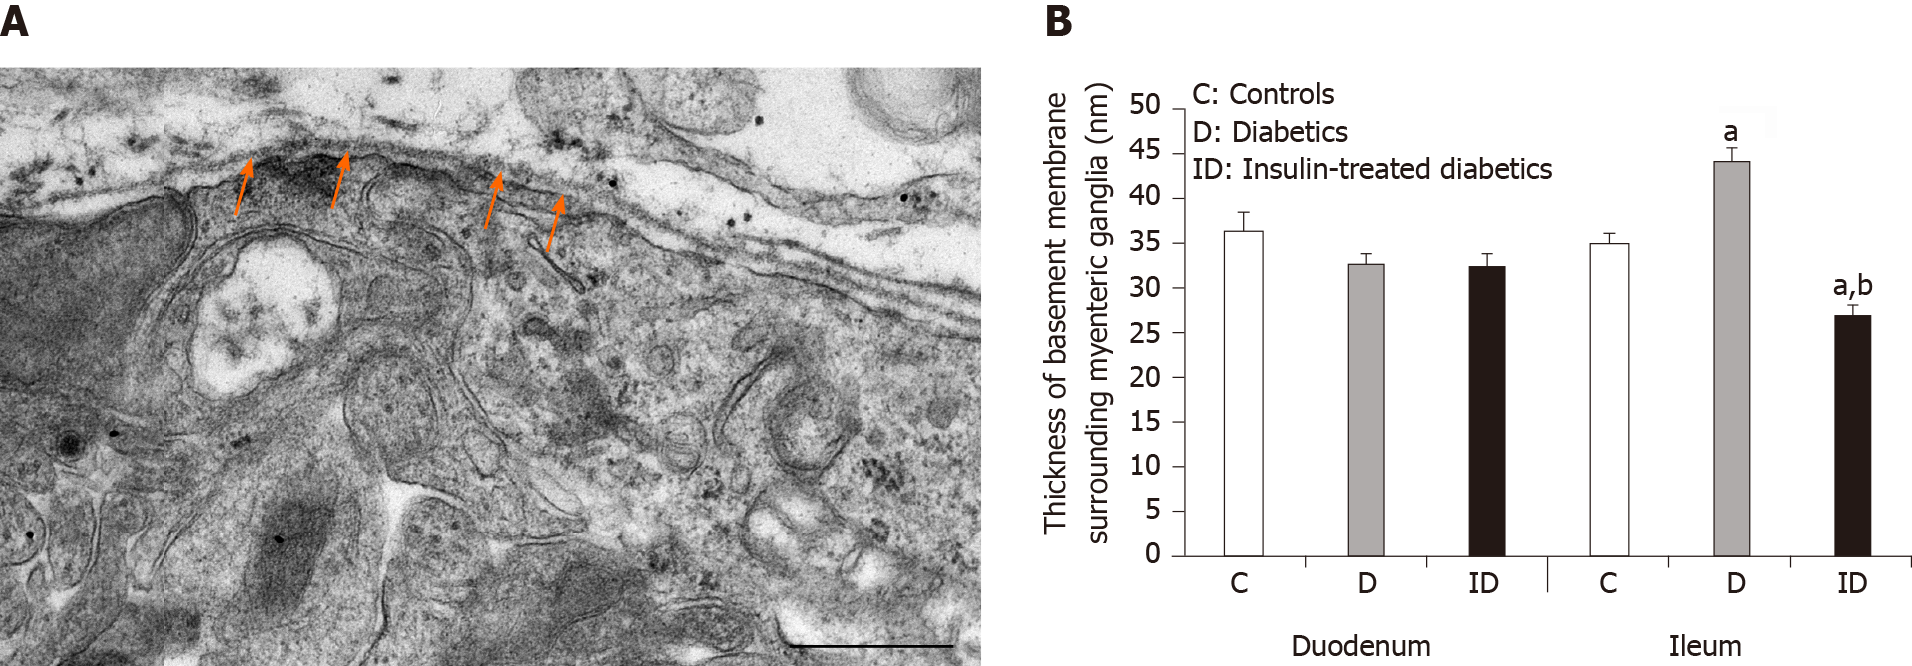
Figure 1 Representative electron micrograph of a myenteric ganglion from an insulin-treated diabetic rat.
A: The myenteric ganglion is surrounded by basement membrane (BM) (arrows). Scale bar: 500 nm; B: Quantitative evaluation of BM thickness in different gut segments of control, diabetic, and insulin-treated diabetic rats. The thickening of BM surrounding myenteric ganglia remained unchanged in the duodenum, however it increased significantly in the ileum of diabetic rats. Immediate insulin treatment prevented BM thickening in the ileum. aP < 0.0001 (relative to the controls); bP < 0.0001 (between diabetics and insulin-treated diabetics).
Figure 2 Representative fluorescent micrograph of a paraffin section of myenteric ganglia from the ileum of a control rat after matrix metalloproteinase 9-tissue inhibitor of metalloproteinase 1 double-labelling immunohistochemistry.
A: Matrix metalloproteinase 9 immunoreactivity is indicated in red; B: tissue inhibitor of metalloproteinase 1 immunoreactivity is shown in green; and C: The merge is depicted on. Scale bar: 20 μm. MG: Myenteric ganglia; LSM: Longitudinal smooth muscle layer; CSM: Circular smooth muscle layer; arrows-blood vessels.
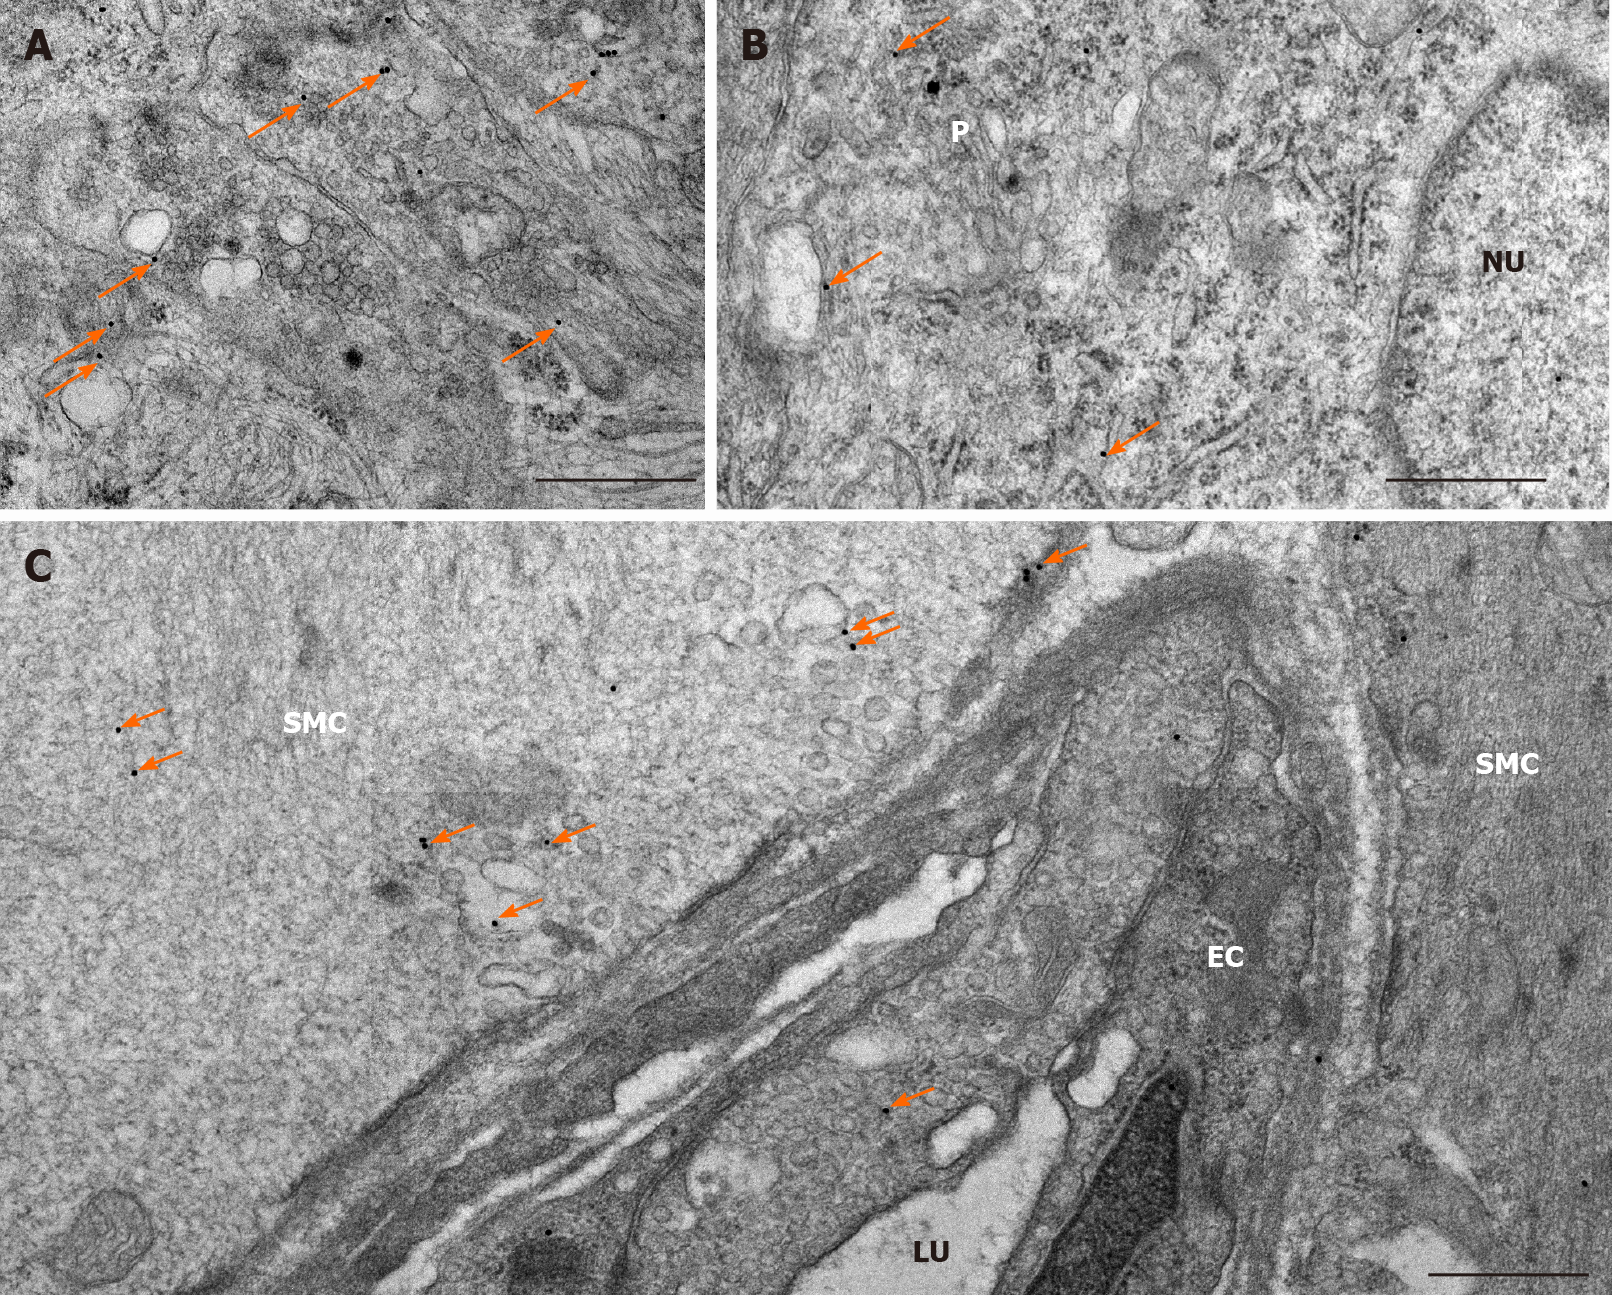
Figure 3 Representative electron micrographs subjected to matrix metalloproteinase 9 post-embedding immunohistochemistry.
A: Myenteric ganglia from a control duodenum; B: A diabetic ileum; and C: Capillary endothelium and intestinal smooth muscle from a control duodenum. The 18 nm gold particles (arrows) indicating matrix metalloproteinase 9 were observed in cytosol, nuclei or in association with intracellular organelles and plasma membrane. Scale bars: 500 nm. P: Neuronal perikaryon; N: Nucleus; SMC: Smooth muscle cell; EC: Endothelial cell; LU: Capillary lumen.
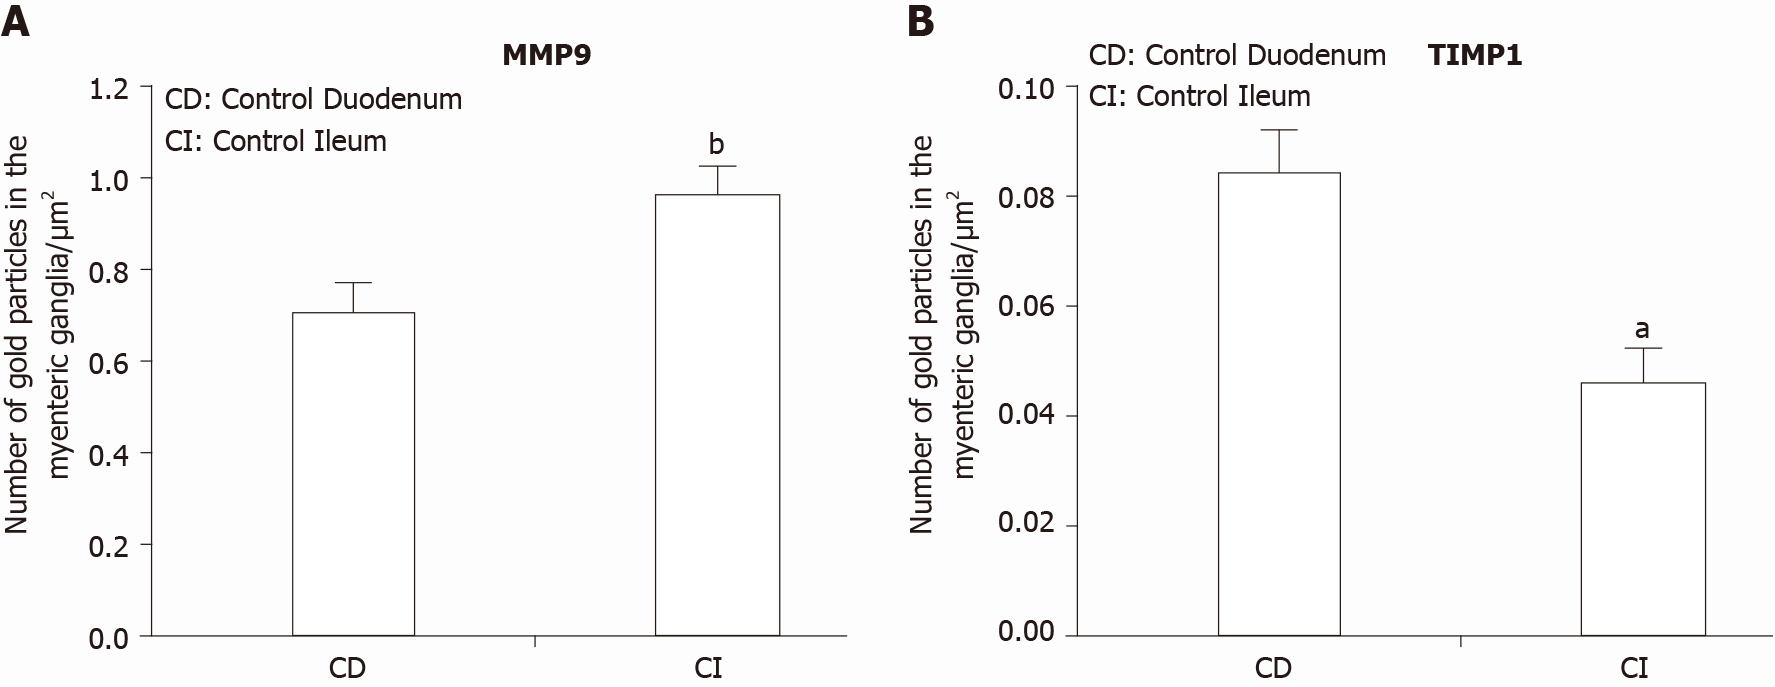
Figure 4 Quantitative changes in MMP9 and TIMP1 expression.
A: Quantitative evaluation of matrix metalloproteinase 9 (MMP9); and B: Quantitative evaluation of tissue inhibitor of metalloproteinase 1 (TIMP1) labelling gold particles in myenteric ganglia from different gut segments of control rats. In control conditions, the number of MMP9 particles was significantly higher, while TIMP1-labeling was significantly lower in the distal part of the small intestine. Data are expressed as means ± SEM. aP < 0.01 and bP < 0.001 (between control duodenum and control ileum).
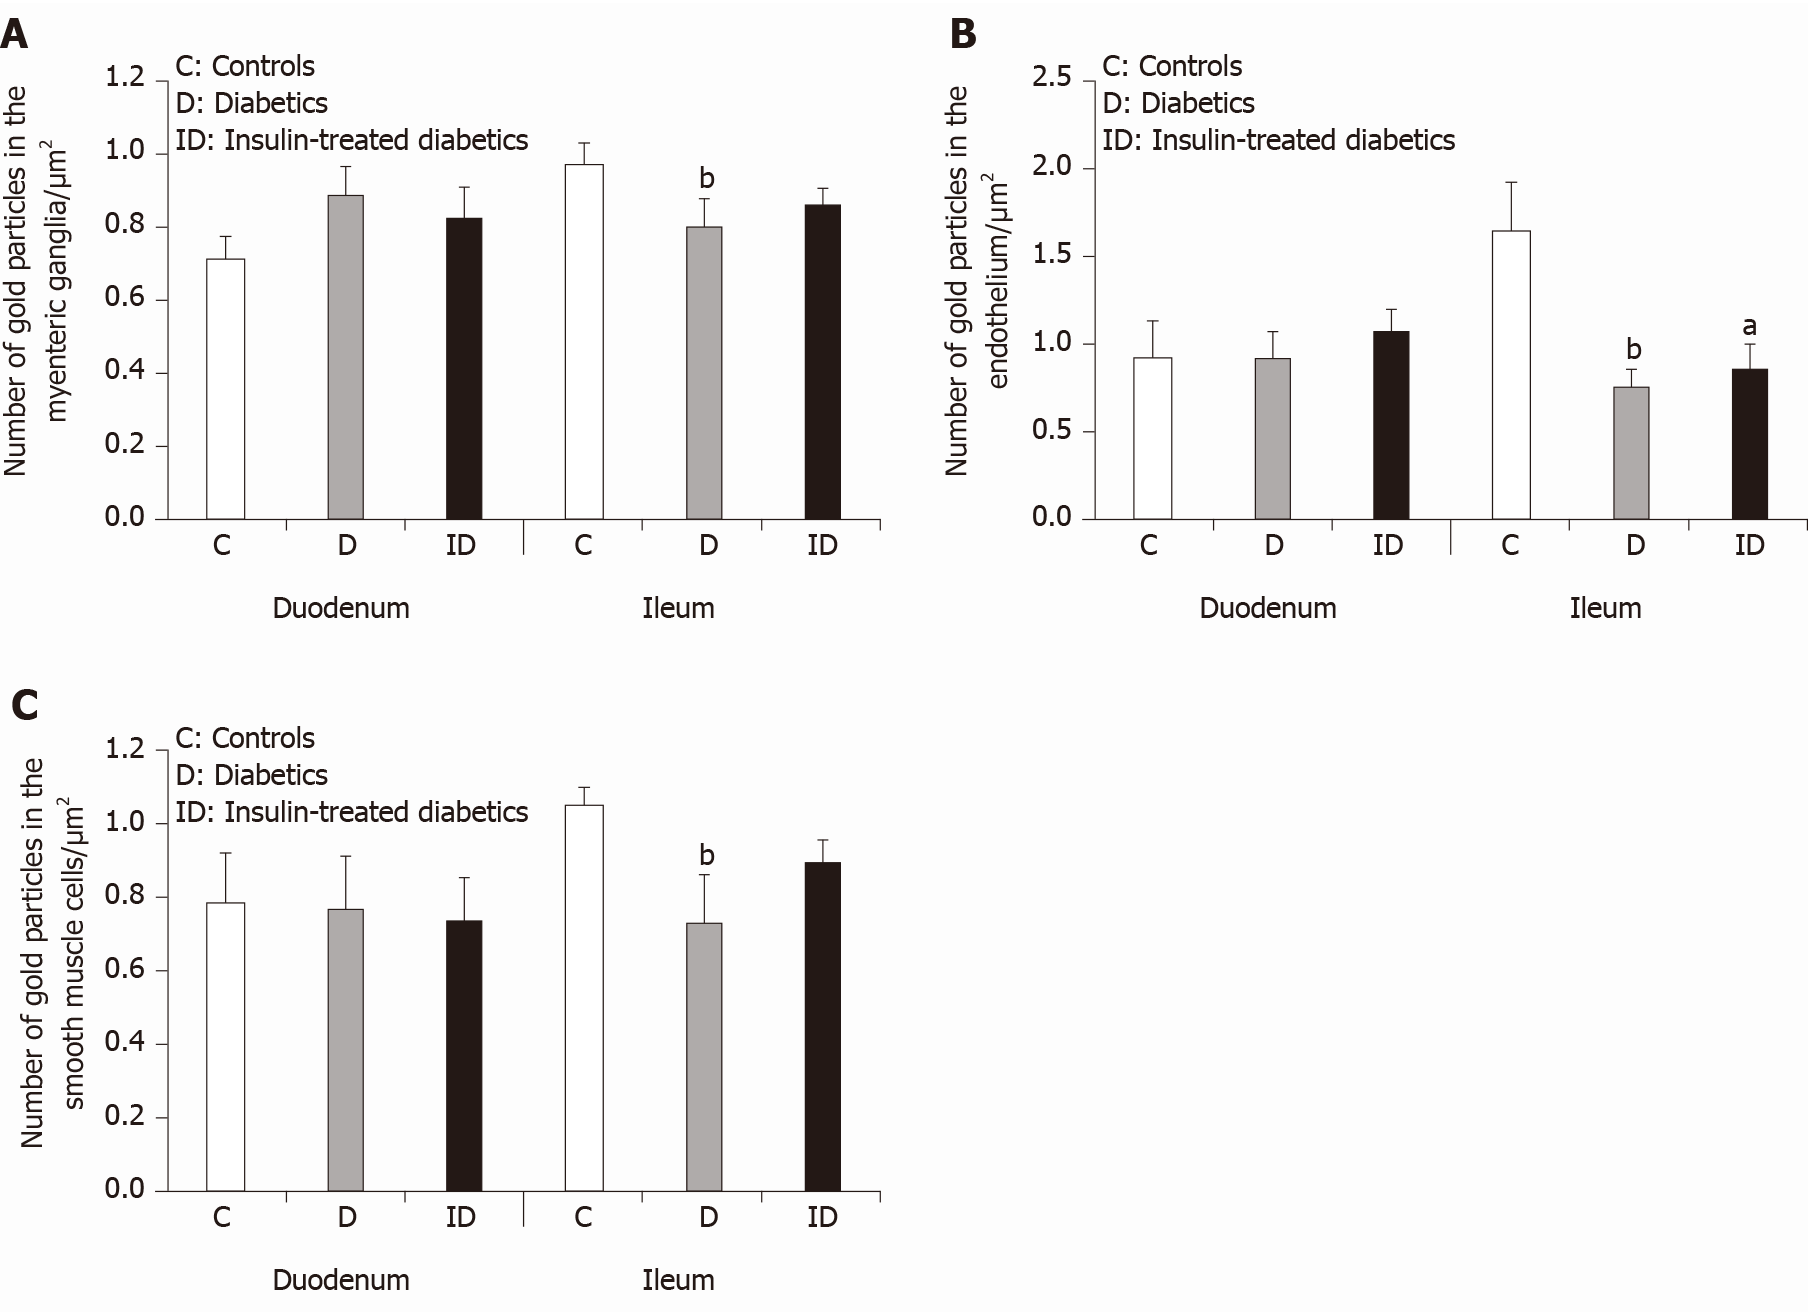
Figure 5 Quantitative changes in matrix metalloproteinase 9 expression in different cellular compartments.
A: Quantitative evaluation of matrix metalloproteinase 9 (MMP9)-labeling gold particles in myenteric ganglia; B: Capillary endothelium; and C: Intestinal smooth muscle cells from different gut segments of control, diabetic, and insulin-treated diabetic rats. In diabetics, the number of MMP9-labeling gold particles was significantly decreased in all cellular compartments of the ileum, while it was unchanged in the duodenum relative to controls. The number of gold particles was closer to the control values after immediate insulin treatment. Data are expressed as means ± SEM. aP < 0.05 and bP < 0.01 (relative to controls).
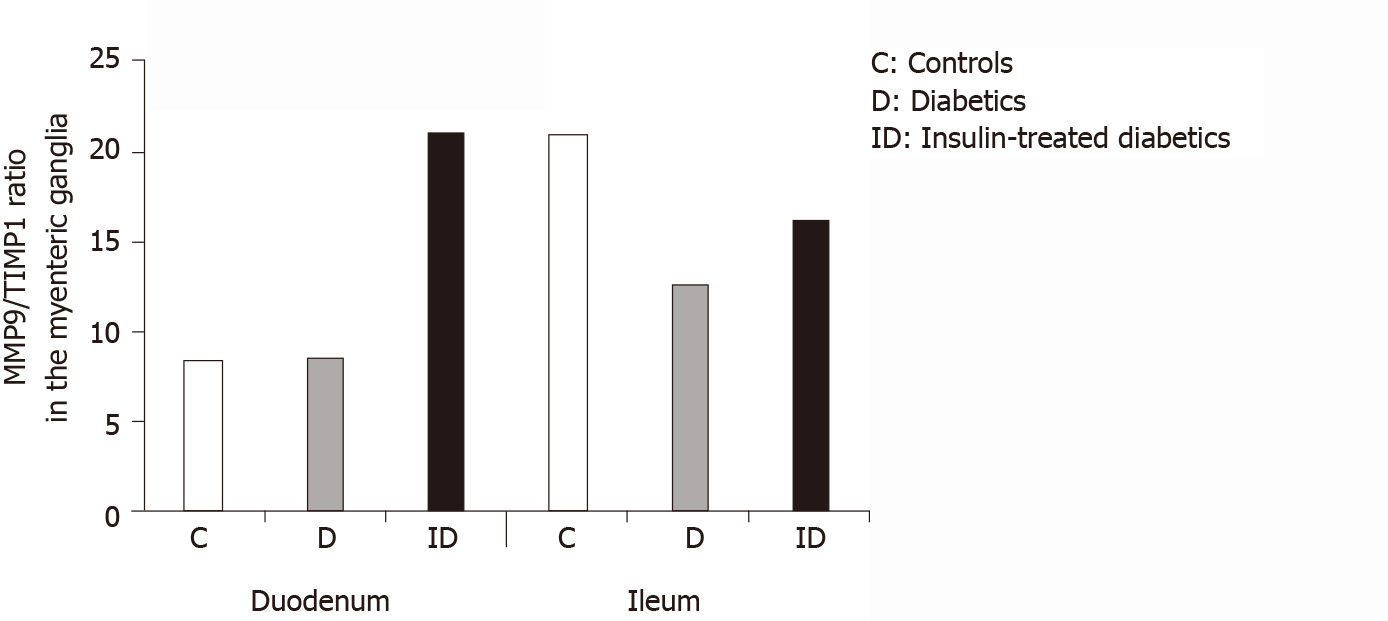
Figure 6 The ratio of matrix metalloproteinase 9 and tissue inhibitor-labeling gold particles in myenteric ganglia of different gut segments of control, diabetic, and insulin-treated diabetic rats.
In diabetic rats, the matrix metalloproteinase 9/tissue inhibitor of metalloproteinase 1 ratio was not altered in duodenal, but was markedly decreased in ileal ganglia. The immediate insulin replacement did not restore the equilibrium ratio observed in controls.
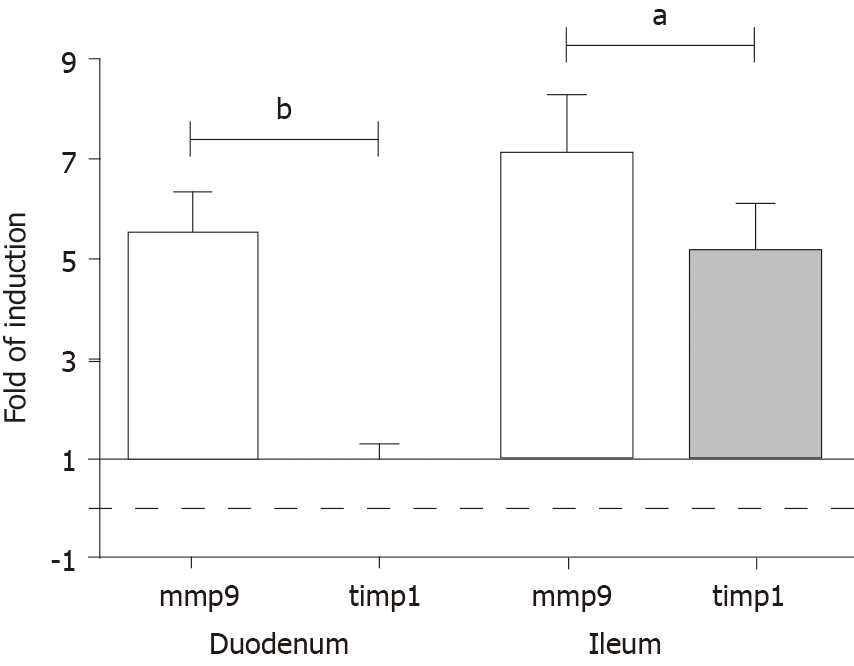
Figure 7 Fold change in the messenger ribonucleic acid levels of matrix metalloproteinase 9 and tissue inhibitor of metalloproteinase 1 genes, measured by real-time fluorescence-based quantitative polymerase chain reaction using the 2ΔΔCt method.
Data sets are presented as the fold change in gene expression normalized to the endogenous reference (RNA18S) and relative to the untreated controls. Data are expressed as means ± standard deviation. aP < 0.001 and bP < 0.0001.
- Citation: Bódi N, Mezei D, Chakraborty P, Szalai Z, Barta BP, Balázs J, Rázga Z, Hermesz E, Bagyánszki M. Diabetes-related intestinal region-specific thickening of ganglionic basement membrane and regionally decreased matrix metalloproteinase 9 expression in myenteric ganglia. World J Diabetes 2021; 12(5): 658-672
- URL: https://www.wjgnet.com/1948-9358/full/v12/i5/658.htm
- DOI: https://dx.doi.org/10.4239/wjd.v12.i5.658


