Copyright
©The Author(s) 2021.
World J Diabetes. Apr 15, 2021; 12(4): 466-479
Published online Apr 15, 2021. doi: 10.4239/wjd.v12.i4.466
Published online Apr 15, 2021. doi: 10.4239/wjd.v12.i4.466
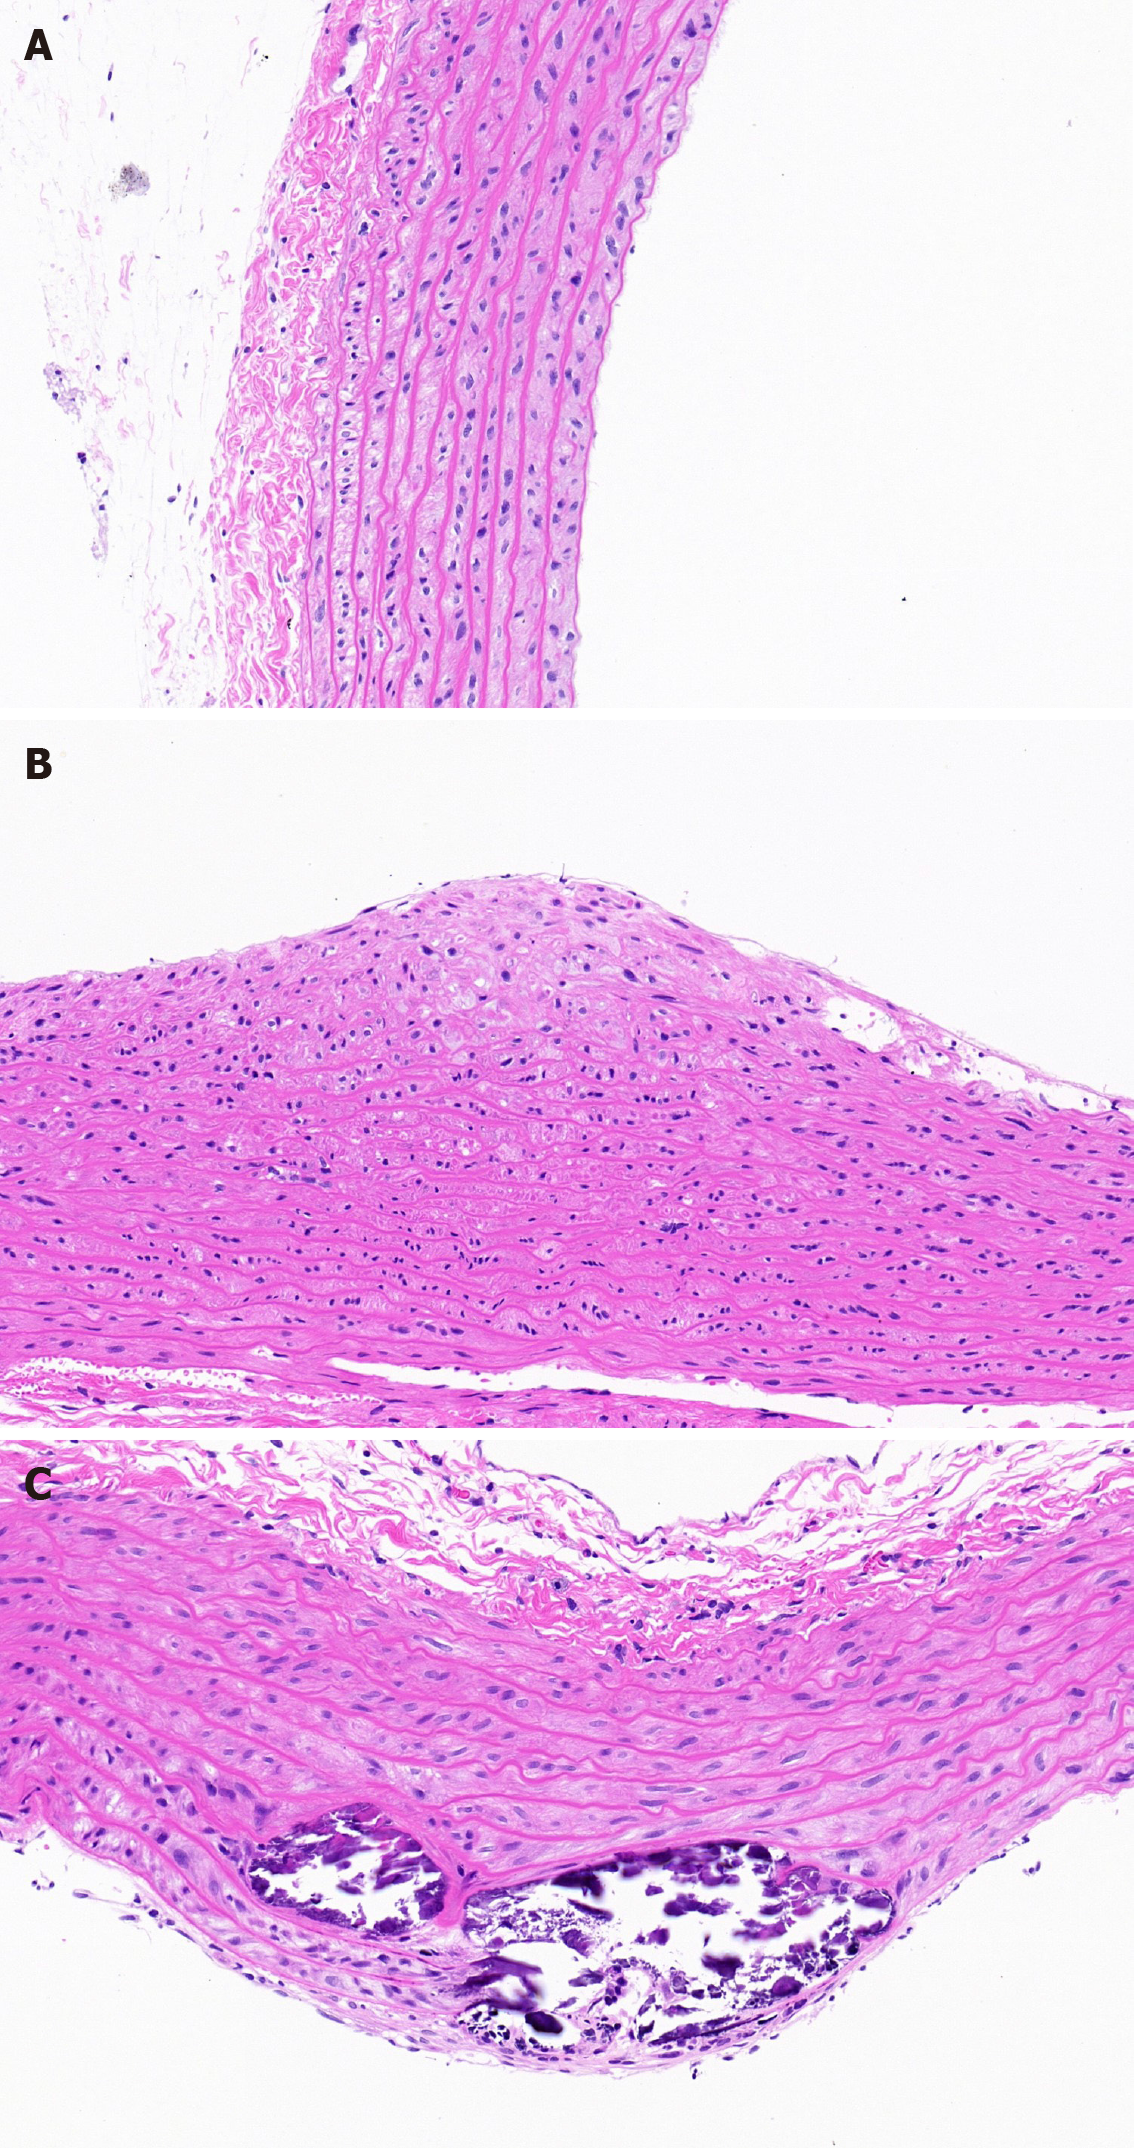
Figure 1 Thoracic aorta (hematoxylin and eosin staining).
A: The vessel had no obvious intimal thickening and lumen stenosis in the control group; B: The intima became thicker and the structure and arrangement of vascular smooth muscle cells were disordered in the diabetic rat group; C: The lumen became narrower and a large number of vascular smooth muscle cells migrated and proliferated in the diabetic atherosclerotic rat group.
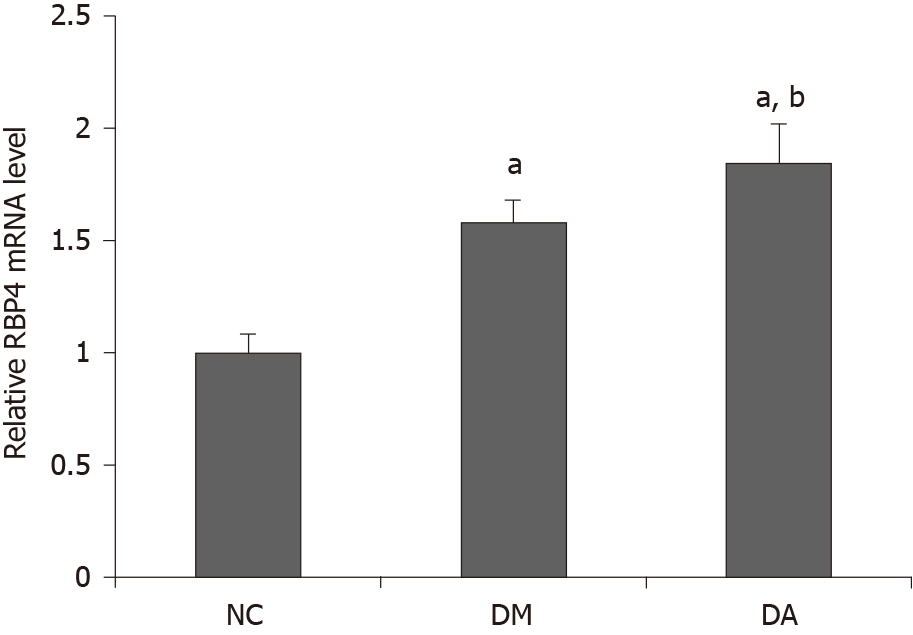
Figure 2 Comparisons of retinol binding protein 4 mRNA expression in each group.
aP < 0.05 vs control group, bP < 0.05 vs diabetic rat group. RBP4: Retinol binding protein 4; NC: Control group; DM: Diabetic rat group; DA: Diabetic atherosclerotic rat group.
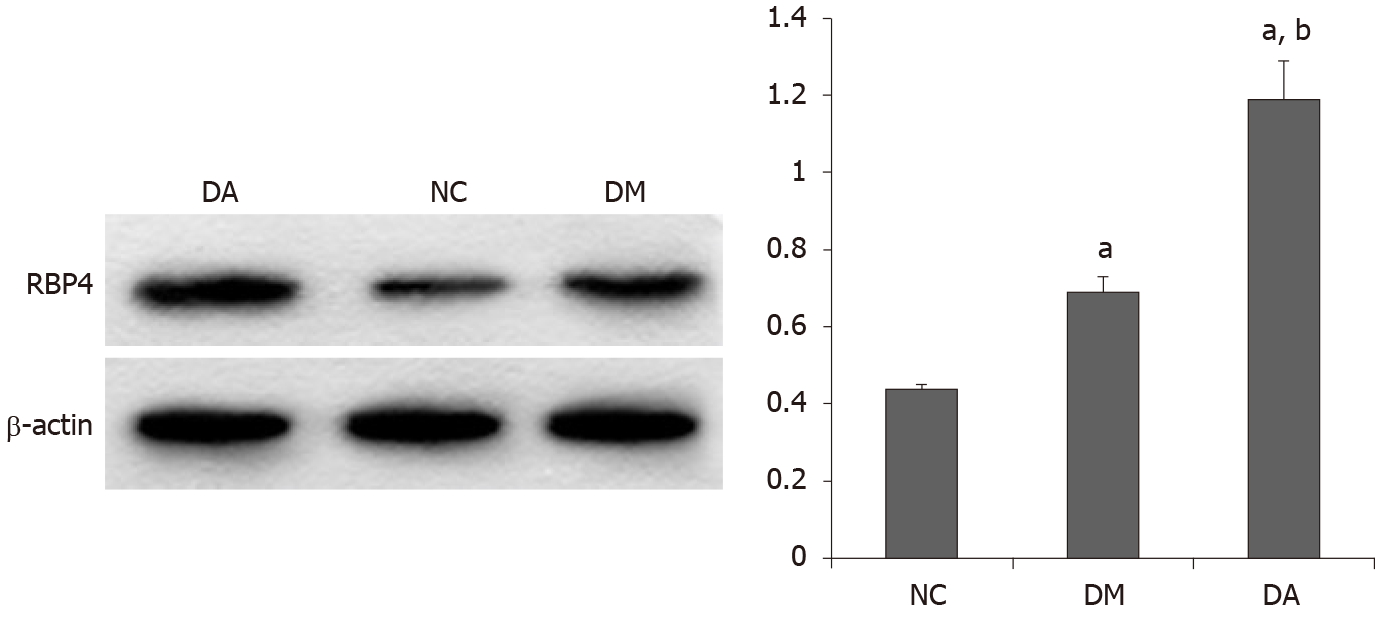
Figure 3 Comparisons of protein expression of retinol binding protein 4 in each group.
aP < 0.05 vs control group, bP < 0.05 vs diabetic rat group. RBP4: Retinol binding protein 4; NC: Control group; DM: Diabetic rat group; DA: Diabetic atherosclerotic rat group.
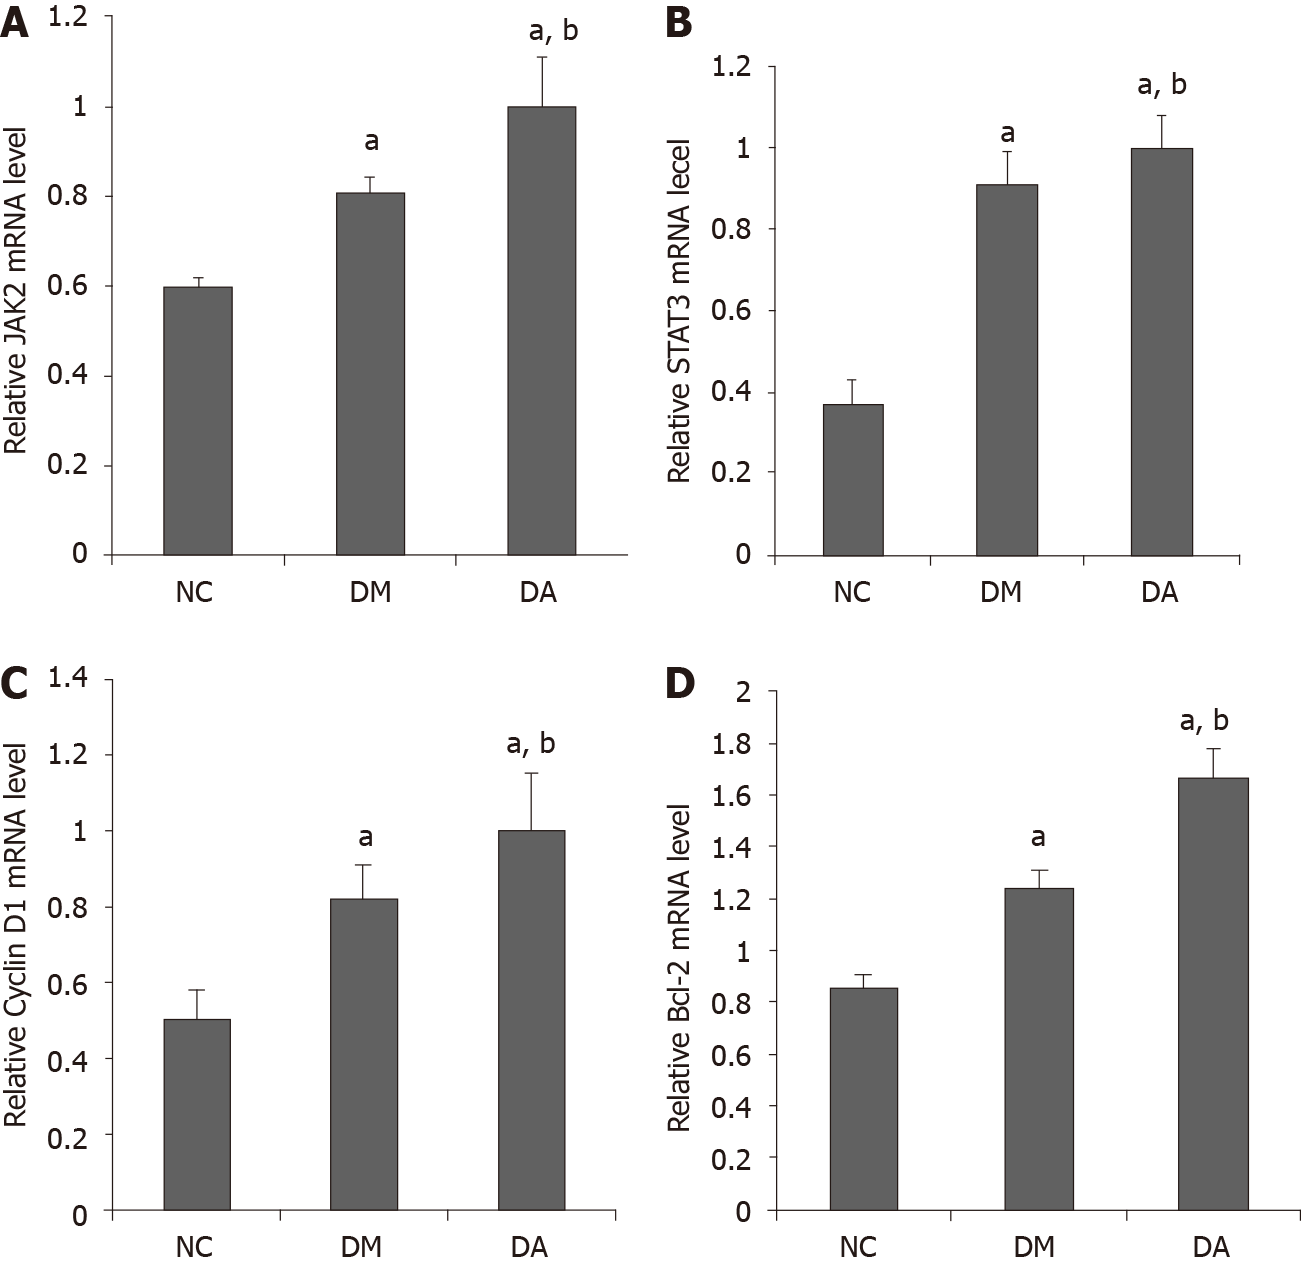
Figure 4 Comparisons of mRNA expression in each group.
A: Janus kinase 2; B: Signal transducer and activator of transcription 3; C: Cylin D1; D: B-cell lymphoma-2. aP < 0.05 vs control group, bP < 0.05 vs diabetic rat group. NC: Control group; DM: Diabetic rat group; DA: Diabetic atherosclerotic rat group; JAK2: Janus kinase 2; STAT3: Signal transducer and activator of transcription 3; Bcl-2: B-cell lymphoma-2.
Figure 5 Comparisons of protein expression in each group.
A: Janus kinase 2 and phosphorylated Janus kinase 2; B: Signal transducer and activator of transcription 3 and phosphorylated signal transducer and activator of transcription 3; C: Cylin D1 and B-cell lymphoma-2. aP < 0.05 vs control group, bP < 0.05 vs diabetic rat group. NC: Control group; DM: Diabetic rat group; DA: Diabetic atherosclerotic rat group; JAK2: Janus kinase 2; P-JAK2: Phosphorylated Janus kinase 2; STAT3: Signal transducer and activator of transcription 3; P-STAT3: Phosphorylated signal transducer and activator of transcription 3; Bcl-2: B-cell lymphoma-2.
Figure 6 Protein expression by immunohistochemistry in each group.
A: Cyclin D1 expression in control group; B: Cyclin D1 expression in diabetic rat group; C: Cyclin D1 expression in diabetic atherosclerotic rat group; D: B-cell lymphoma-2 (Bcl-2) expression in control group; F: Bcl-2 expression in diabetic rat group; G: Bcl-2 expression in diabetic atherosclerotic rat group.
- Citation: Zhou W, Ye SD, Wang W. Elevated retinol binding protein 4 levels are associated with atherosclerosis in diabetic rats via JAK2/STAT3 signaling pathway. World J Diabetes 2021; 12(4): 466-479
- URL: https://www.wjgnet.com/1948-9358/full/v12/i4/466.htm
- DOI: https://dx.doi.org/10.4239/wjd.v12.i4.466


