Copyright
©The Author(s) 2021.
World J Diabetes. Apr 15, 2021; 12(4): 437-452
Published online Apr 15, 2021. doi: 10.4239/wjd.v12.i4.437
Published online Apr 15, 2021. doi: 10.4239/wjd.v12.i4.437
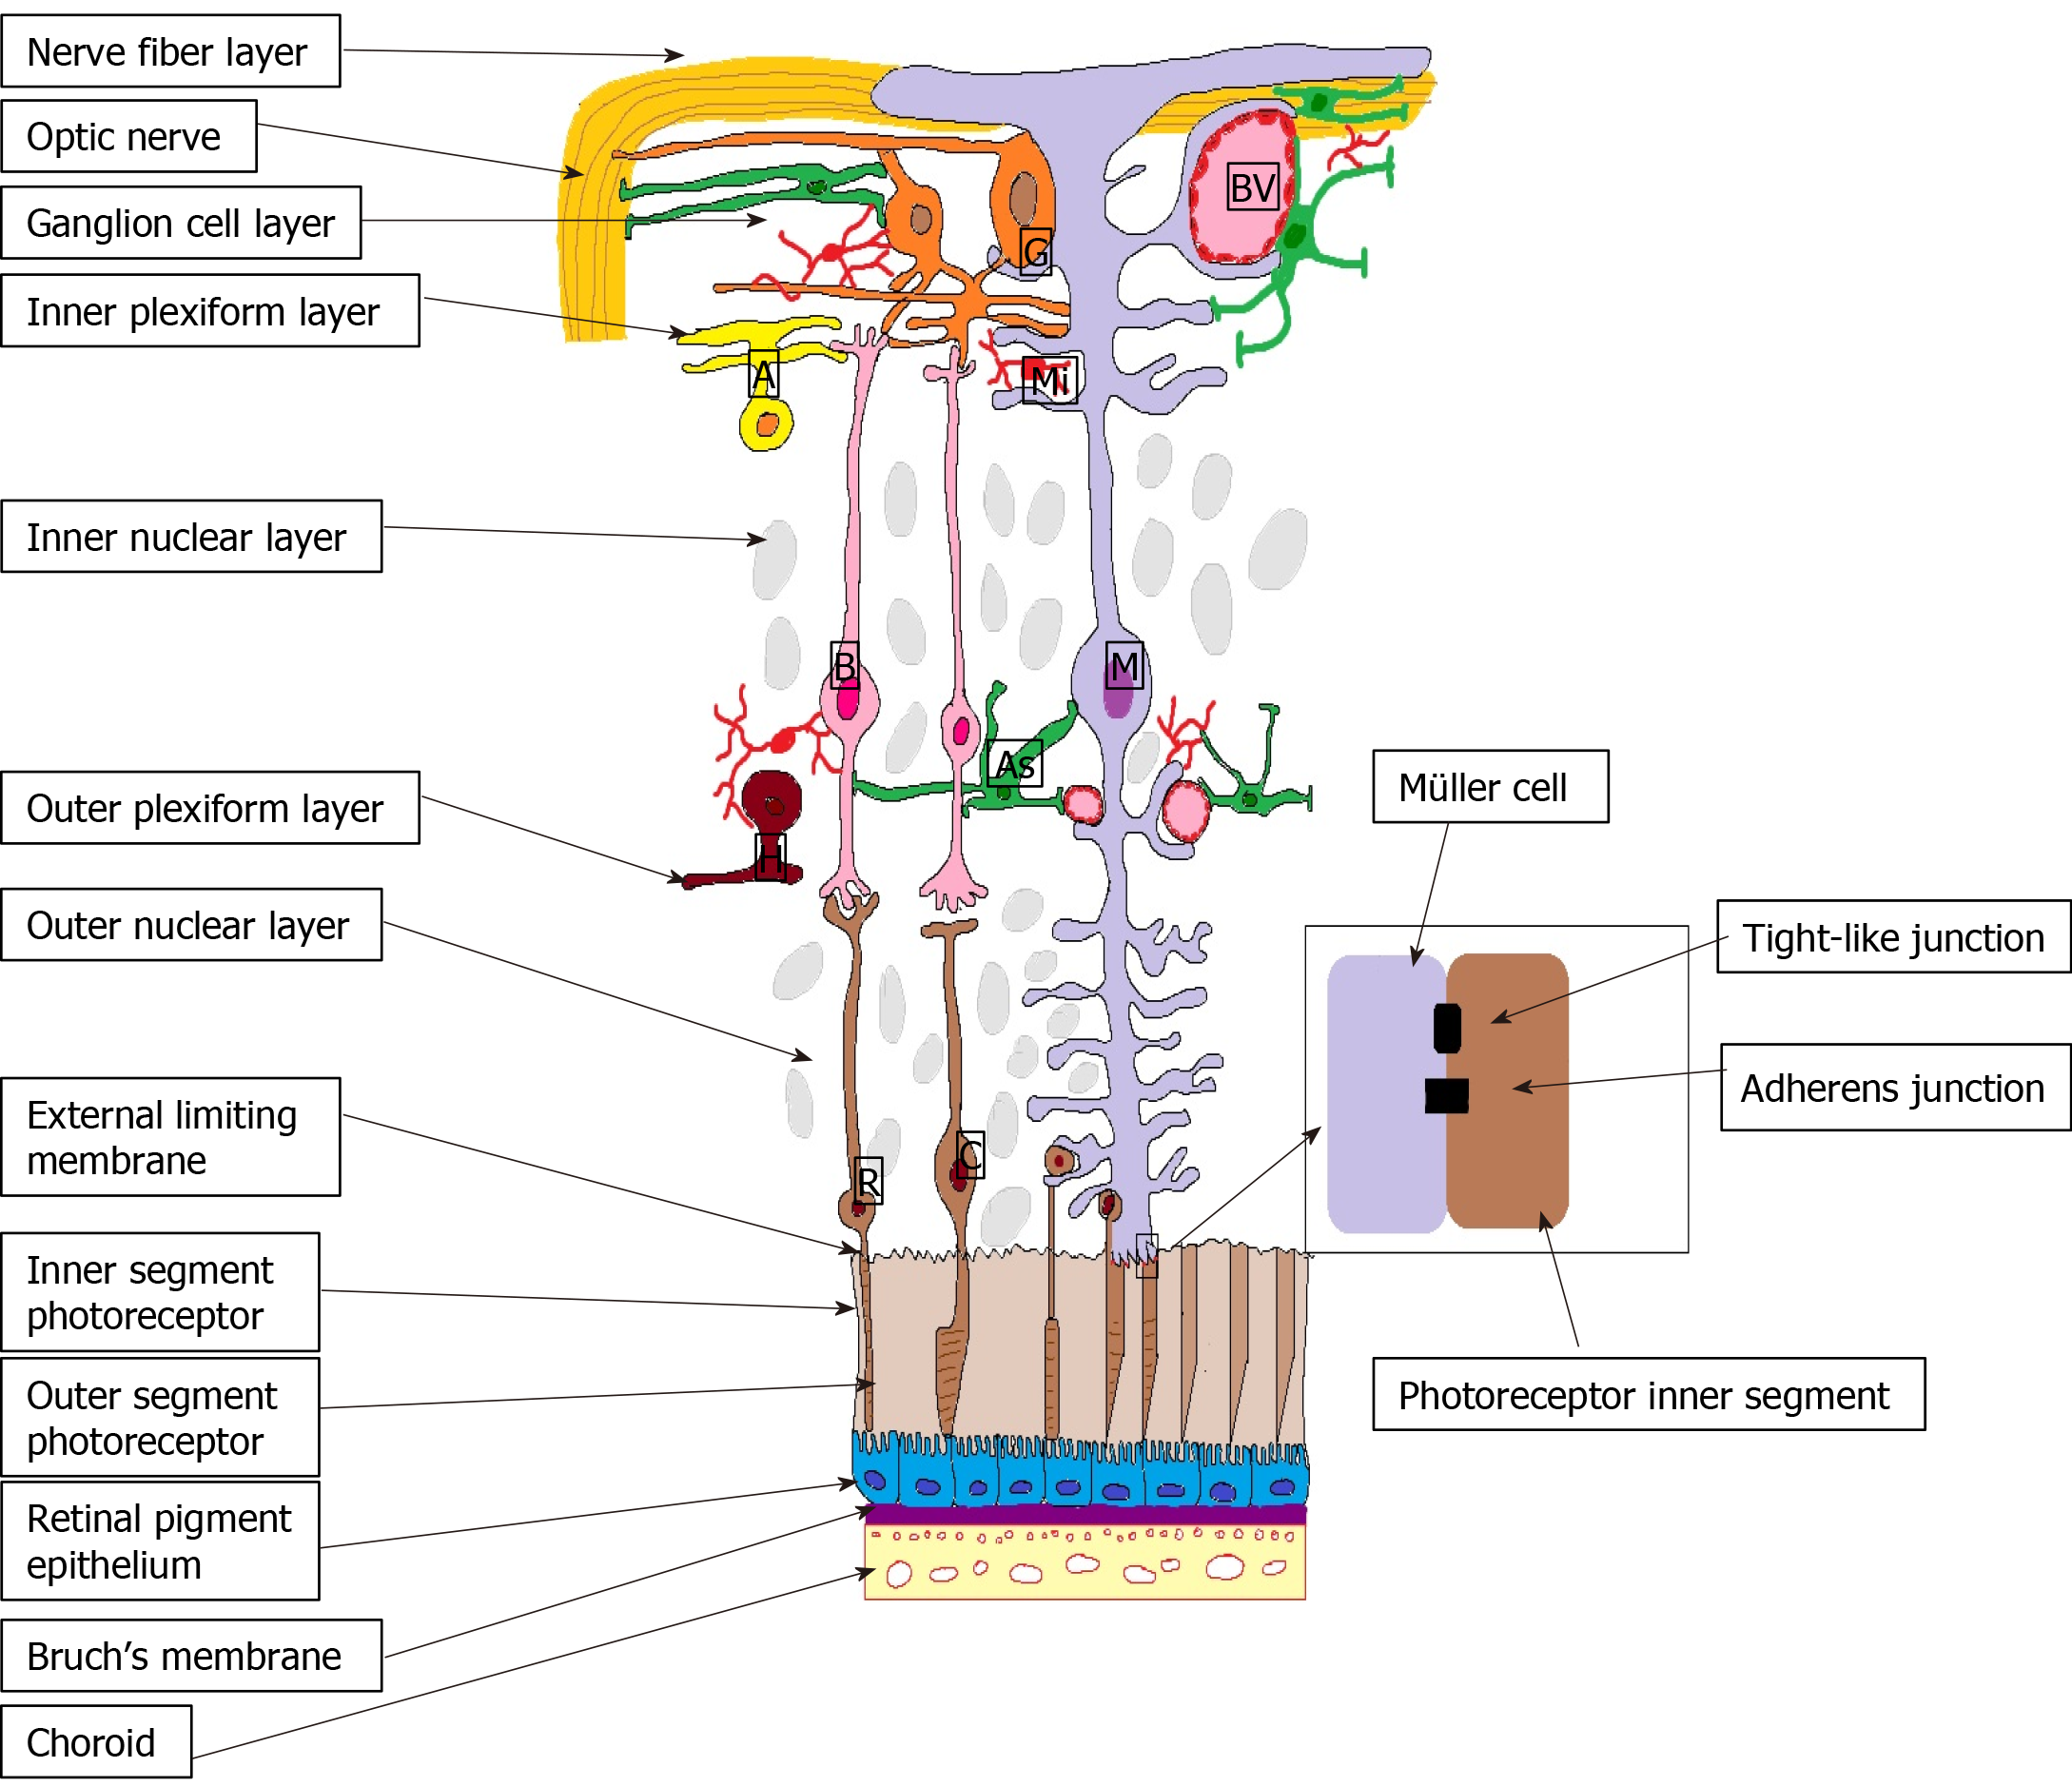
Figure 1 Outer blood-retina barrier.
M: Müller cells; A: Amacrine cells; G: Ganglion cells; BV: Blood vessels; As: Astrocyte; B: Bipolar cells; R: Rods; C: Cones; H: Horizontal cells; Mi: Microglia; ON: Optic nerve; NFL: Nerve fibre layer; GCL: Ganglion cell layer; IPL: Inner plexiform layer; INL: Inner nuclear layer; OPL: Outer plexiform layer; ONL: Outer nuclear layer; ELM: External limiting membrane; IS: Inner segment photoreceptors; OS: Outer segment photoreceptors; RPE: Retinal pigment epithelium; BM: Bruch’s Membrane; Ch: Choroid.
Figure 2 External limiting membrane.
M: Müller cells; A: Amacrine cells; G: Ganglion cells; BV: Blood vessels; As: Astrocyte; B: Bipolar cells; R: Rods; C: Cones; H: Horizontal cells; Mi: Microglia; ON: Optic nerve; NFL: Nerve fibre layer; GCL: Ganglion cell layer; IPL: Inner plexiform layer; INL: Inner nuclear layer; OPL: Outer plexiform layer; ONL: Outer nuclear layer; ELM: External limiting membrane; IS: Inner segment photoreceptors; OS: Outer segment photoreceptors; RPE: Retinal pigment epithelium; BM: Bruch’s Membrane; Ch: Choroid.
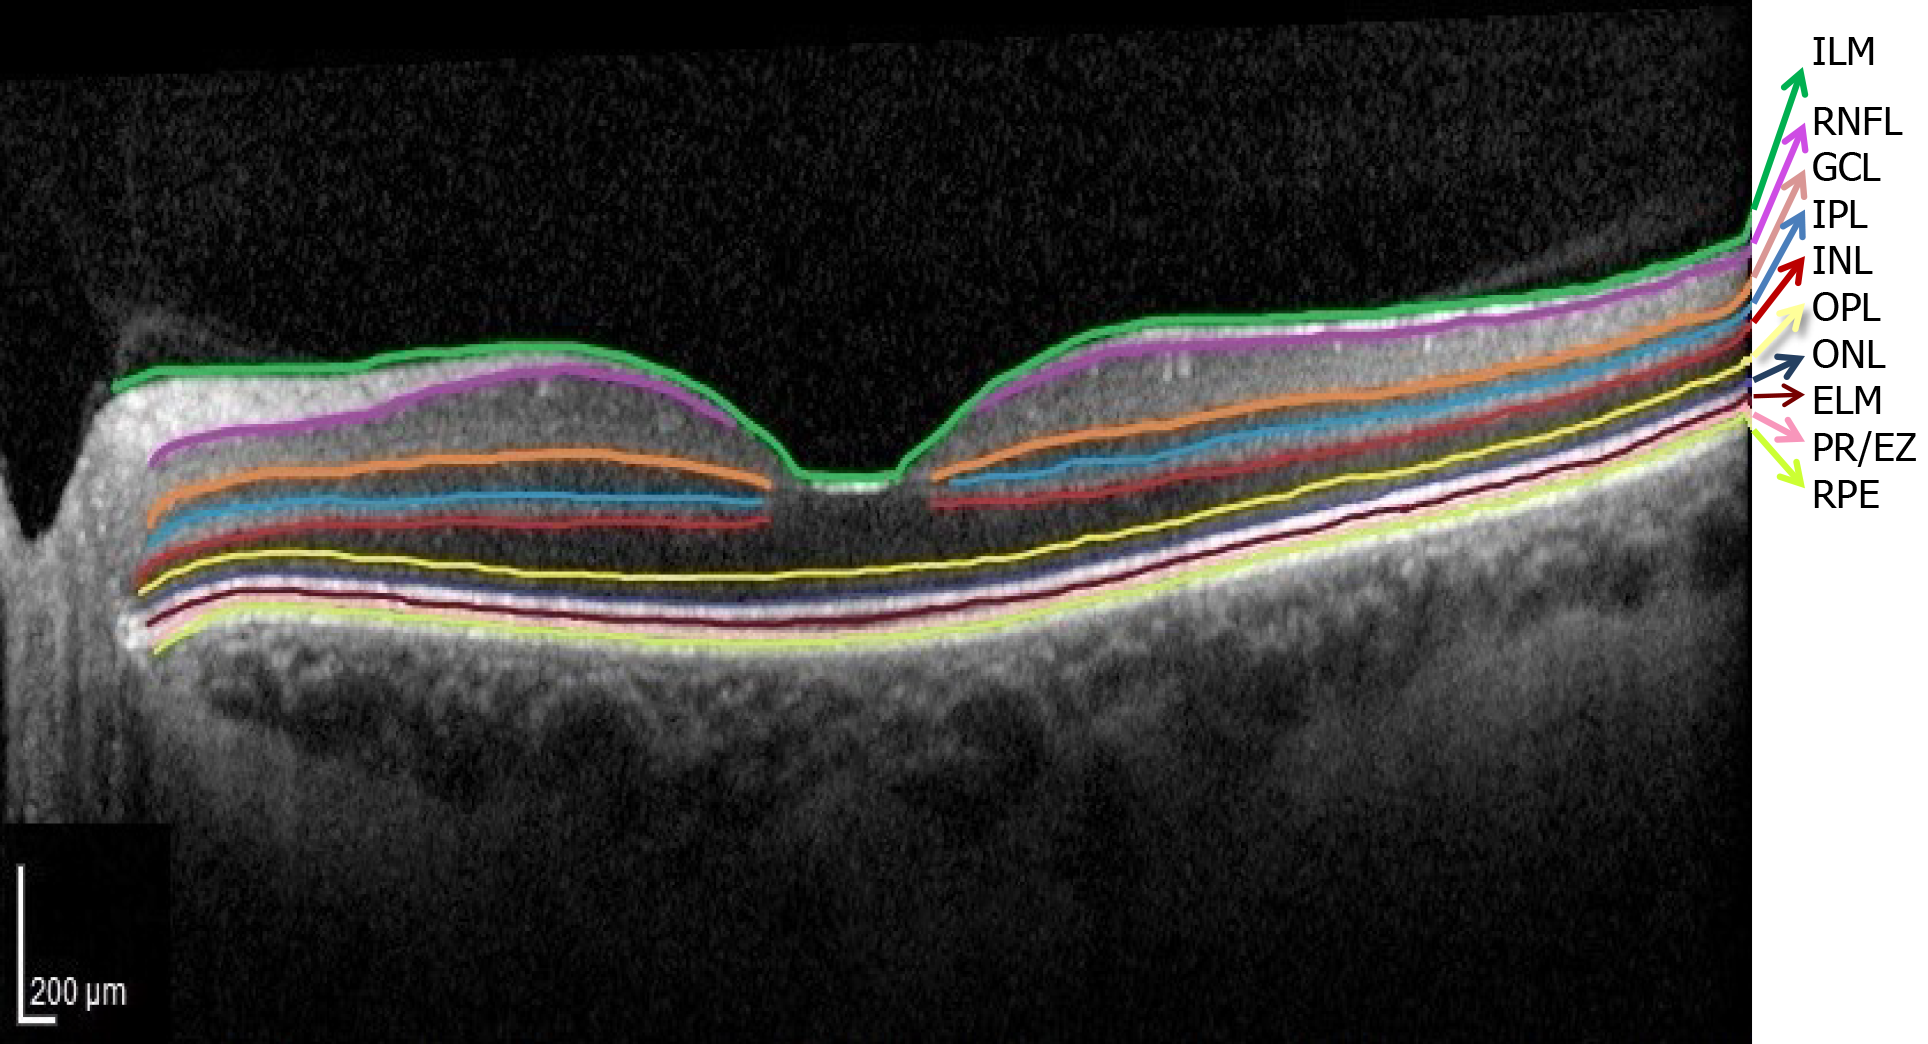
Figure 3 Normal optical coherence tomography aspect of the retinal layers.
Segmentation software automatically marked the 10 retinal layers. (ILM: Internal limiting membrane; RNFL: Retinal nerve fiber layer; GCL: Ganglion cell layer; IPL: Inner plexiform layer; INL: Inner nuclear layer; OPL: Outer plexiform layer; ONL: Outer nuclear layer; ELM: External limiting membrane; PR/EZ: Photoreceptor layer/ellipsoid zone (inner and outer photoreceptor segment junction; RPE: Retinal pigment epithelium).
Figure 4 Serous retinal detachment type of diabetic macular edema.
A: Optical coherence tomography (OCT)-Retinal neurosensory detachment; B: Highlighted OCT image showing the neurosensory detachment (red).
Figure 5 Hyperreflective foci.
A: Original optical coherence tomography (OCT) image; B: Highlighted OCT image revealing hyperreflective foci (red).
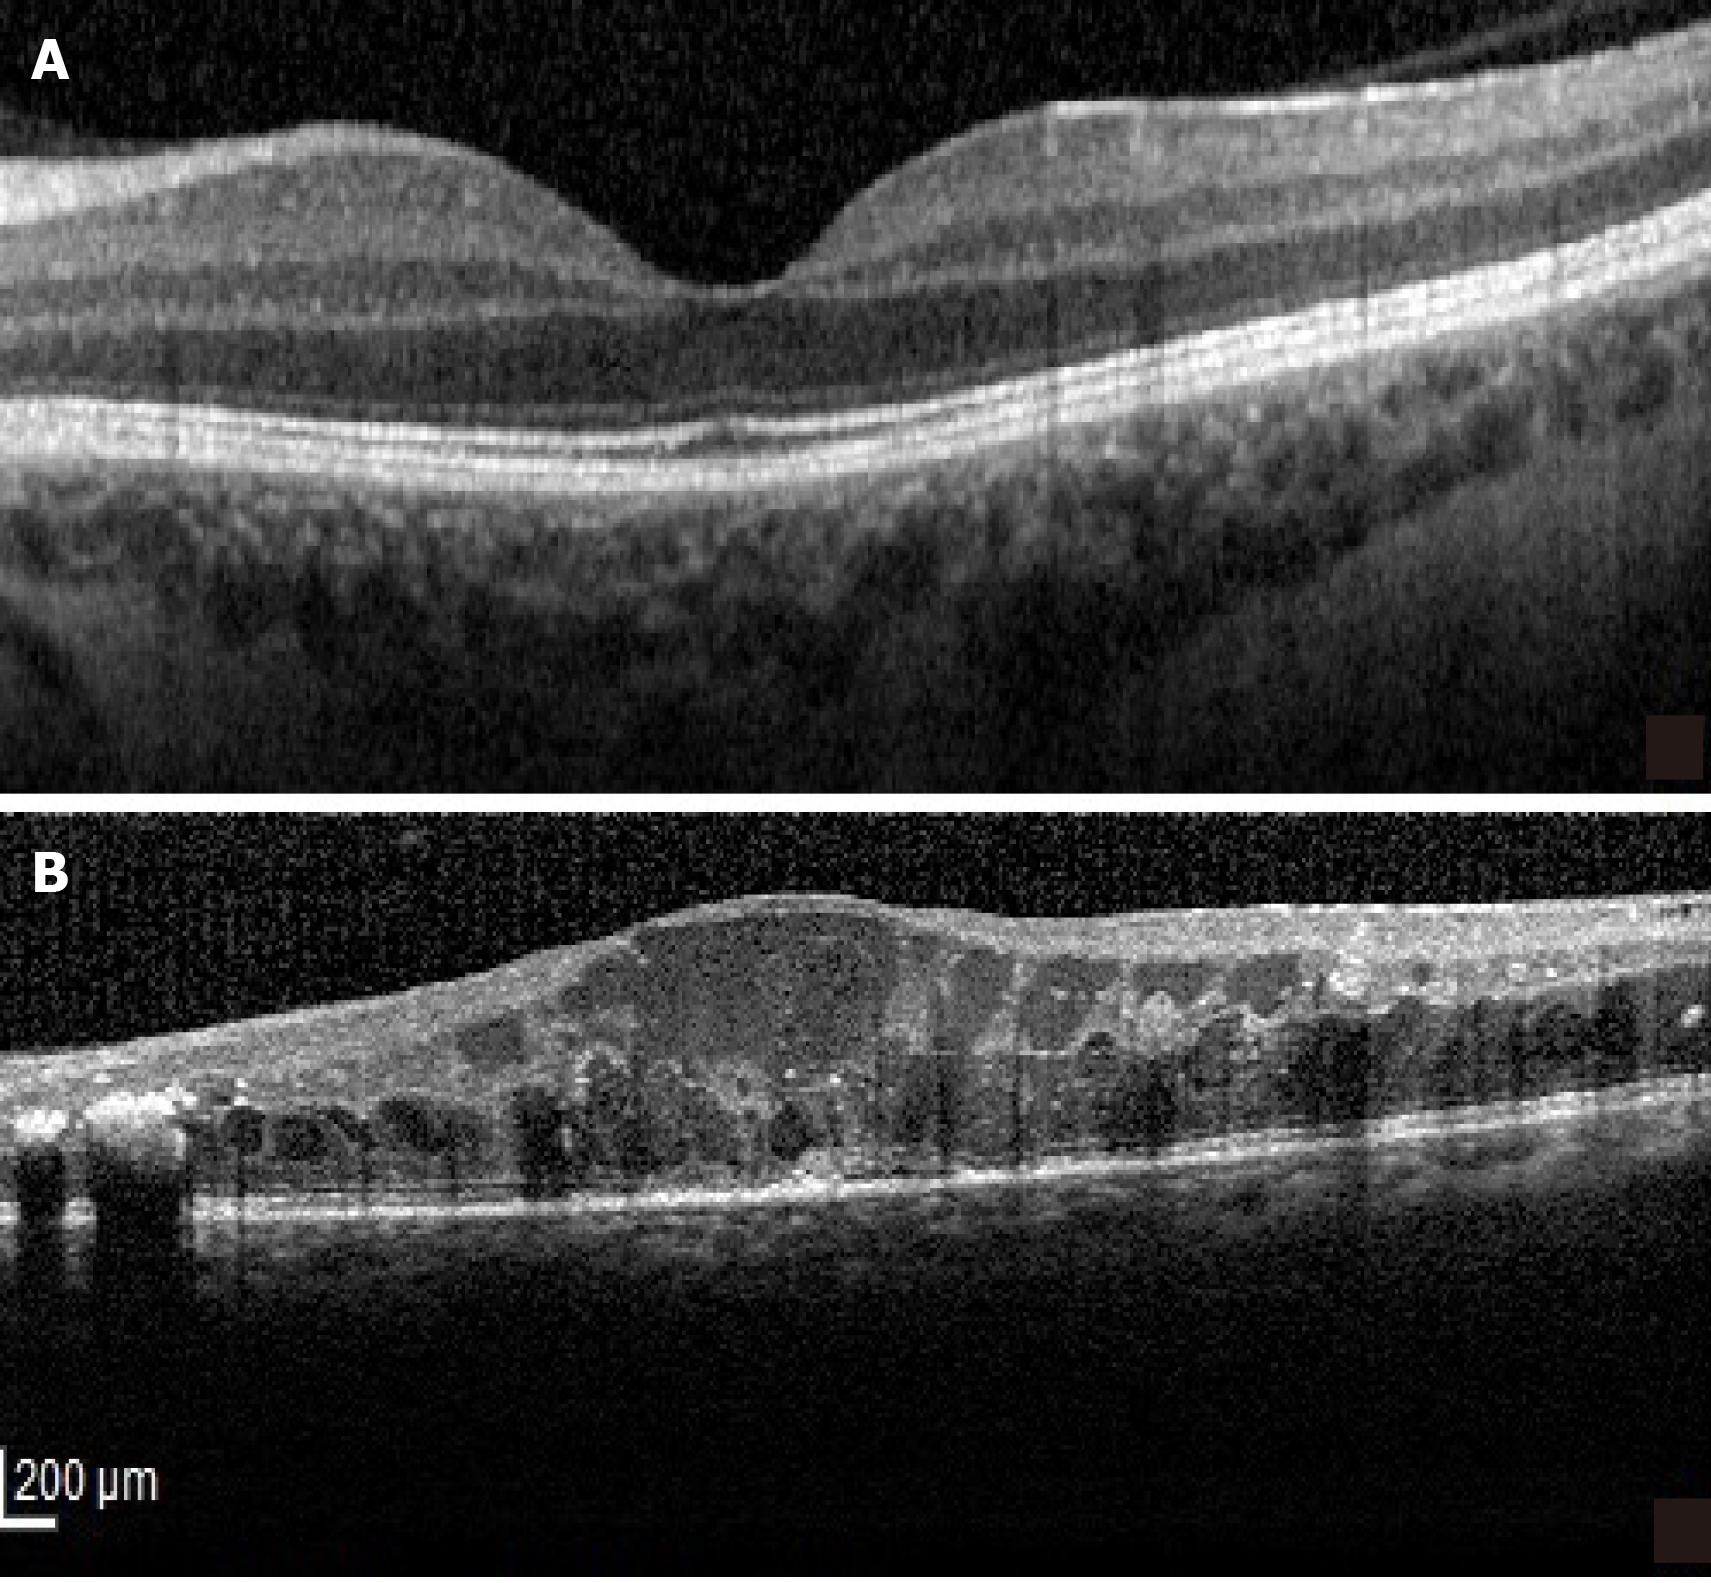
Figure 6 Disorganization of the inner retinal layers.
A: Normal optical coherence tomography aspect of the macula; B: Disorganization of the inner retinal layers.
- Citation: Ţălu Ş, Nicoara SD. Malfunction of outer retinal barrier and choroid in the occurrence and progression of diabetic macular edema . World J Diabetes 2021; 12(4): 437-452
- URL: https://www.wjgnet.com/1948-9358/full/v12/i4/437.htm
- DOI: https://dx.doi.org/10.4239/wjd.v12.i4.437


