Copyright
©The Author(s) 2020.
World J Diabetes. Sep 15, 2020; 11(9): 374-390
Published online Sep 15, 2020. doi: 10.4239/wjd.v11.i9.374
Published online Sep 15, 2020. doi: 10.4239/wjd.v11.i9.374
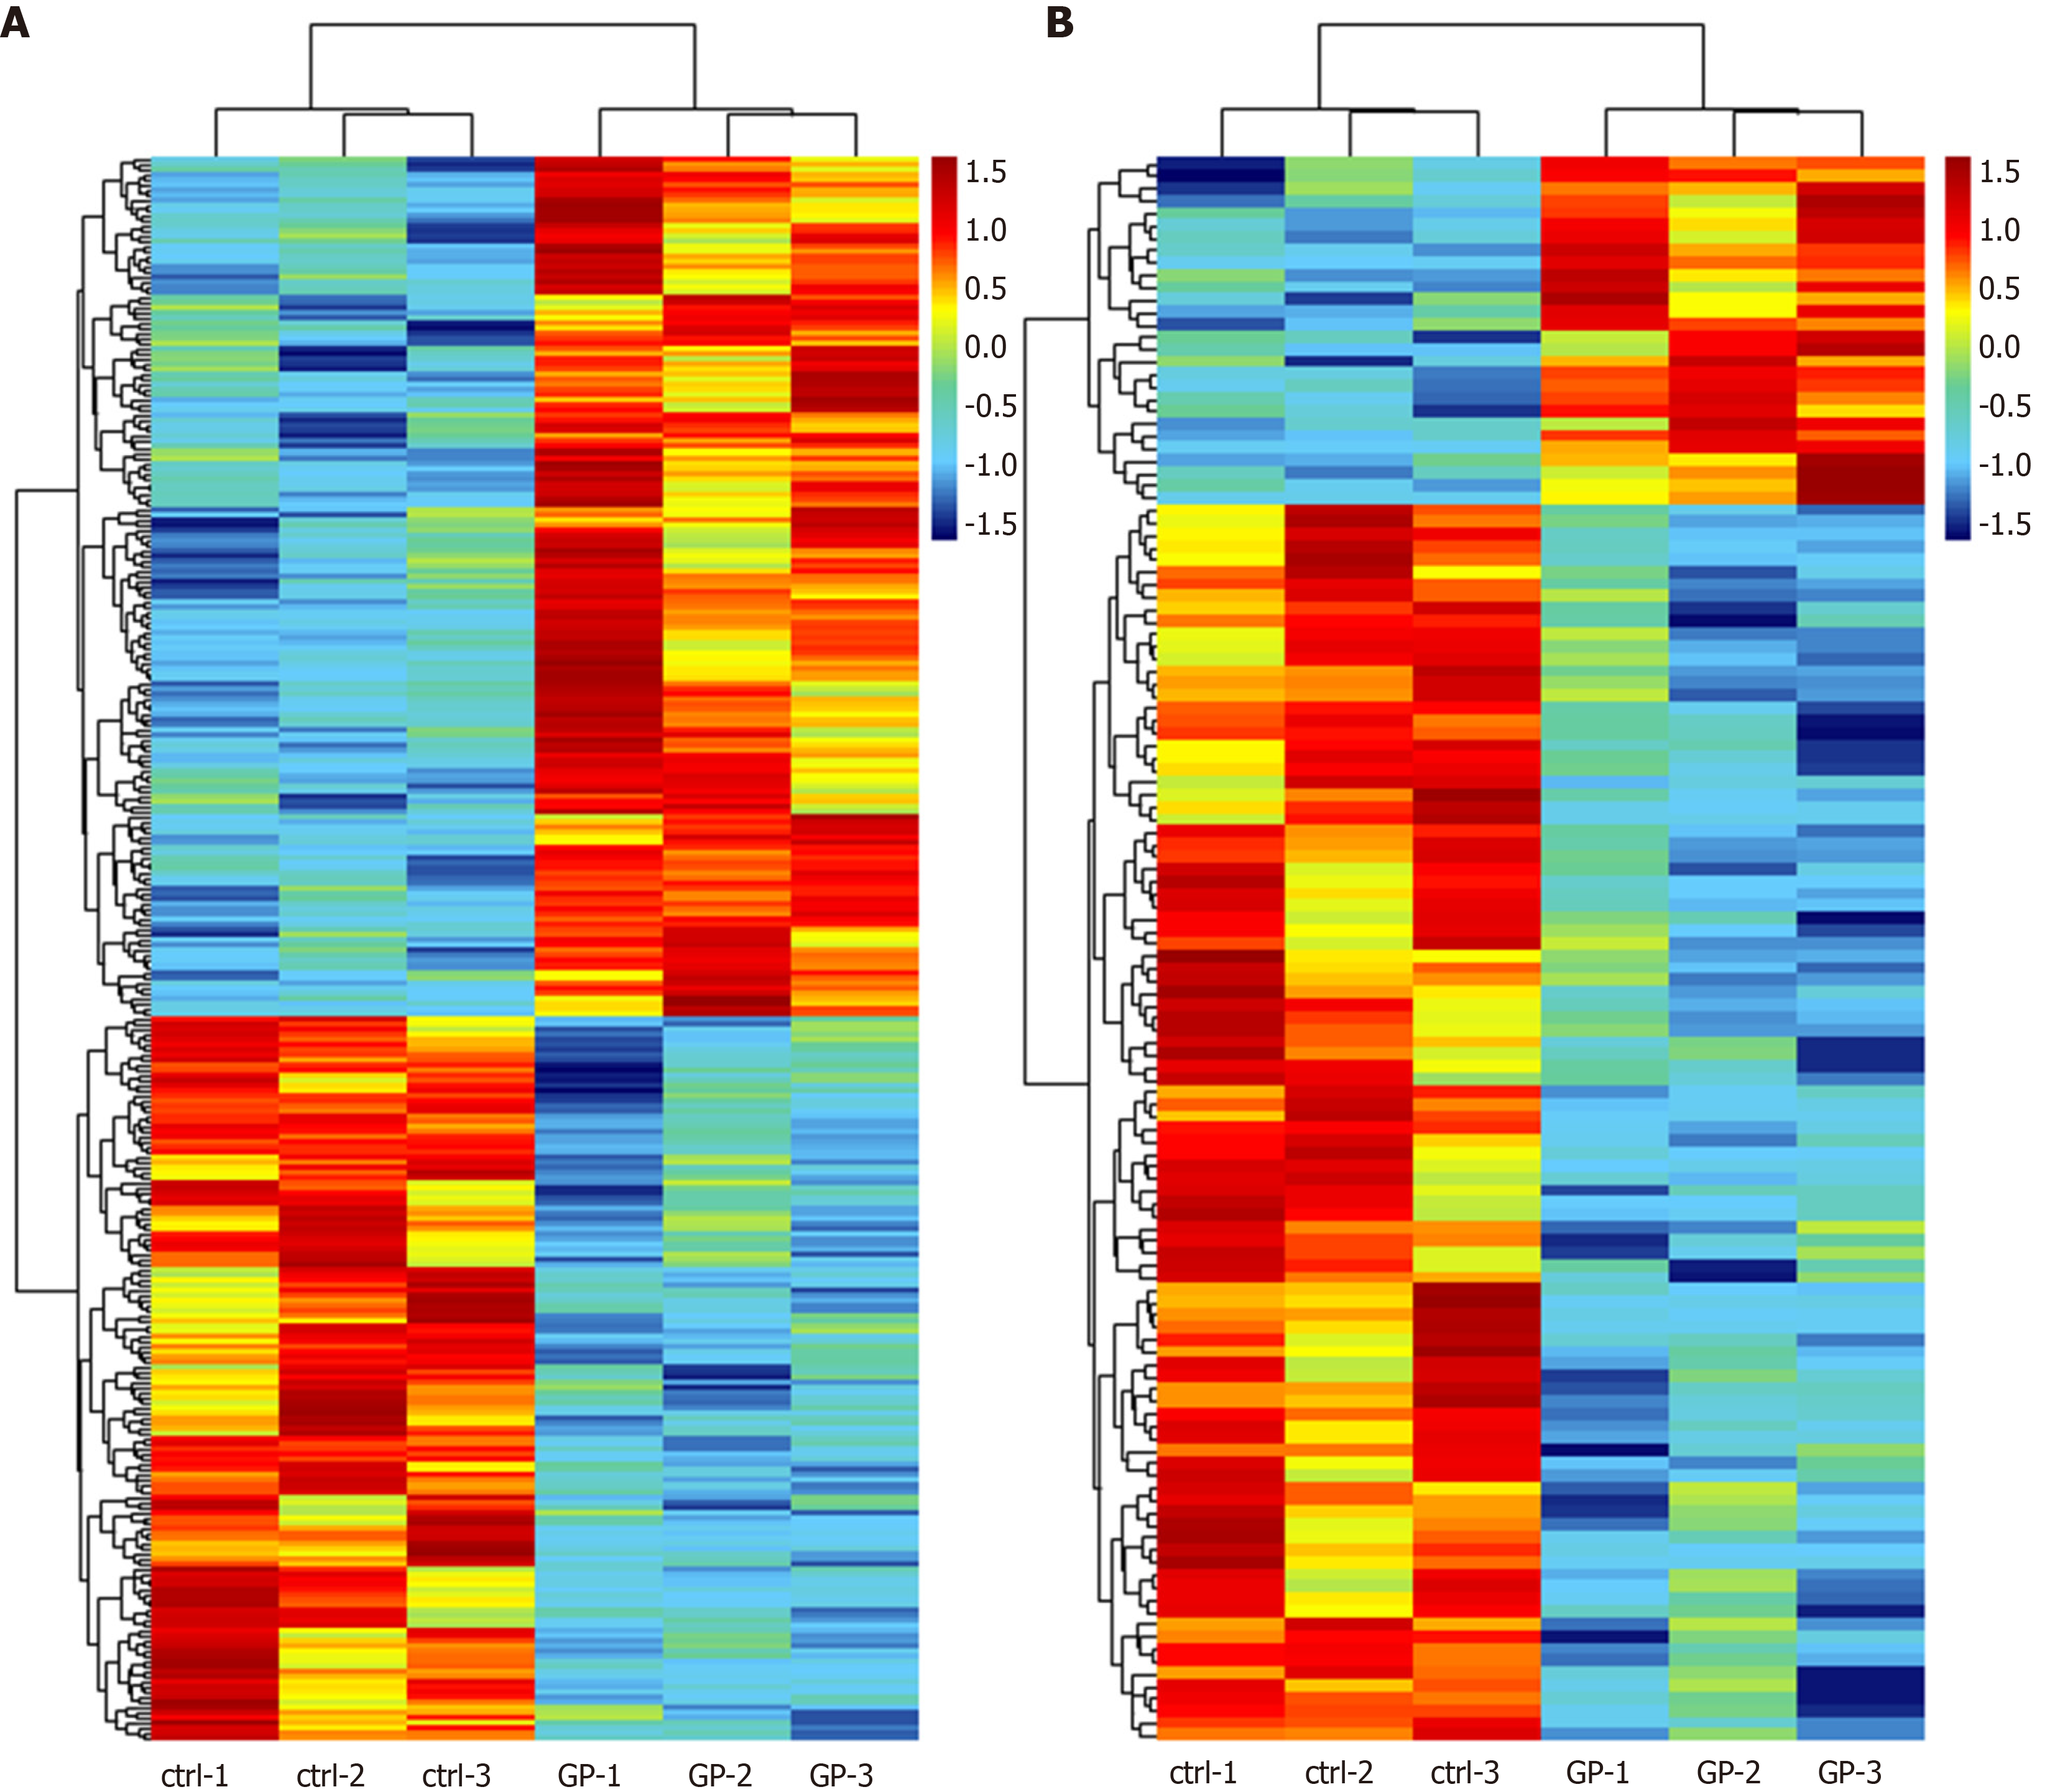
Figure 1 Heatmap of differentially expressed long noncoding RNAs (A) and mRNAs (B).
A: A total of 167 upregulated and 141 downregulated long noncoding RNAs were identified in the geniposide-treated group (GP1 to GP3) compared to the control group (ctrl-1 to ctrl-3) with fold change filter set at ≥ 1.5 and P value < 0.05. B: A total of 28 upregulated and 100 downregulated mRNAs were identified with the same filter settings.
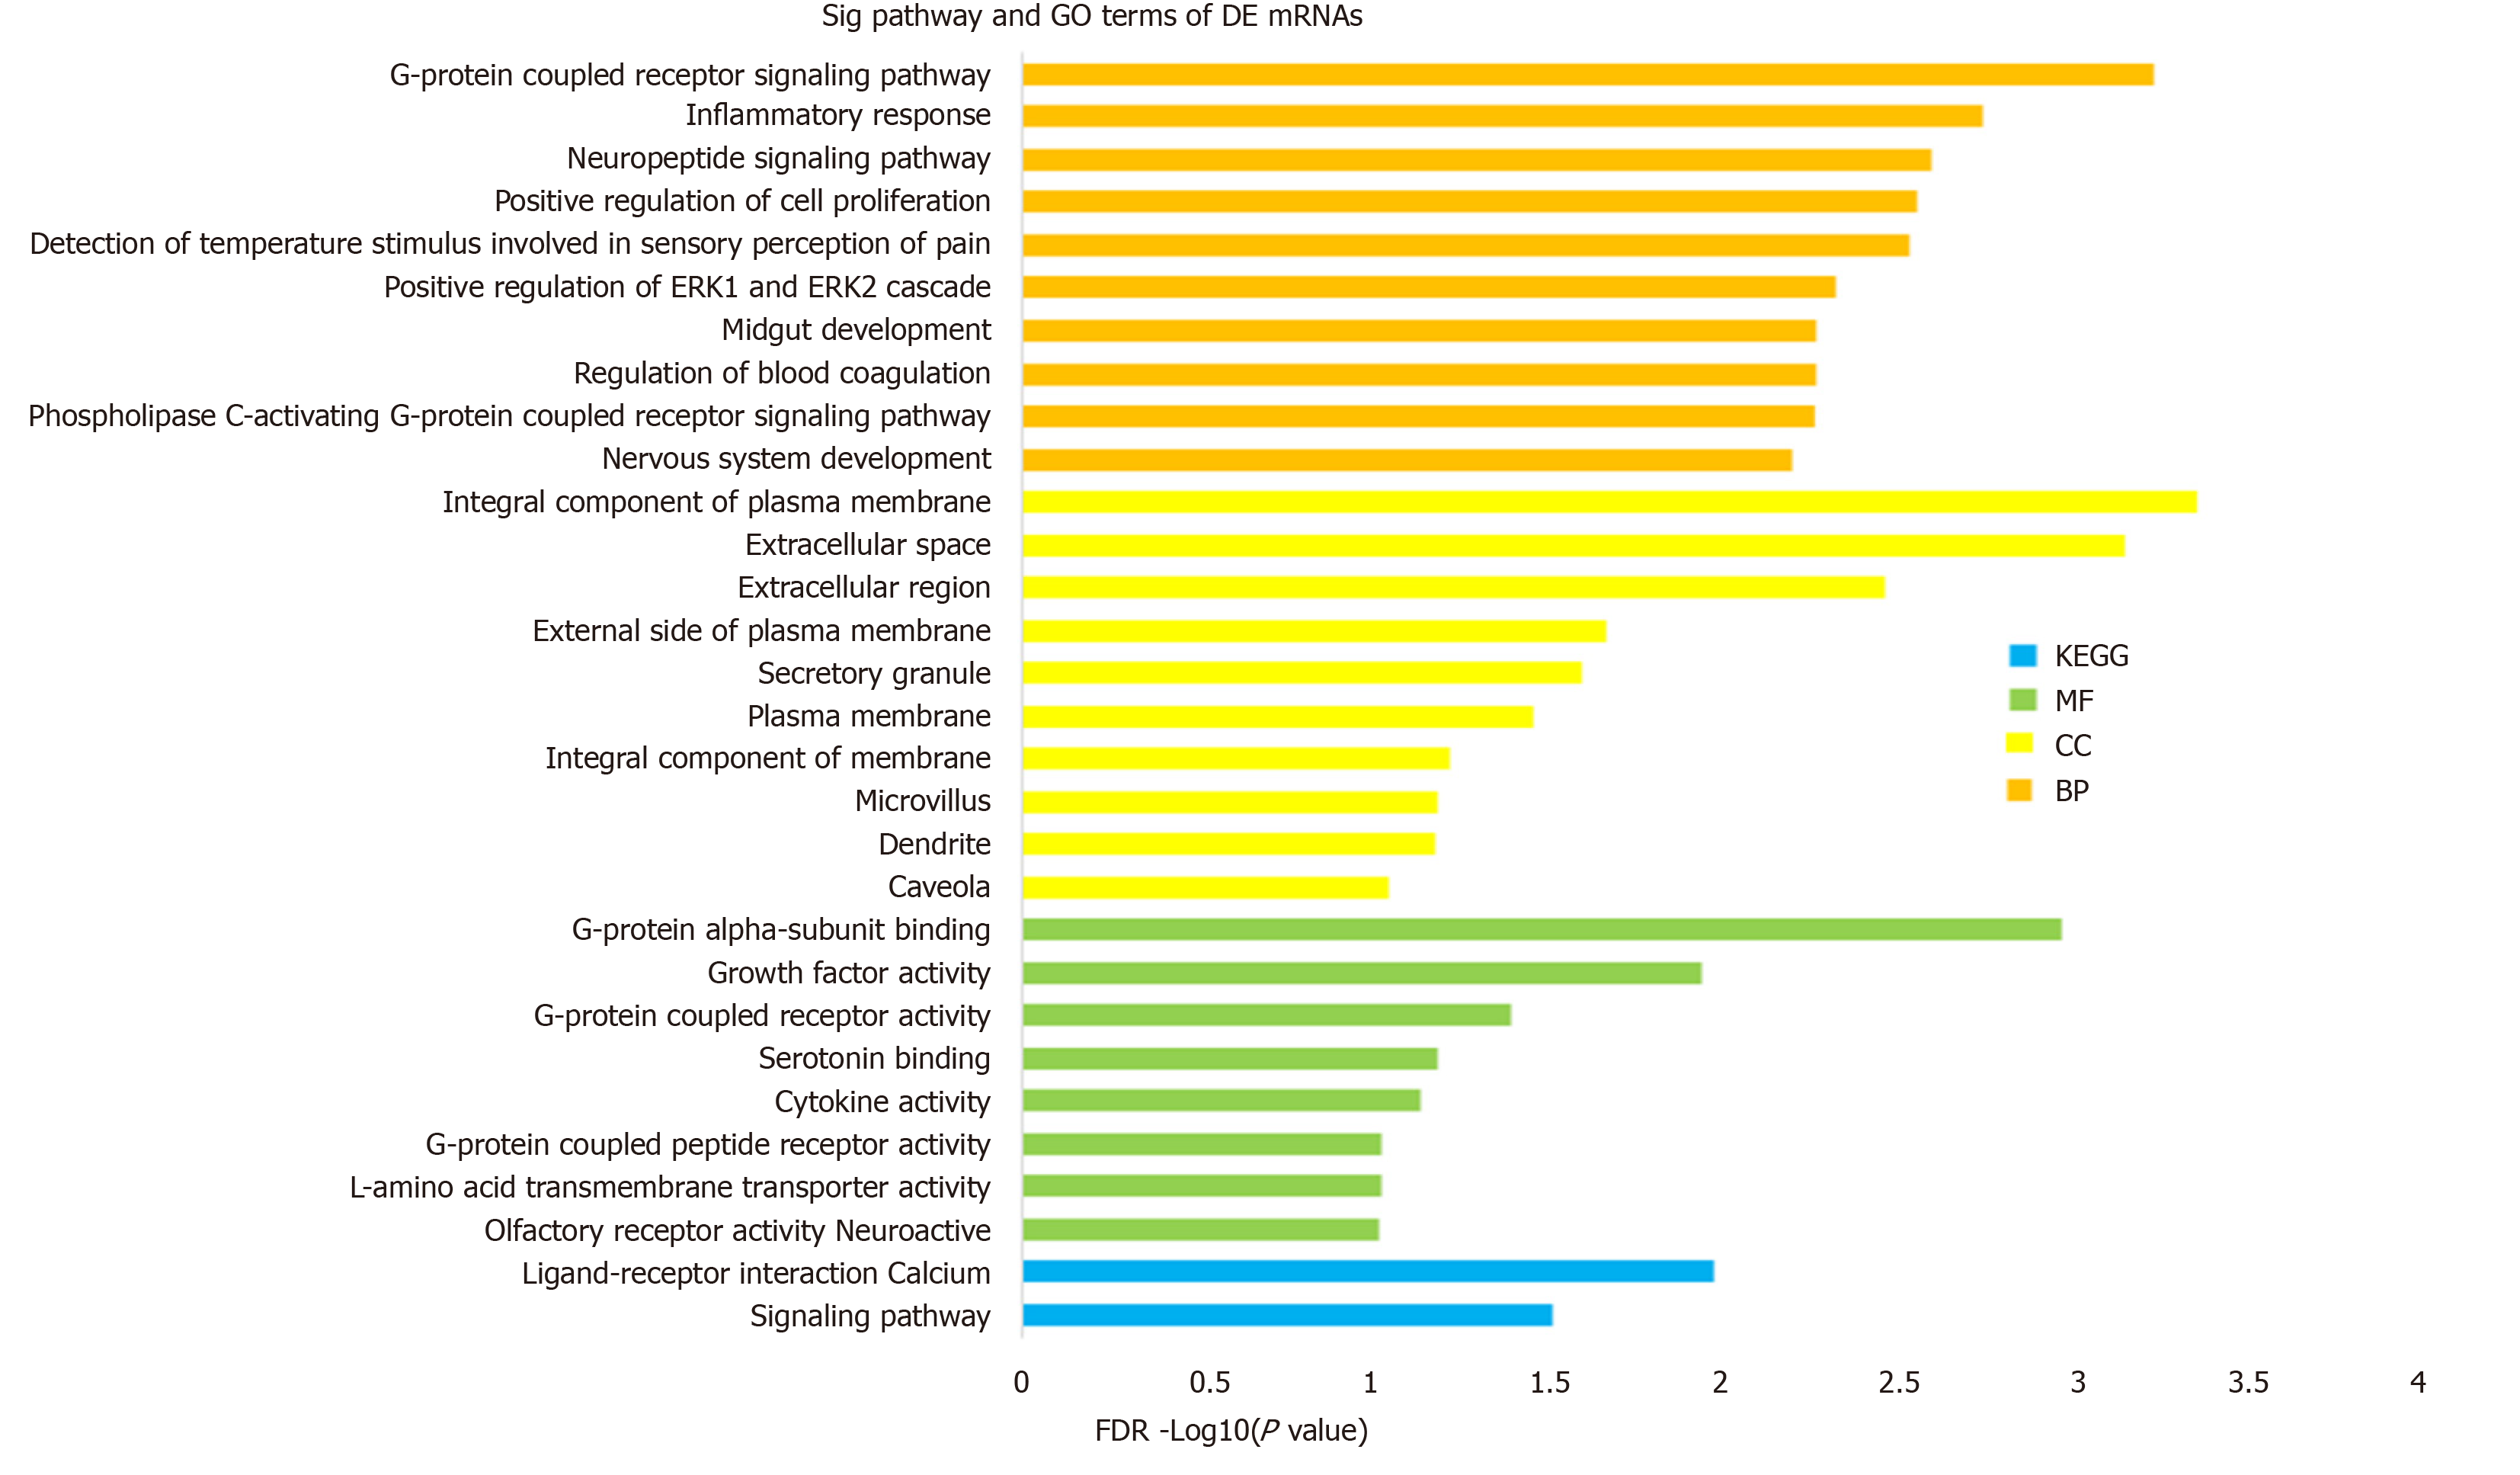
Figure 2 Gene ontology and Kyoto Encyclopedia of Genes and Genomes pathway enrichment of differentially expressed mRNAs.
Gene Ontology (GO) analysis can be divided into three parts: Molecular function, biological process, and cellular component, which respectively describe the molecular functions of potential gene products, the biological processes involved, and the cellular environments in which they are located. Enrichment analysis was performed via the DAVID 6.8 database. The enriched terms of GO and Kyoto Encyclopedia of Genes and Genomes pathway analysis are arranged in descending order according to -log10 (P value). BP: Biological process; MF: Molecular function; CC: Cellular component; KEGG: Kyoto Encyclopedia of Genes and Genomes.
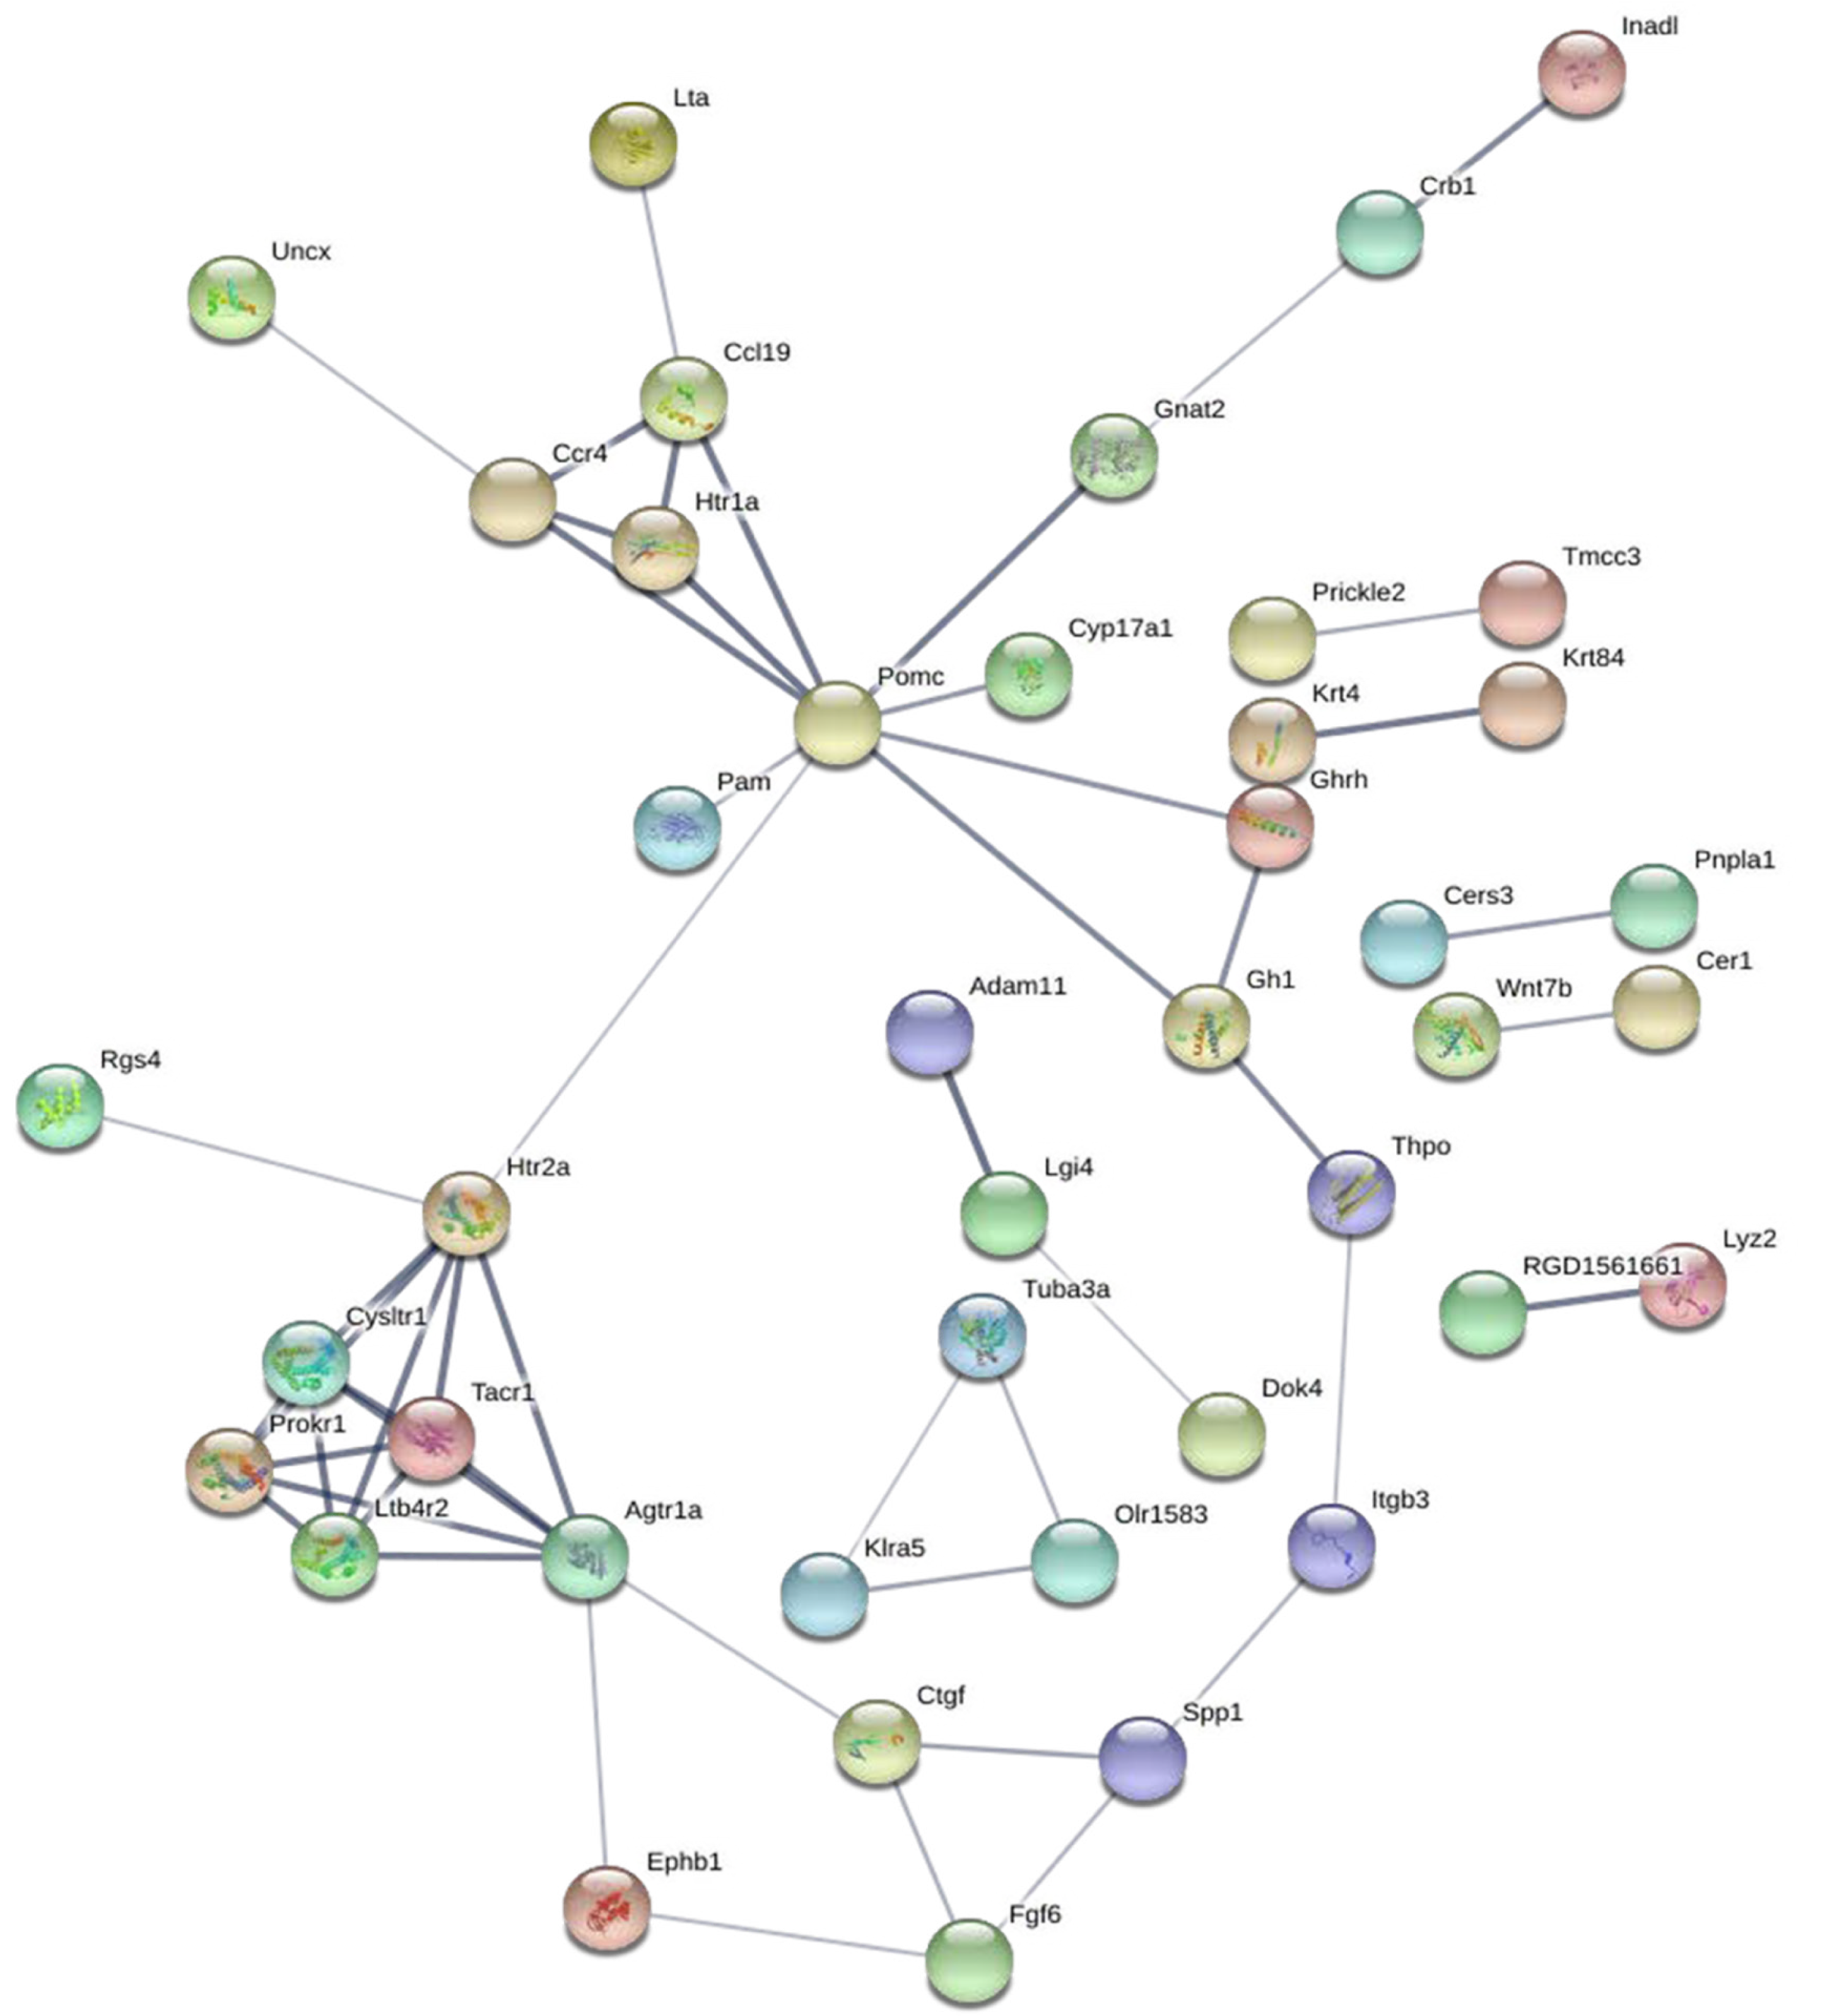
Figure 3 Protein-protein interaction network of differentially expressed mRNAs.
The protein-protein interaction network was constructed through the STRING database for all differentially expressed mRNAs that were enriched in the Gene Ontology and Kyoto Encyclopedia of Genes and Genomes terms. This network includes 120 nodes and 52 edges.
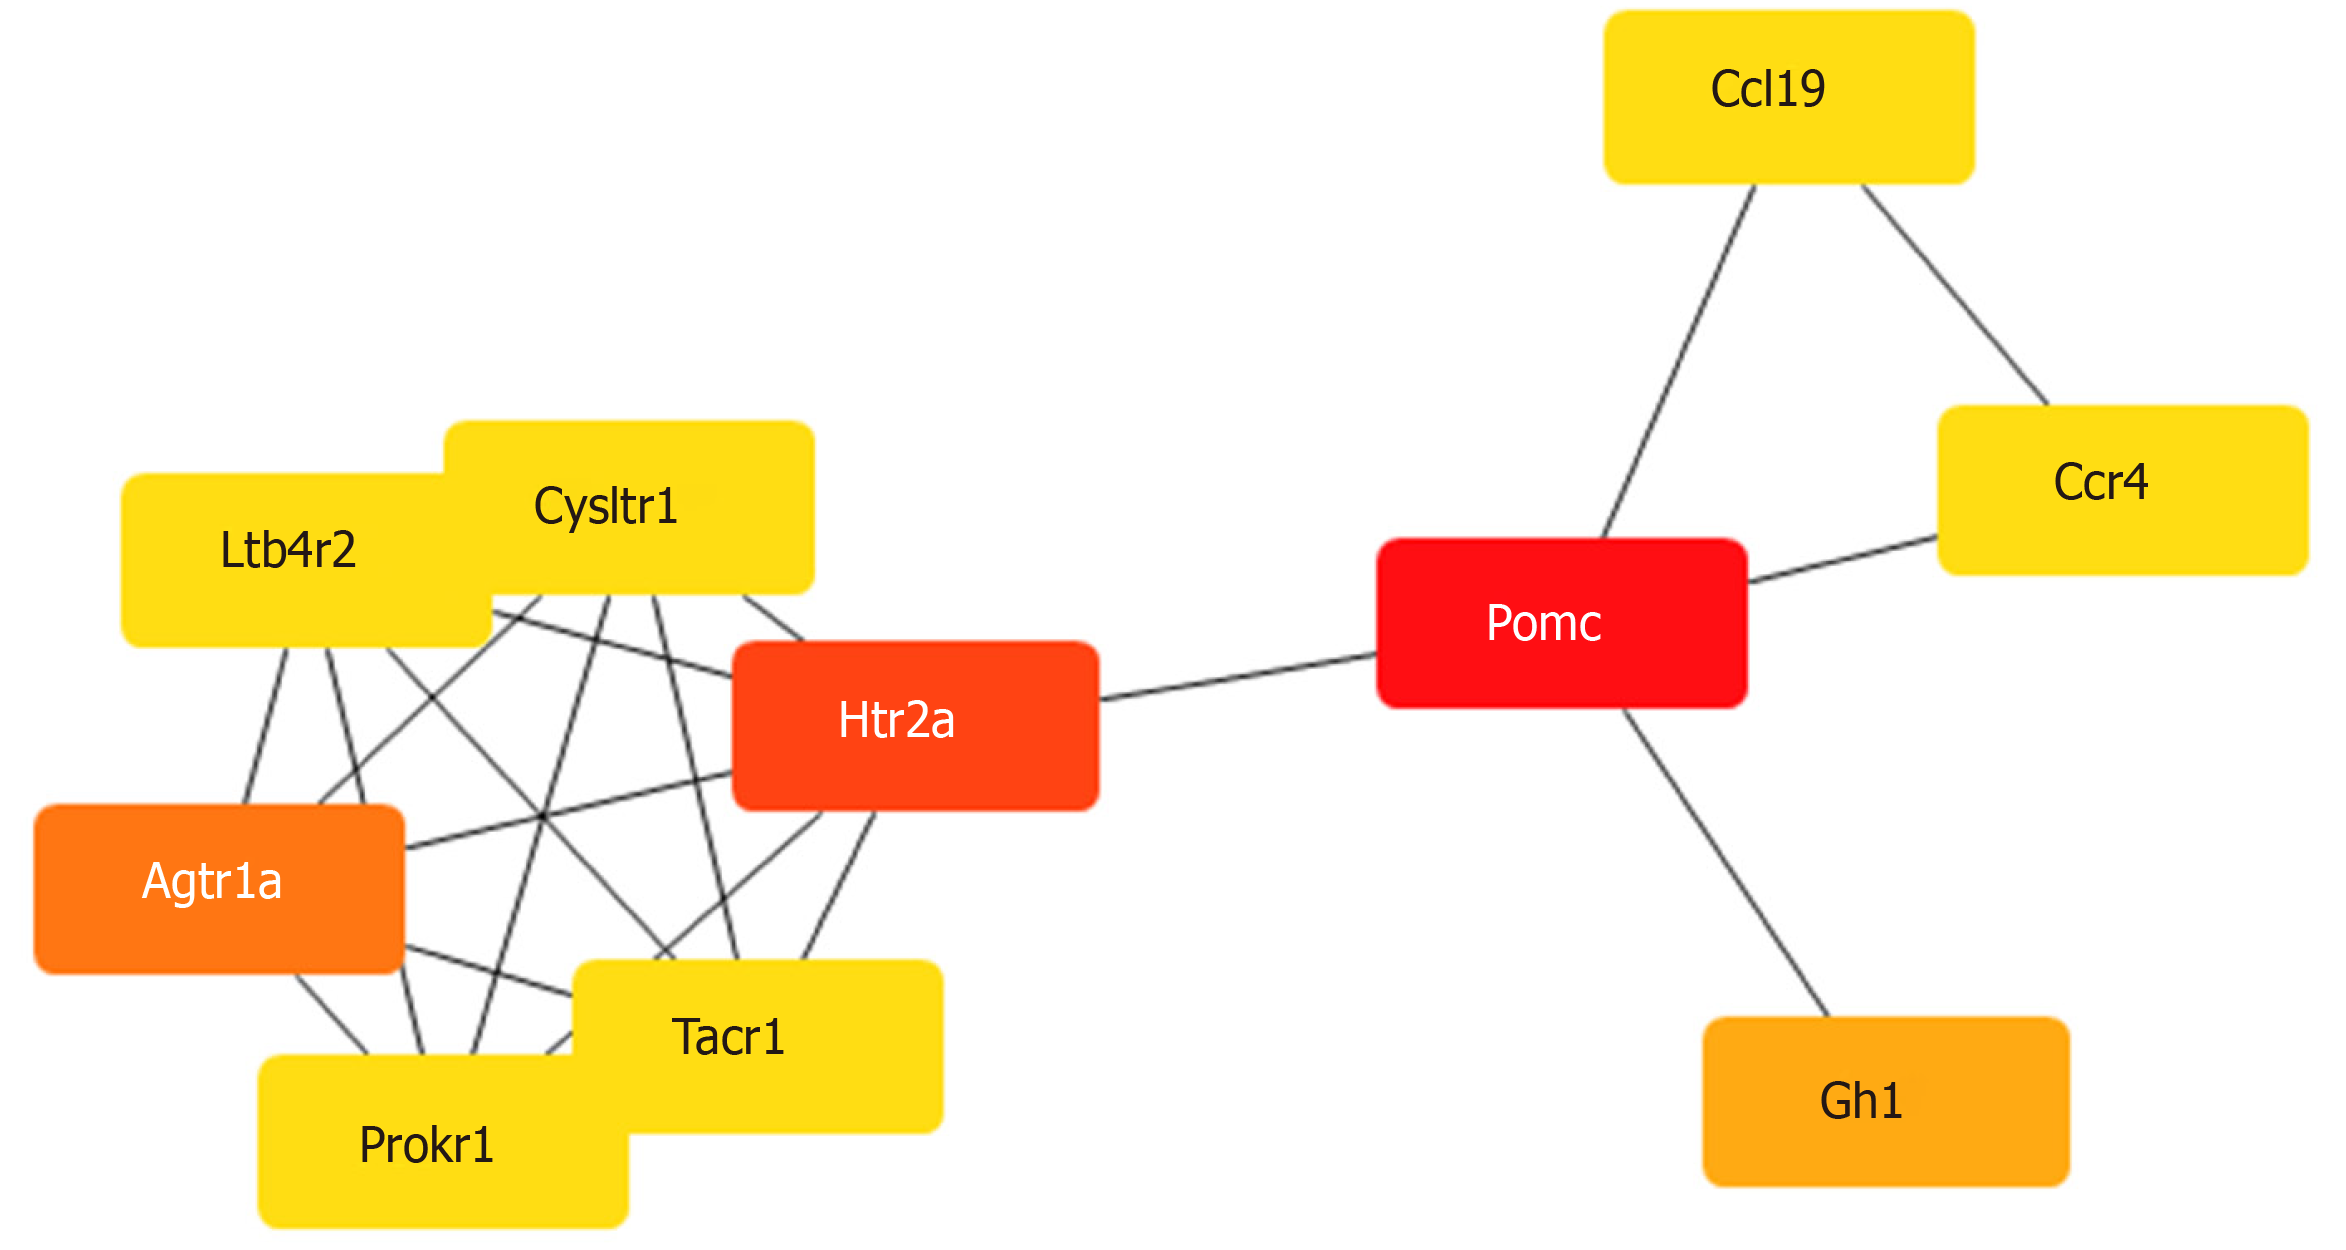
Figure 4 Hub mRNAs.
The Cytoscape plugin, CytoHubba, was used to identify hub mRNAs of the complex network. The mRNAs were colored according to their scores in CytoHubba. The darker the color, the higher the score. By combining the scores of the 11 algorithms of CytoHubba, the mRNAs Pomc, Htr2a, and Agtr1a got the top three scores and were thus considered to be hub mRNAs.
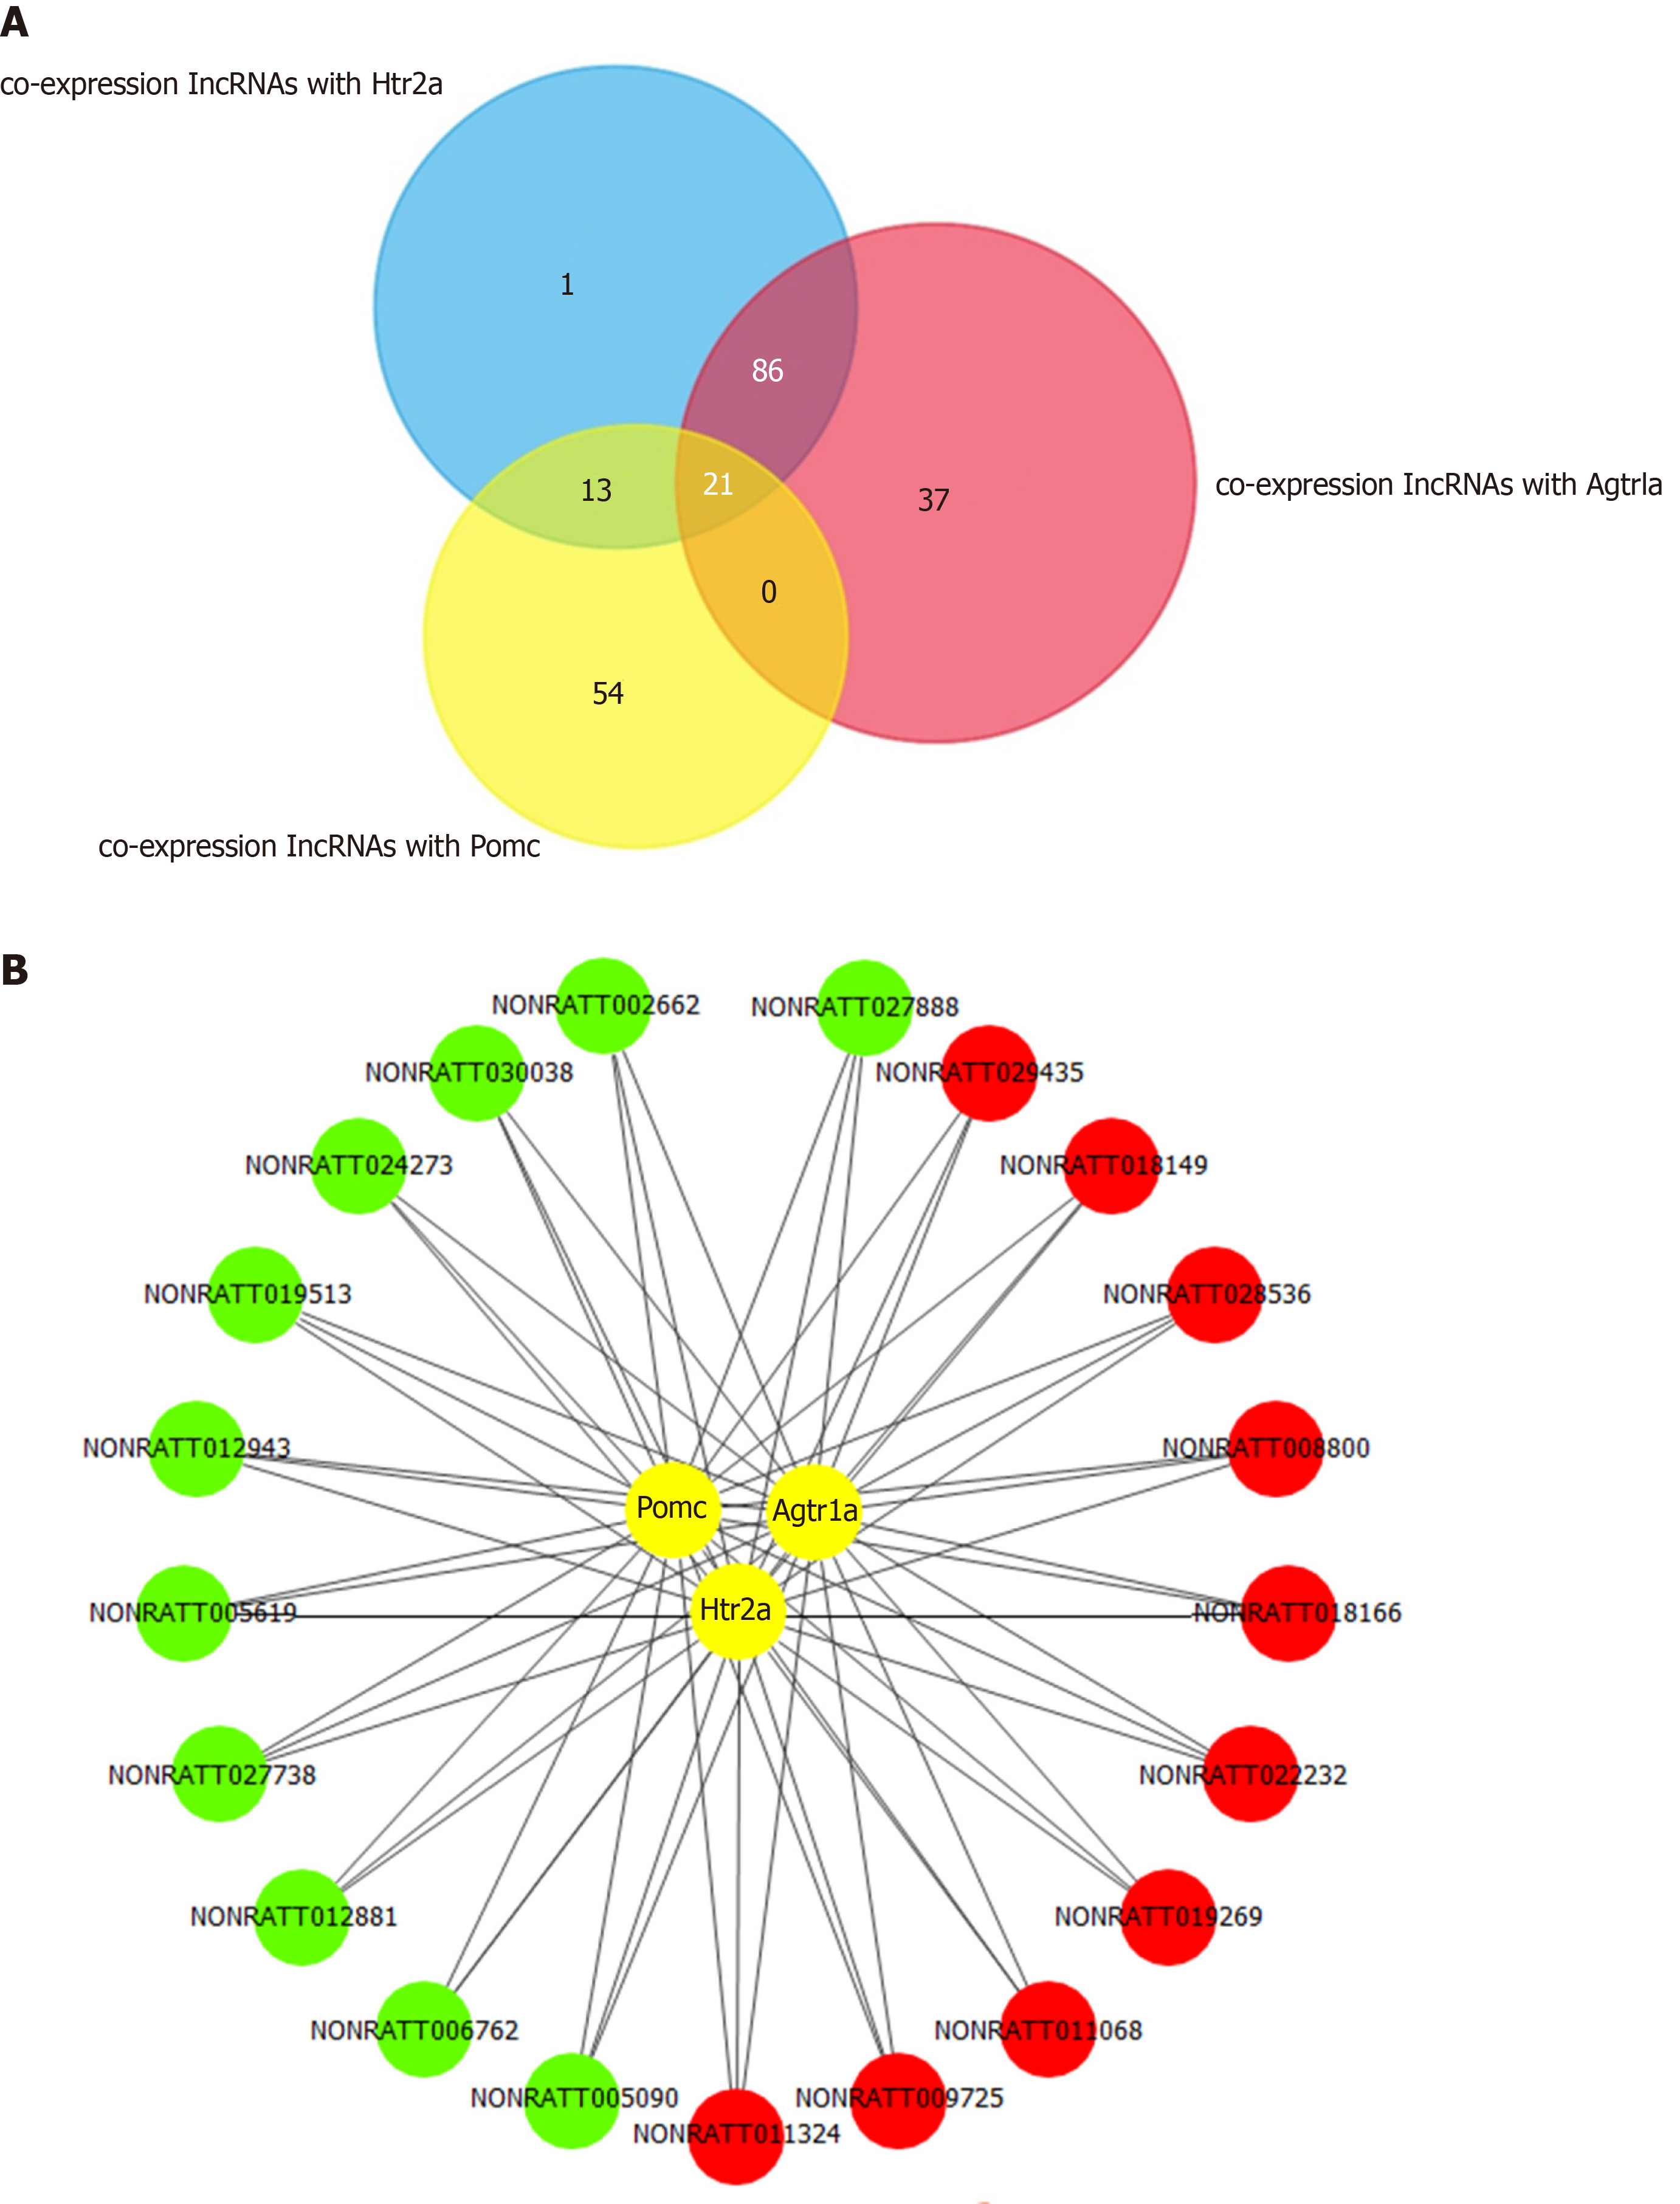
Figure 5 Co-expression network of long noncoding RNAs and hub mRNAs.
A: Venn diagram of co-expressed long noncoding RNAs (lncRNAs) with Pomc, Htr2a, and Agtr1a. A co-expression network was constructed based on the Pearson coefficient with the filter condition as P value < 0.05 and |R| > 0.90. Twenty-one common lncRNAs were obtained by intersecting the co-expressed lncRNAs of Pomc, Htr2a, and Agtr1a. B: The 21 common lncRNAs co-expressed with Pomc, Htr2a, and Agtr1a, including 11 downregulated and 10 upregulated lncRNAs. Red circles represent upregulated lncRNAs, whereas the green circles represent downregulated lncRNAs.
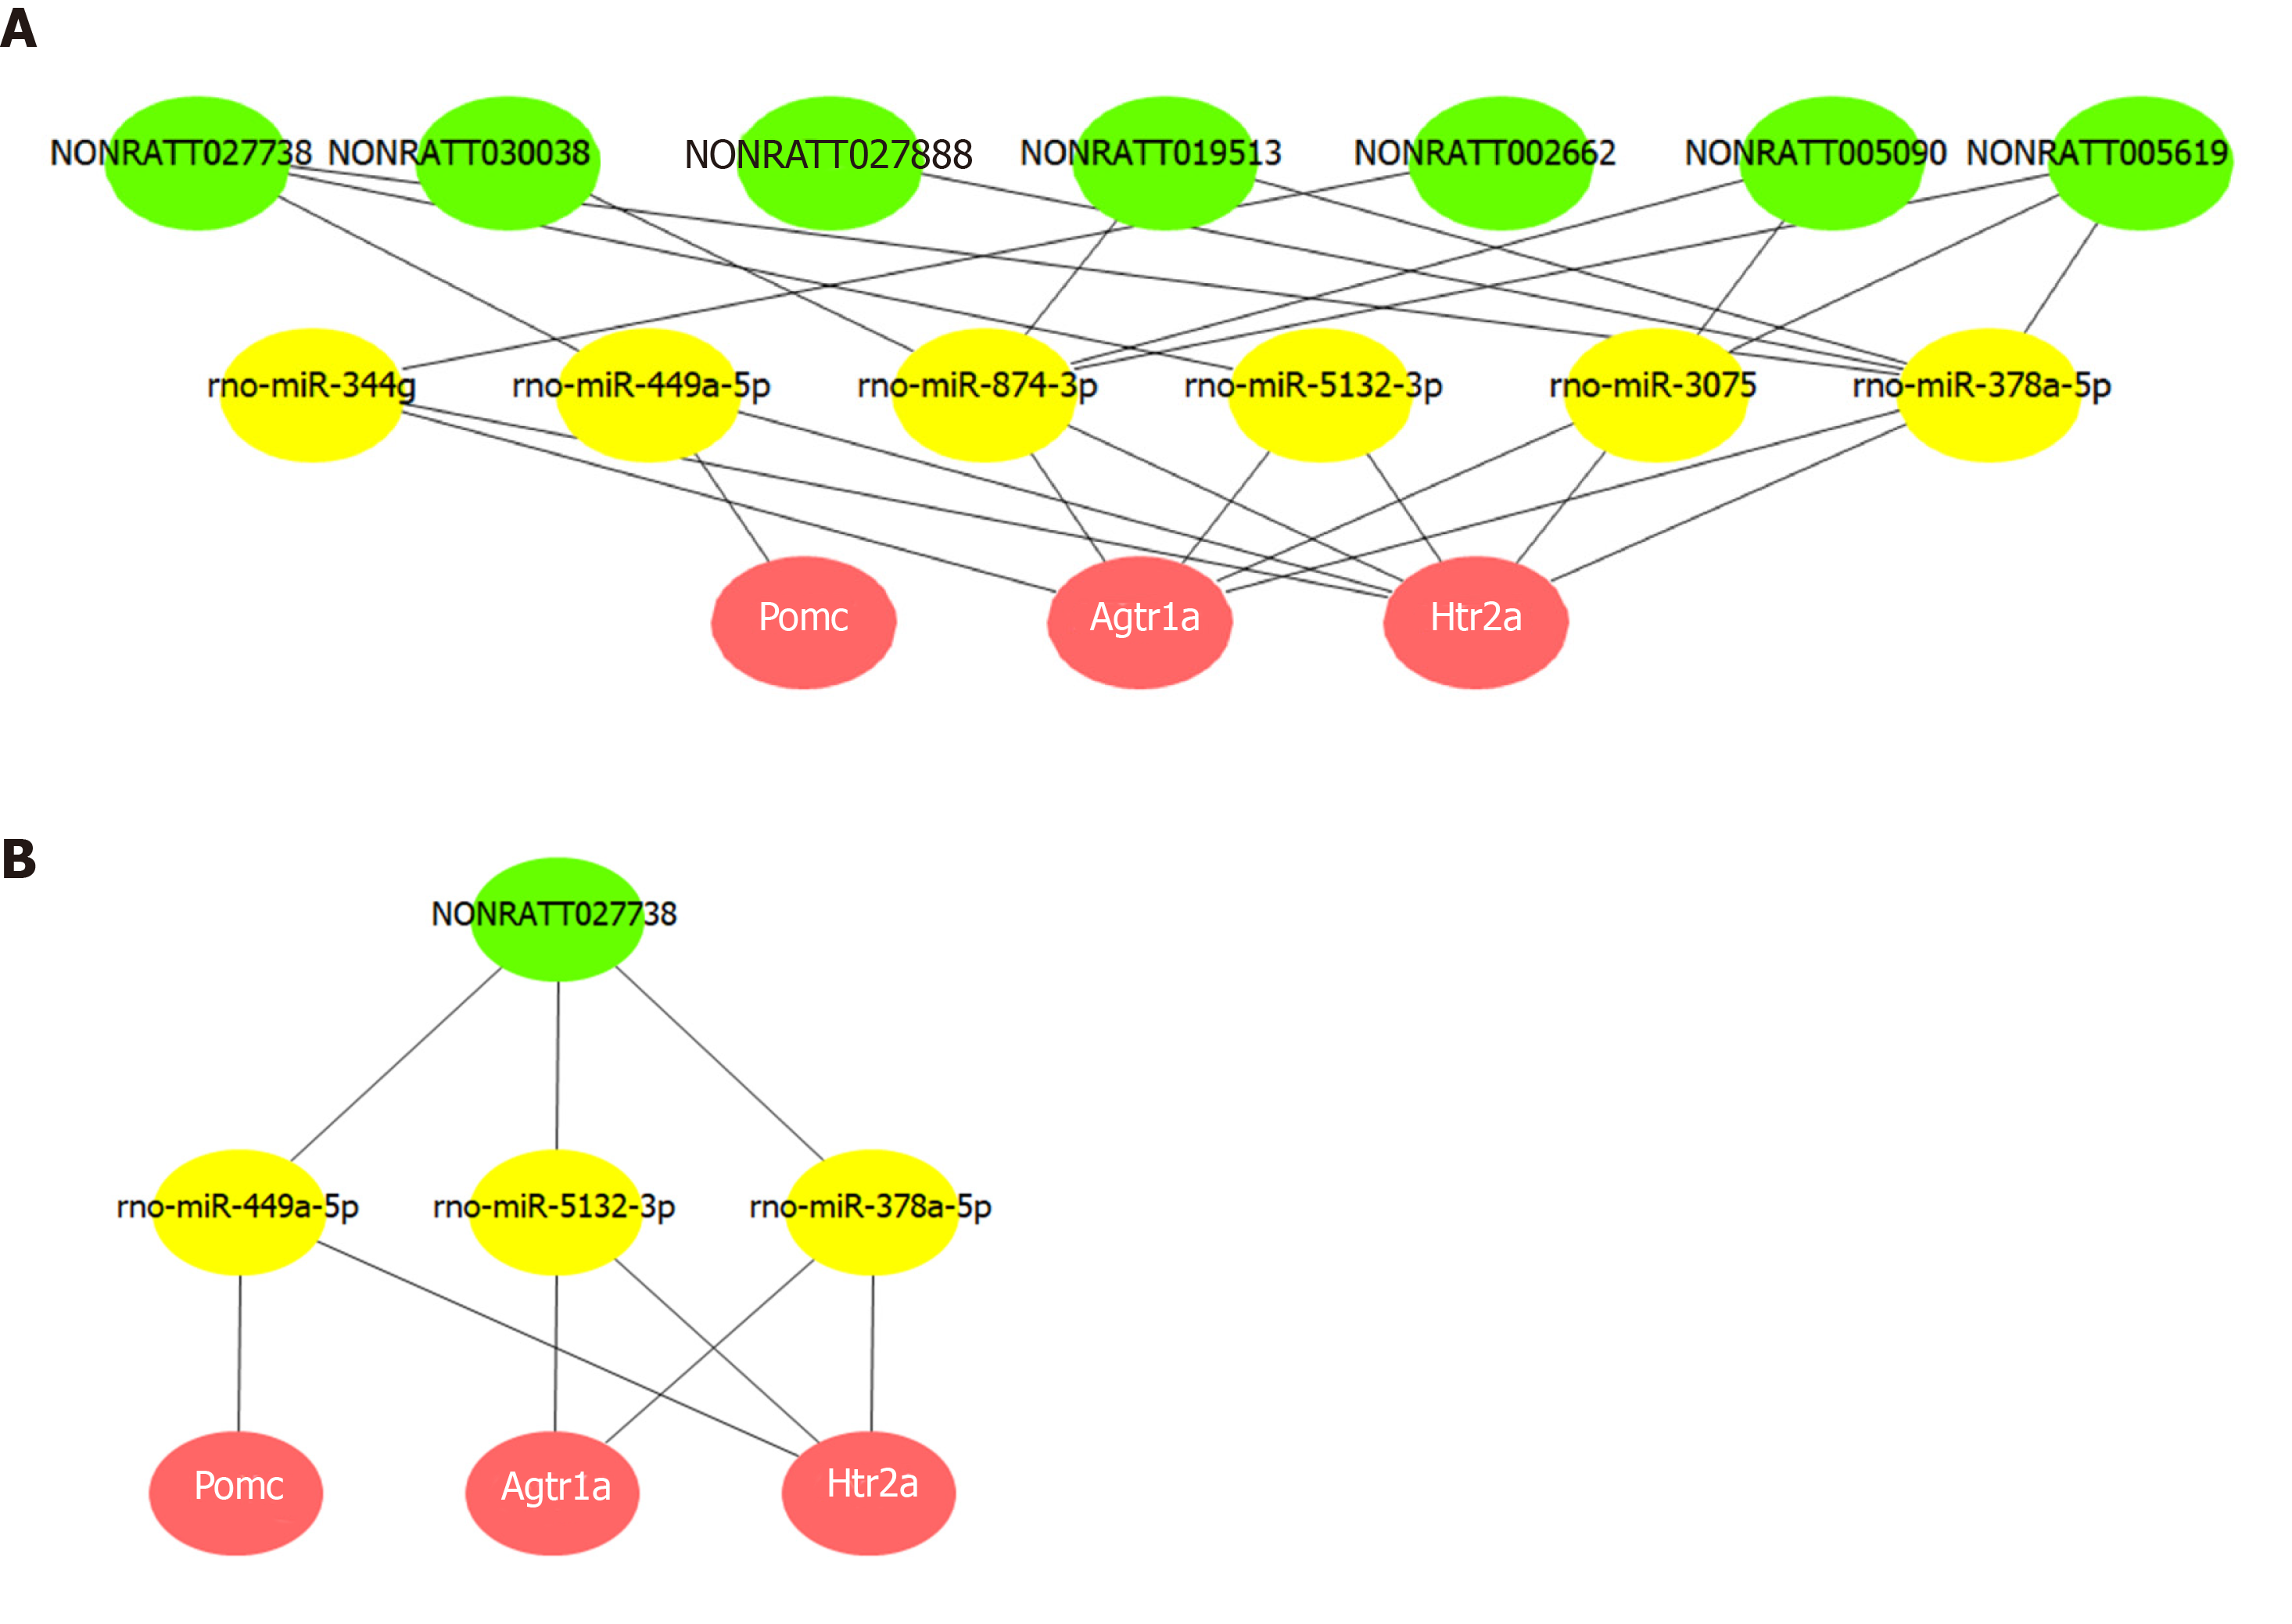
Figure 6 Competing endogenous RNA network of key long noncoding RNAs and Pomc, Htr2a, and Agtr1a.
A: The competing endogenous RNA network was constructed via common miRNAs that could bind to these 11 long noncoding RNAs (lncRNAs), as well as the three hub mRNAs. Based on the intersection of the predictions from miRanda and TargetScan, seven lncRNAs were found to competitively bind six miRNAs, thereby affecting the expression and function of the hub mRNAs. B: Further network analysis indicated that NONRATT027738 can regulate all the three hub mRNAs (Pomc, Htr2a, and Agtr1a) through miRNAs (rno-miR-449a-5p, rno-miR-5132-3p, and rno-miR-378a-5p).
- Citation: Cui LJ, Bai T, Zhi LP, Liu ZH, Liu T, Xue H, Yang HH, Yang XH, Zhang M, Niu YR, Liu YF, Zhang Y. Analysis of long noncoding RNA-associated competing endogenous RNA network in glucagon-like peptide-1 receptor agonist-mediated protection in β cells. World J Diabetes 2020; 11(9): 374-390
- URL: https://www.wjgnet.com/1948-9358/full/v11/i9/374.htm
- DOI: https://dx.doi.org/10.4239/wjd.v11.i9.374


