Published online May 15, 2025. doi: 10.4251/wjgo.v17.i5.106103
Revised: March 8, 2025
Accepted: March 31, 2025
Published online: May 15, 2025
Processing time: 88 Days and 21.1 Hours
Colorectal cancer (CRC) is a leading cause of cancer-related death globally, with the tumor immune microenvironment (TIME) influencing prognosis and immunotherapy response. Current TIME evaluation relies on invasive biopsies, limiting its clinical application. This study hypothesized that computed tomo
To develop a non-invasive DL approach using preoperative CT radiomics to evaluate TIME components in CRC patients.
In this retrospective study, preoperative CT images of 315 pathologically confirmed CRC patients (220 in training cohort and 95 in validation cohort) were analyzed. Manually delineated regions of interest were used to extract DL features. Predictive models (DenseNet-121/169) for TSR, TILs, IS, and TIME classification were constructed. Performance was evaluated via receiver operating characteristic curves, calibration curves, and decision curve analysis (DCA).
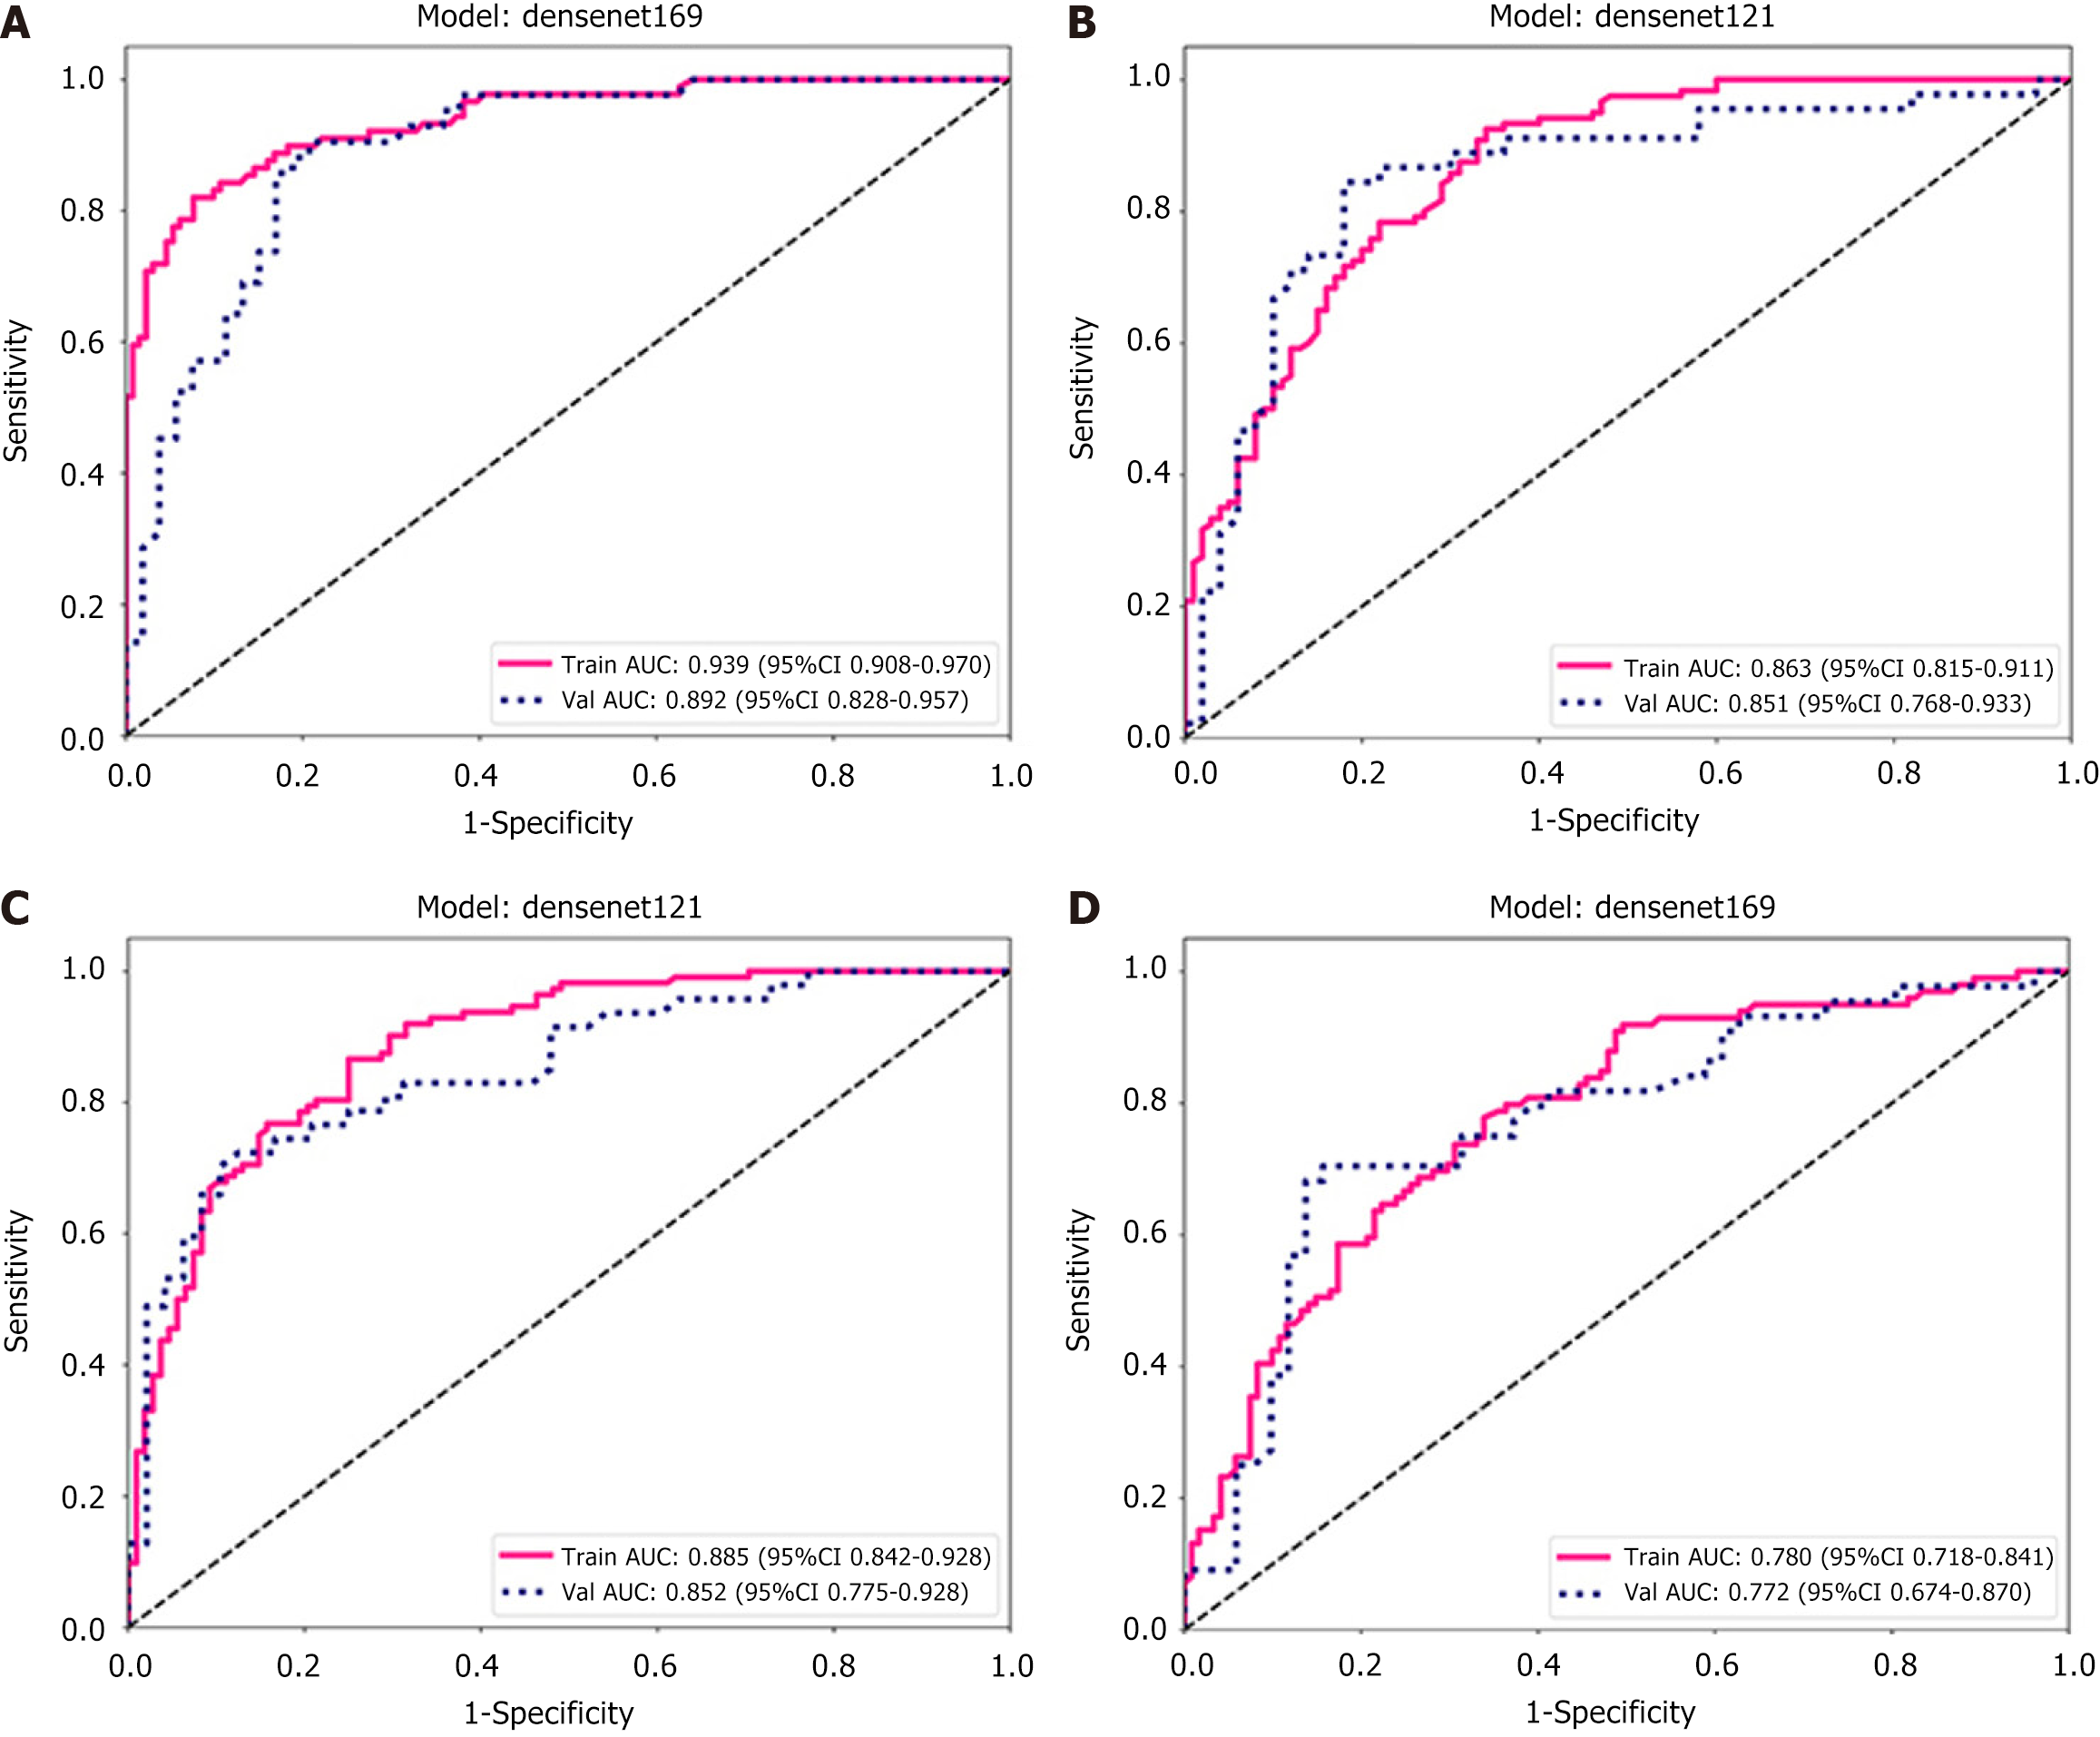
The DL-DenseNet-169 model achieved area under the curve (AUC) values of 0.892 [95% confidence interval (CI): 0.828-0.957] for TSR and 0.772 (95%CI: 0.674-0.870) for TIME score. The DenseNet-121 model yielded AUC values of 0.851 (95%CI: 0.768-0.933) for TILs and 0.852 (95%CI: 0.775-0.928) for IS. Calibration curves demonstrated strong prediction-observation agreement, and DCA confirmed clinical utility across threshold probabilities (P < 0.05 for all models).
CT-based DL radiomics provides a reliable non-invasive method for preoperative TIME evaluation, enabling personalized immunotherapy strategies in CRC management.
Core Tip: This study introduces a novel computed tomography (CT)-based deep learning (DL) radiomics approach for noninvasive assessment of the tumor immune microenvironment (TIME) in colorectal cancer. By analyzing preoperative CT images of 315 patients, DL models achieved high predictive accuracy (area under the curves: 0.851-0.892) for key TIME features: Tumor-stroma ratio, lymphocyte infiltration, and immune scoring. Clinical validation through calibration and decision curve analyses confirmed the utility of this approach in guiding immunotherapy strategies. This method eliminates invasive biopsy requirements while enabling personalized treatment planning and enhanced prognostic evaluation. The findings establish DL radiomics as a paradigm-shifting tool for precision oncology in gastrointestinal malignancies.
- Citation: Zhou C, Zhang YF, Yang ZJ, Huang YQ, Da MX. Computed tomography-based deep learning radiomics model for preoperative prediction of tumor immune microenvironment in colorectal cancer. World J Gastrointest Oncol 2025; 17(5): 106103
- URL: https://www.wjgnet.com/1948-5204/full/v17/i5/106103.htm
- DOI: https://dx.doi.org/10.4251/wjgo.v17.i5.106103
Colorectal cancer (CRC) is one of the main causes of mortality and morbidity among cancers worldwide[1]. It is anticipated that by 2040, there will be 3.2 million new cases of CRC and 1.6 million deaths due to CRC[2]. The tumor immune microenvironment (TIME) has been identified as a significant factor influencing the development and progression of CRC. The use of immunotherapy such as immune checkpoint inhibitor (ICI) therapy, has considerably transformed cancer treatment in recent decades[3,4]. ICI therapy has received approval for treating patients with CRC exhibiting molecular characteristics relating to DNA mismatch repair deficiency (dMMR)/high microsatellite instability (MSI-H). However, it is crucial to acknowledge that the dMMR/MSI-H CRC subgroup accounts for only 15% of all CRC patients; as such, the majority of CRC patients do not derive therapeutic advantages from ICI treatment[5]. Patients exhibit varying sensitivity to ICIs, which significantly limits their clinical application in CRC. Thus, identifying biomarkers that can accurately separate ICI-sensitive patients from those resistant to the drug is essential.
Recent studies have added more clarity on the impact of cells and molecules in the tumor stroma on tumor infiltration and metastasis through comprehensive investigations of tumor microenvironment (TME) markers[6,7]. The tumor-stroma ratio (TSR) is a significant morphological parameter and has been extensively validated as an independent prognostic factor for various solid tumors in numerous clinical studies[7,8]. A high abundance of tumor-stroma content (TSR > 50%) has been linked to adverse outcomes in relation to patient survival and prognosis[9,10]. Tumor-infiltrating lymphocytes (TILs) are crucial indicators of prognosis in CRC patients. The effectiveness of ICIs relies on the tumor-limiting actions of TILs[11]. Increased TIL levels are strongly associated with treatment outcomes[12,13]. The presence of immune cells, particularly the ratio of cluster of differentiation (CD) 8+ and CD3+ T cells, in the TIME can serve as a prognostic marker for the efficacy of immunotherapy[14]. Studies have proposed the immune score (IS) as a tool for predicting recurrence and survival in CRC patients. It quantifies TIME features such as cell densities and locations. The IS outperforms TNM staging and MSI status in predicting patient survival and recurrence. Large-sample research also shows its ability to predict adjuvant chemotherapy efficacy in CRC[15,16]. Currently, the assessment of key biomarkers remains highly reliant on pathological techniques. The invasiveness of pathological testing, coupled with limitations and biases in obtaining tumor specimens, hinders the widespread application of TIME analysis and prognostic assessment. Hence, it is imperative to develop innovative non-invasive assessment methods to deepen our understanding of the TIME and accurately predict cancer prognosis.
Medical imaging provides detailed information on the overall structure of the tumor, including its microscopic variations and the functionality of the surrounding TME[17]. The application of radiomics in quantitative analysis of imaging data provides a more comprehensive representation of tumors[18,19]. Consequently, a significant amount of research has focused on transforming specific regions of interest (ROIs) within images into quantitative radiomics features. These features are usually obtained through a high-throughput extraction process of information from the imaging data, and can be combined with the clinicopathological characteristics of the patient[20,21]. Subsequently, machine learning (ML) algorithms are employed to build a model using this amalgamated dataset.
Since its inception in 2012[22], radiomics has been widely applied in CRC research and has proven to be a promising tool that provides a risk-free and efficient method for diagnosis, classification, and prognostic prediction[23]. In the diagnostic research of CRC, Yang et al[24] used a CT radiomics model to predict RAS and BRAF mutation phenotypes[24]. Ma et al[25] developed and validated a DL model for assessing tumor differentiation and lymph node metastases. Prognostic models are being developed continuously. In a study involving 766 CRC patients, Li et al[26] proposed that ML can help predict lymph node metastasis[26]. Based on magnetic resonance imaging (MRI) images, Shu et al[27] proposed an ML radiomics model that combined clinical risk factors and least absolute shrinkage and selection operator features, and demonstrated good predictive performance: Area under the curve (AUC) = 0.921[27]. Accurately predicting the efficacy of non-surgical treatment for CRC patients is also a hot topic in current ML model training. Giannini et al[28] proposed that second-order texture features (five from positron emission tomography and one from MRI) could help distinguish responding and non-responding patients: Sensitivity = 86%; Specificity = 83%; AUC = 0.860[28]. Regarding tumor response to anti-epidermal growth factor receptor therapy, Dercle et al[29] established a relatively reliable ML model for predicting the response to targeted therapy based on 667 cases of CT imaging data. In summary, radiomics can play a key role in CRC examination, serving as an additional tool in clinical settings to help clinicians identify patients with high-risk disease.
Based on the aforementioned research context, we have developed and validated a DL model that integrated CT images and histopathological images to predict immune-related indicators such as TSR, TILs, and IS in CRC patients.
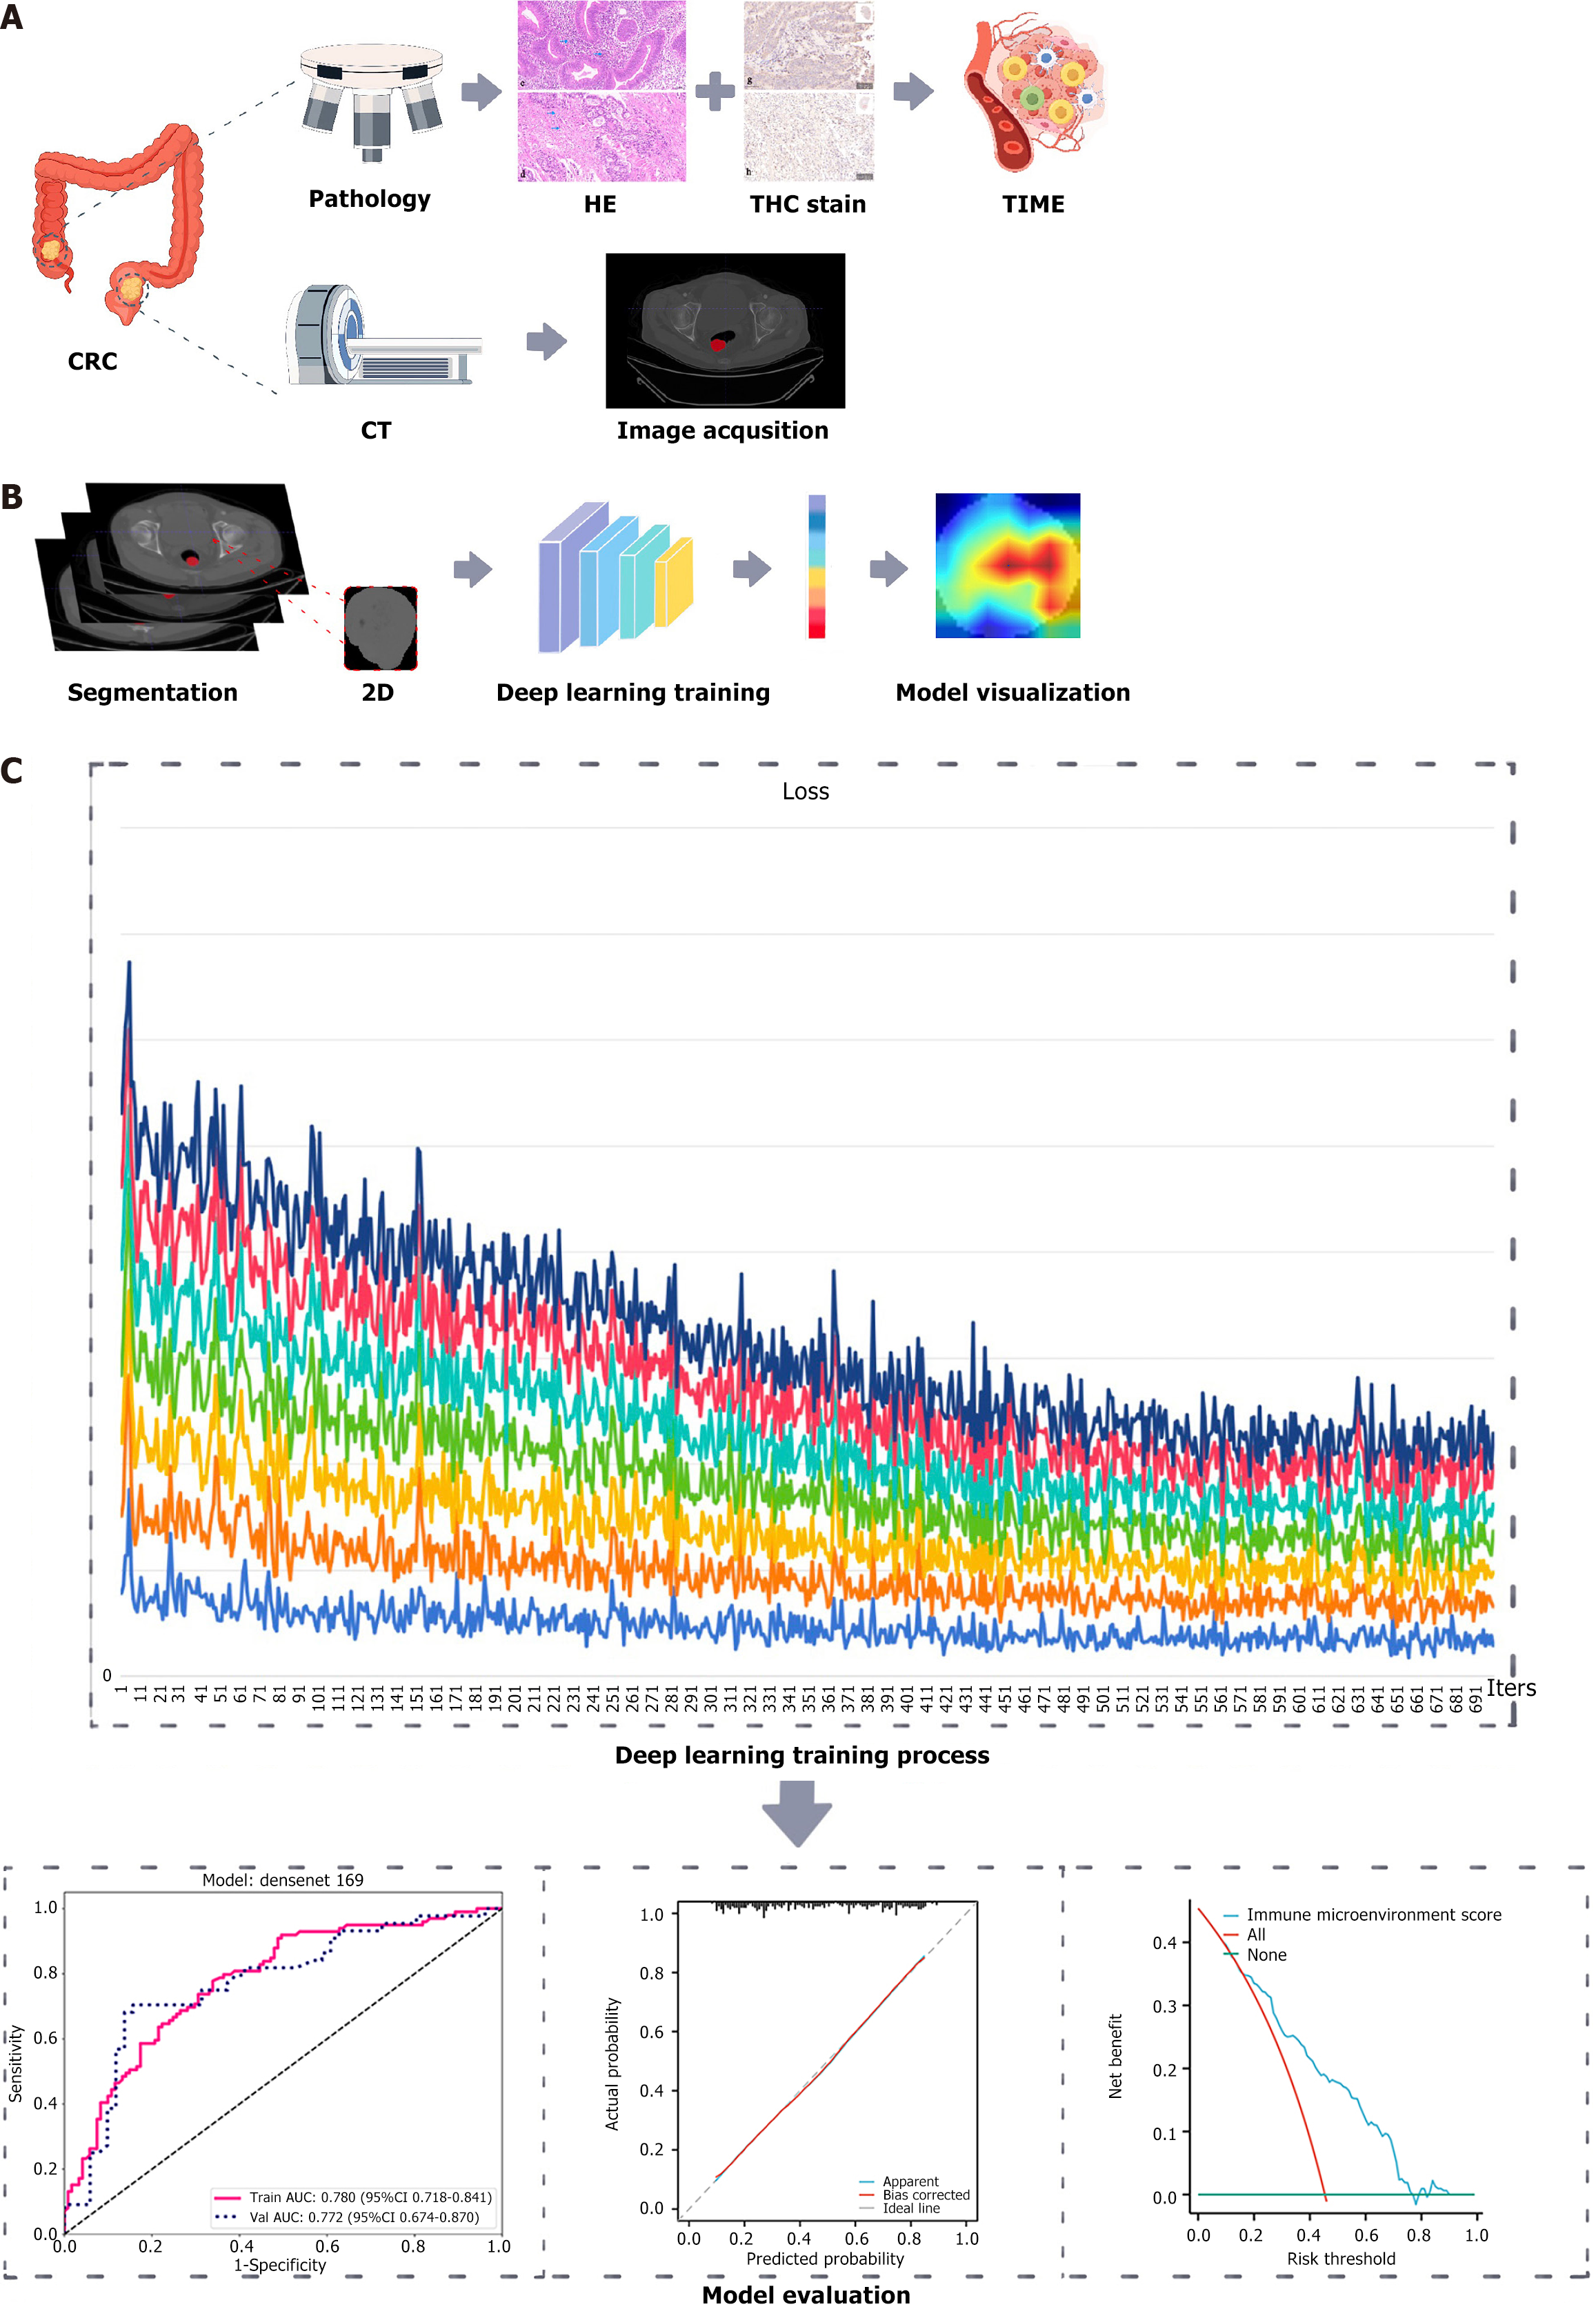
The overall process of this study involves the integration of CT imaging and pathological data of CRC patients using DL to develop and validate a predictive model for the immune microenvironment of CRC patients (Figure 1).
This study was reviewed and approved by the Ethics Committee of Gansu Provincial Hospital Institutional Review Board (No. 2023-604), with the requirement for informed consent being exempted. Prior to conducting the analysis, the patients’ records were anonymized and de-identified.
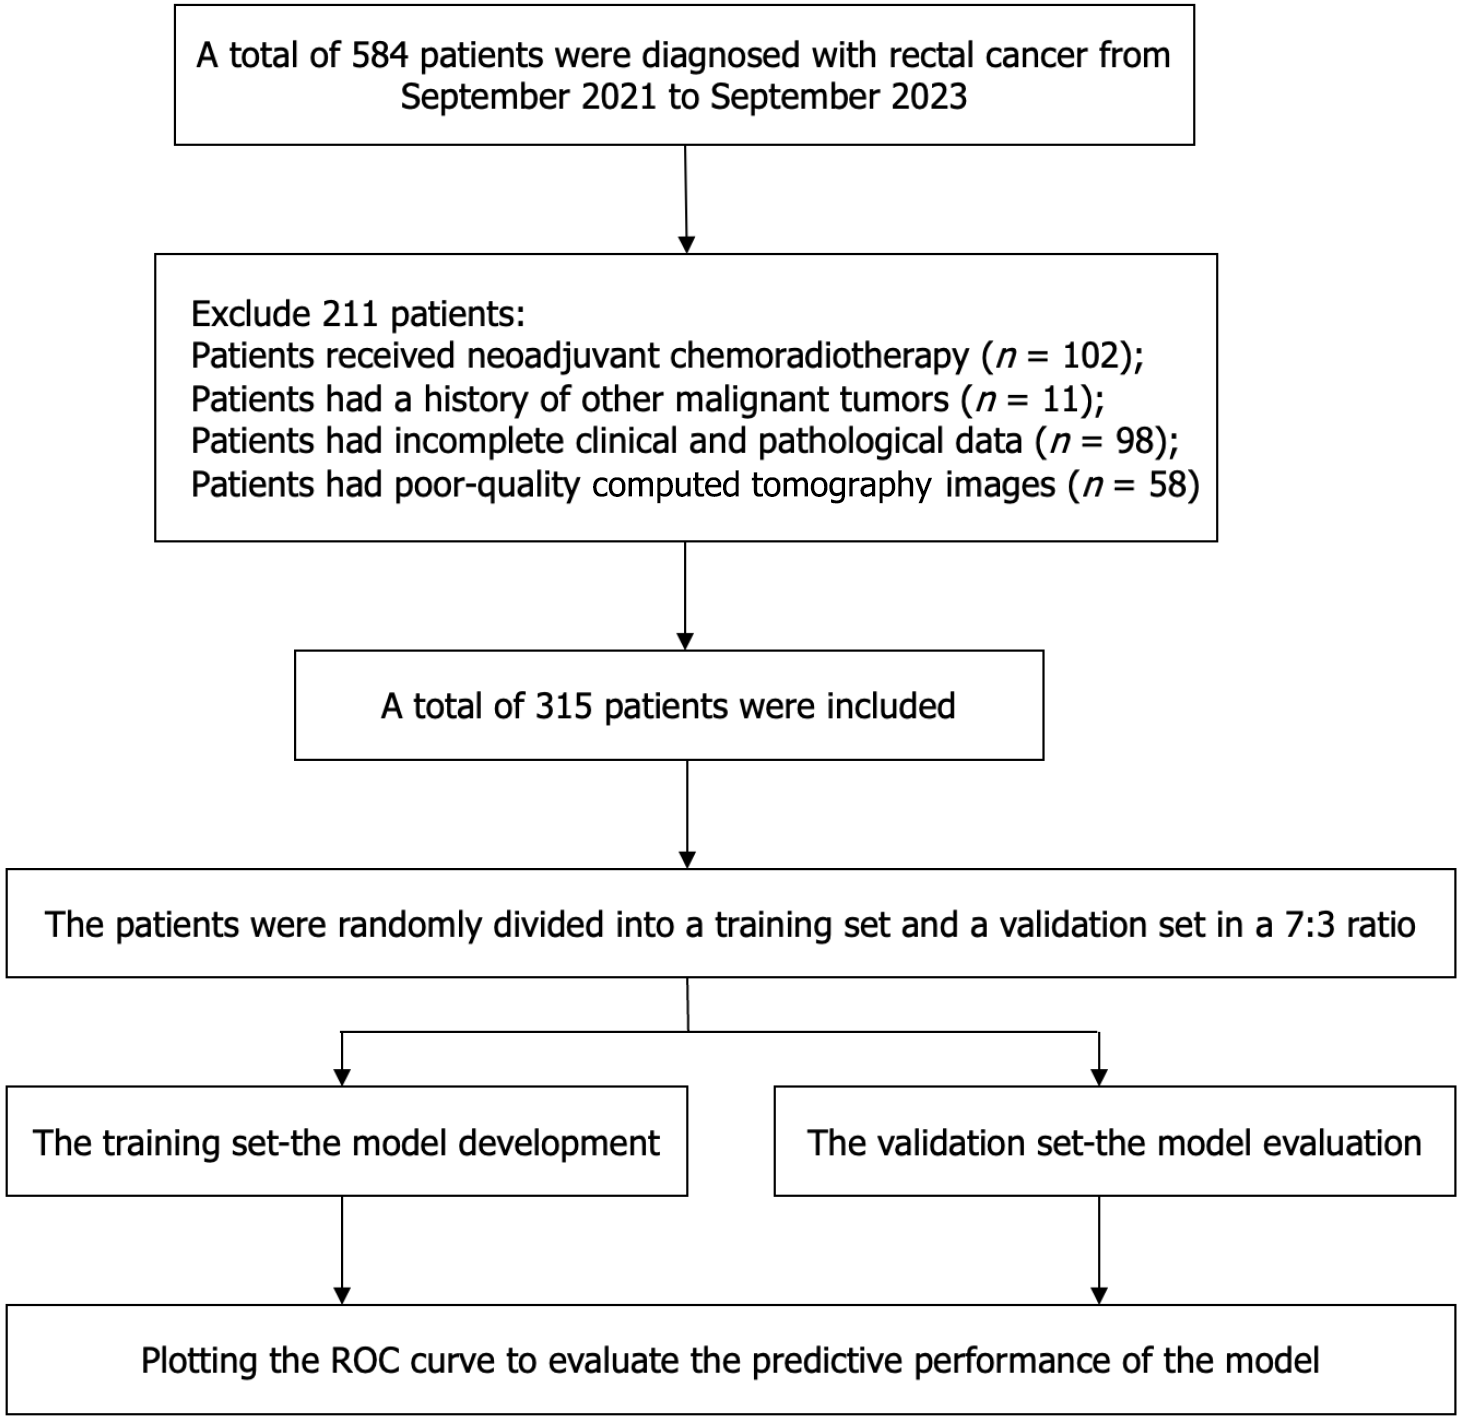
A total of 315 patients were successfully recruited between January 2021 and September 2023. The recruitment process is shown in Figure 2. The recruited patients were randomly allocated to either a training cohort (n = 220) or a validation cohort (n = 95). The ratio of participants in the training cohort to the validation cohort was 7:3.
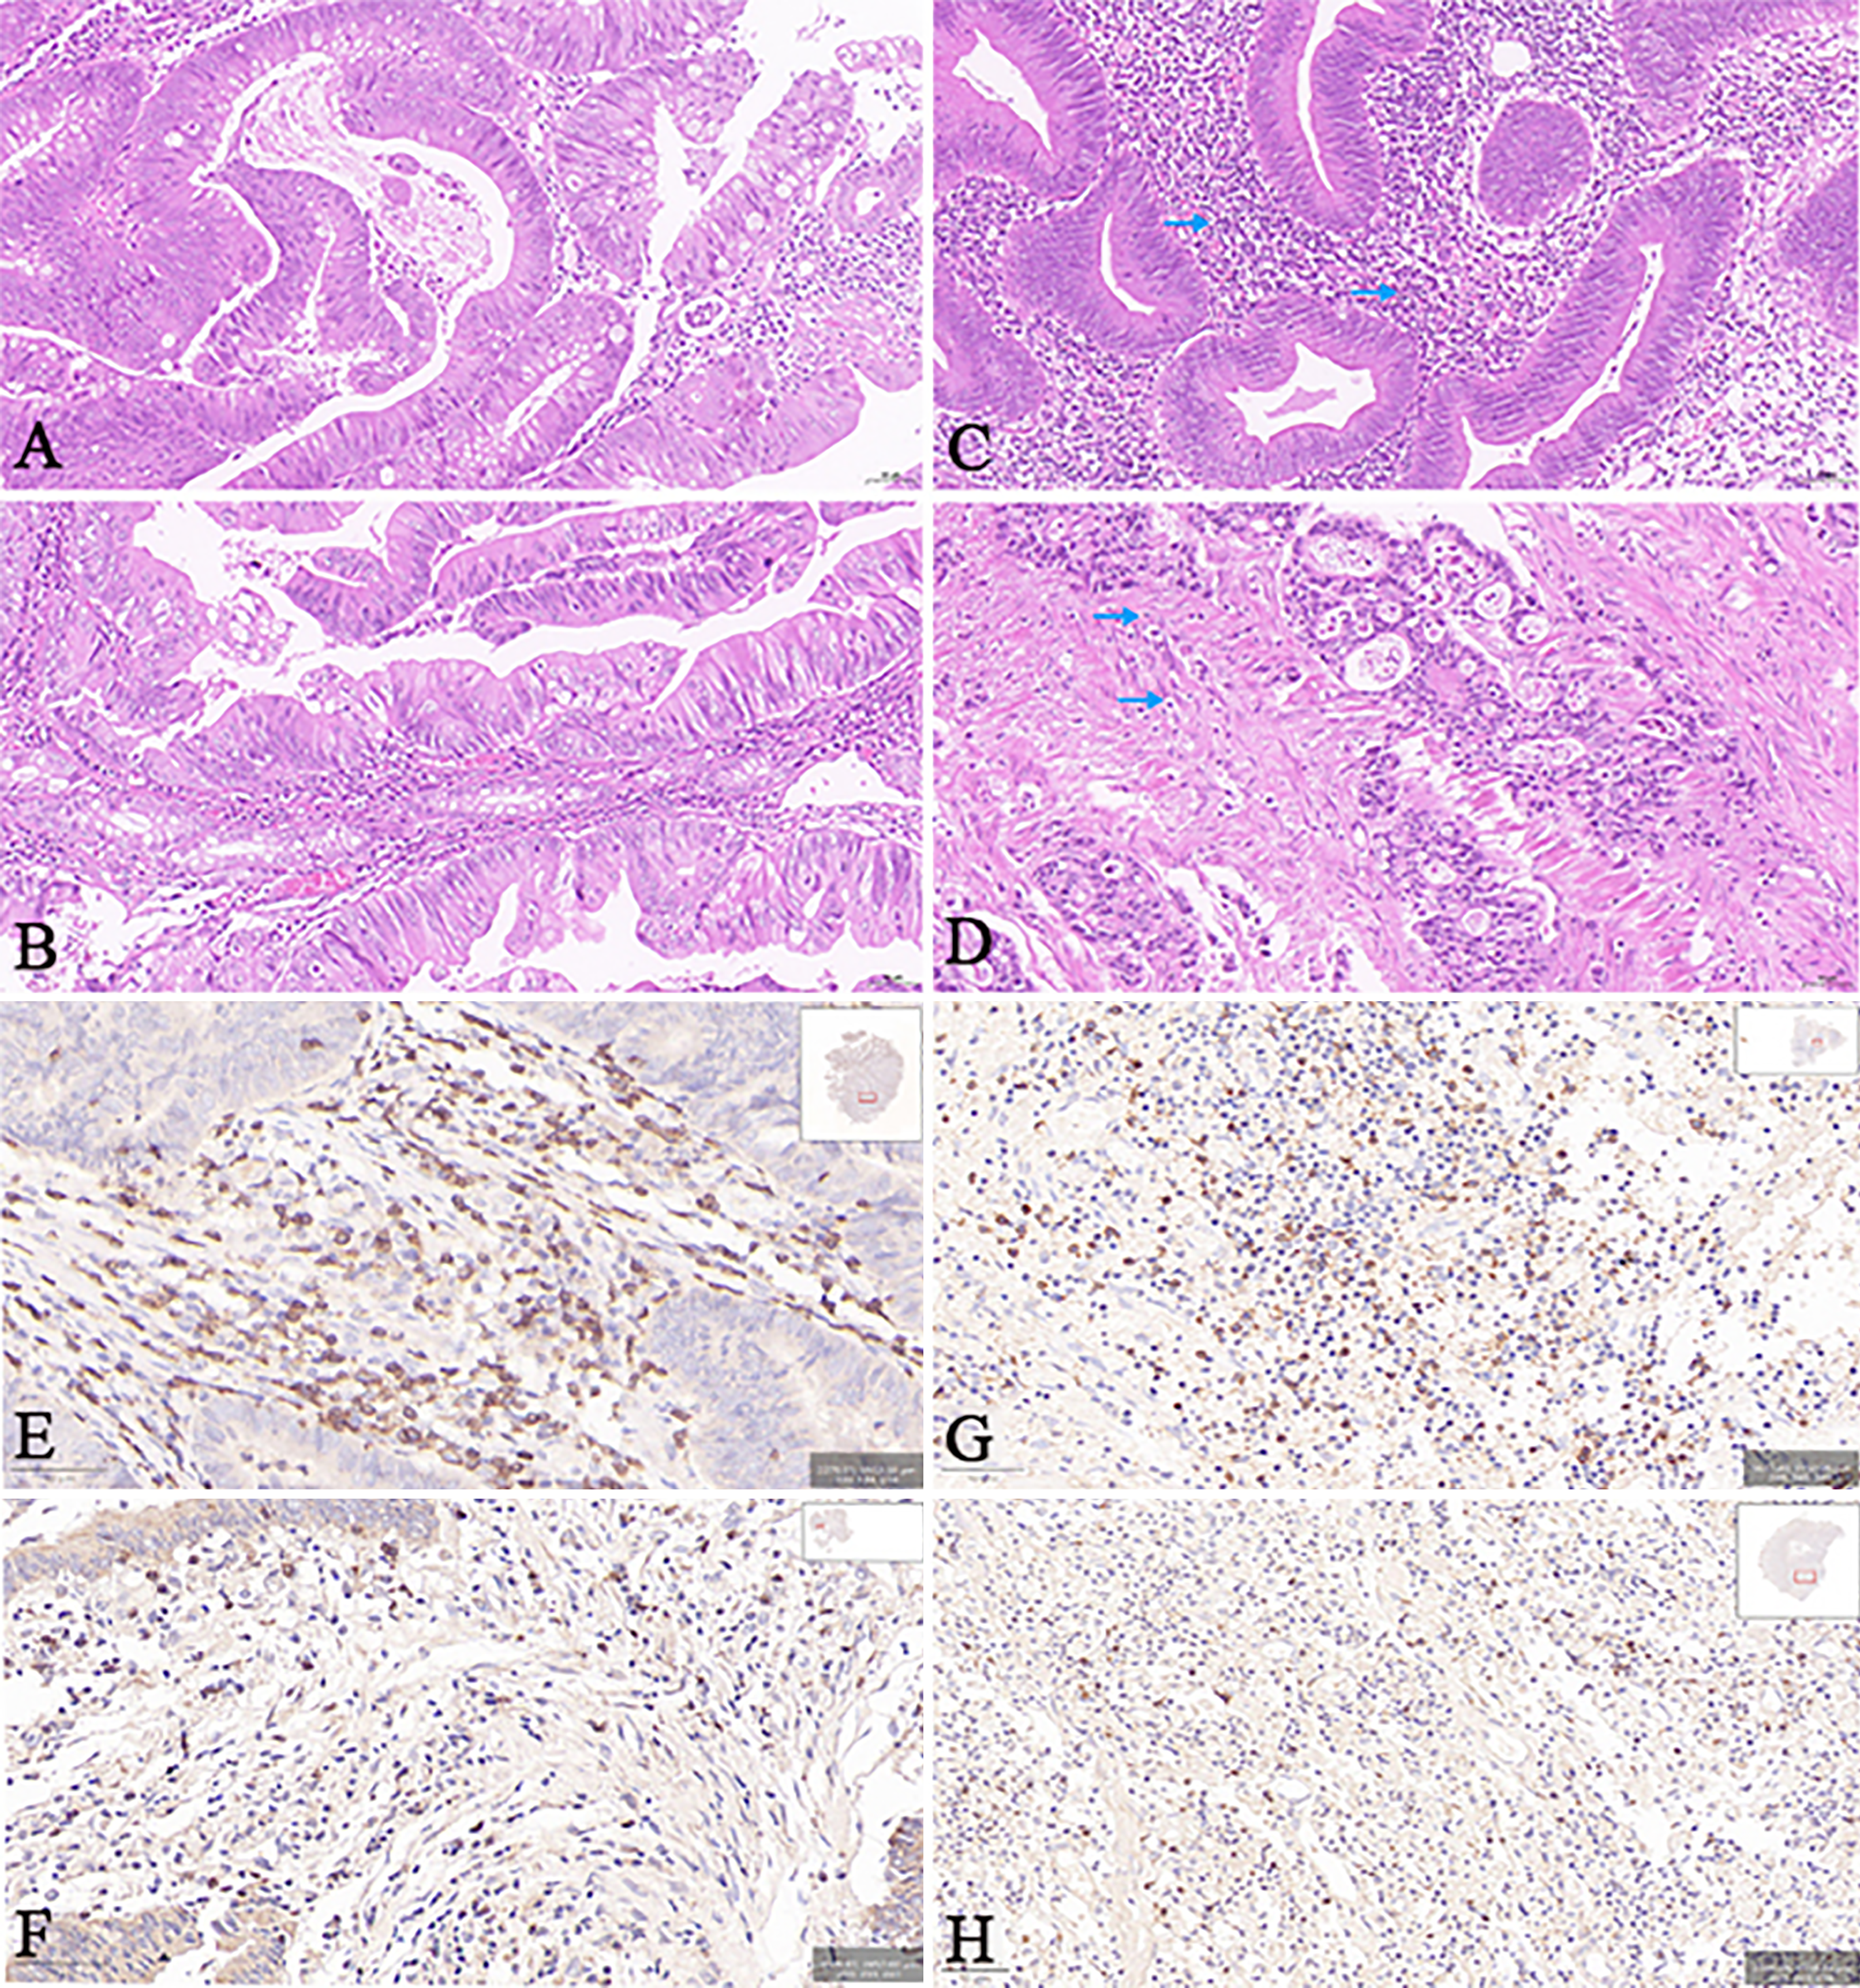
TSR measurements: Two pathologists, employing a blinded approach, identified the region of the tumor with the highest level of infiltration, using the method used to determine the T-stage. Subsequently, sequential 5-μm sections were prepared and stained using conventional hematoxylin-eosin staining. When observing at a lower magnification, it is crucial to identify the segment with the highest concentration of stroma content. It is also crucial to identify the specific area within that segment that has the highest stroma concentration. Accordingly, TSR evaluation was conducted when tumor cells were observed across the entire field of view. The TSR was calculated as (stromal area/total area) × 100%, ranging from 10% to 90% in 10% increments. Additionally, the TSR was computed for three selected areas within the field of view, and the maximum value was finally selected. The high TSR group (Figure 3A) was defined as having a TSR greater than 50%, while the low TSR group (Figure 3B) had a TSR less than or equal to 50%.
TIL infiltration determination: The pathological sections were analyzed under a microscope in the area with the most noticeable tumor infiltration, and the TILs were classified into four grades according to the level of infiltration, with grade 0 representing no lymphocyte reaction, grade 1 indicating the presence of a few scattered lymphocytes, grade 2 signifying a moderate lymphocyte reaction or infiltration of lymphocytes, and grade 3 denoting a significant infiltration of lymphocytes that disrupts the continuity of the tumor cells. Utilizing infiltration status as the basis, the cases were then divided into two groups: Low TILs group (including cases graded as 0-1, as shown in Figure 3C) and high TILs group (consisting of cases graded as 2-3, as shown in Figure 3D).
Immunohistochemistry staining and IS calculation: Immunohistochemistry was used to identify CD3+ and CD8+ T cells[30,31]. Paraffin sections obtained from surgical tissue specimens were subjected to the Envision two-step staining procedure. The central area (CA) and invasive margin (IM) of the tumor were examined at a low magnification (× 100) using an Olympus optical microscope. Two independent observers then selected eight representative fields of CA and IM, four each, which were photographed at high magnification (× 200). The captured images were subsequently utilized to quantify the quantity of immune cells that exhibited positive staining for CD3 and CD8 (Figure 3E-H). The IS was determined based on previous studies[32,33]. The IS of each patient was aggregated by summing four binary scores (ranging from 0 to 4). A high IS was defined as an IS of > 2, while a low IS was defined as an IS of ≤ 2.
Assessment of TIME: Using the divided data obtained through the mentioned methodology, we included the patients’ TSR, TILs, and IS within a standardized assessment range of 0-3. More precisely, elevated levels of TSR, TILs, and IS were assigned a score of 3, while lower levels were given a score of 0. Consequently, a low TIME was indicated by scores of 0 or 1, while scores of 2 or 3 indicated a high TIME. By utilizing this approach, the patient’s TIME was approximated.
CT image acquisition and segmentation: Before the surgical procedure, all CRC patients were subjected to CT scanning; the specific CT parameters used are provided in the Supplementary material. In this study, plain CT images with a layer thickness of 5 mm were selected to delineate the ROI. Initially, the images of each patient were saved in Digital Imaging and Communications in Medicine format. To ensure the consistency of the image data, we performed normalization on all CT images. Two proficient radiologists delineated the ROI using ITK-SNAP software (version 3.6.0) employing a double-blind approach. Upon completion, the original and ROI images were stored in the nii.gz format. After completing the segmentation process, the crop tool was used to extract the largest ROI cross-section of the tumor. The designated section was stored in the png format, specifically earmarked for the training phase of the DL model. To ensure the consistency of the delineations made by the two radiologists (inter-observer variability), we used PyRadiomics (http://www.radiomics.io/pyradiomics.html) to extract the same radiomic features based on the ROIs delineated by the two physicians for statistical analysis. The results showed no statistically significant difference between the two sets of features (P < 0.05).
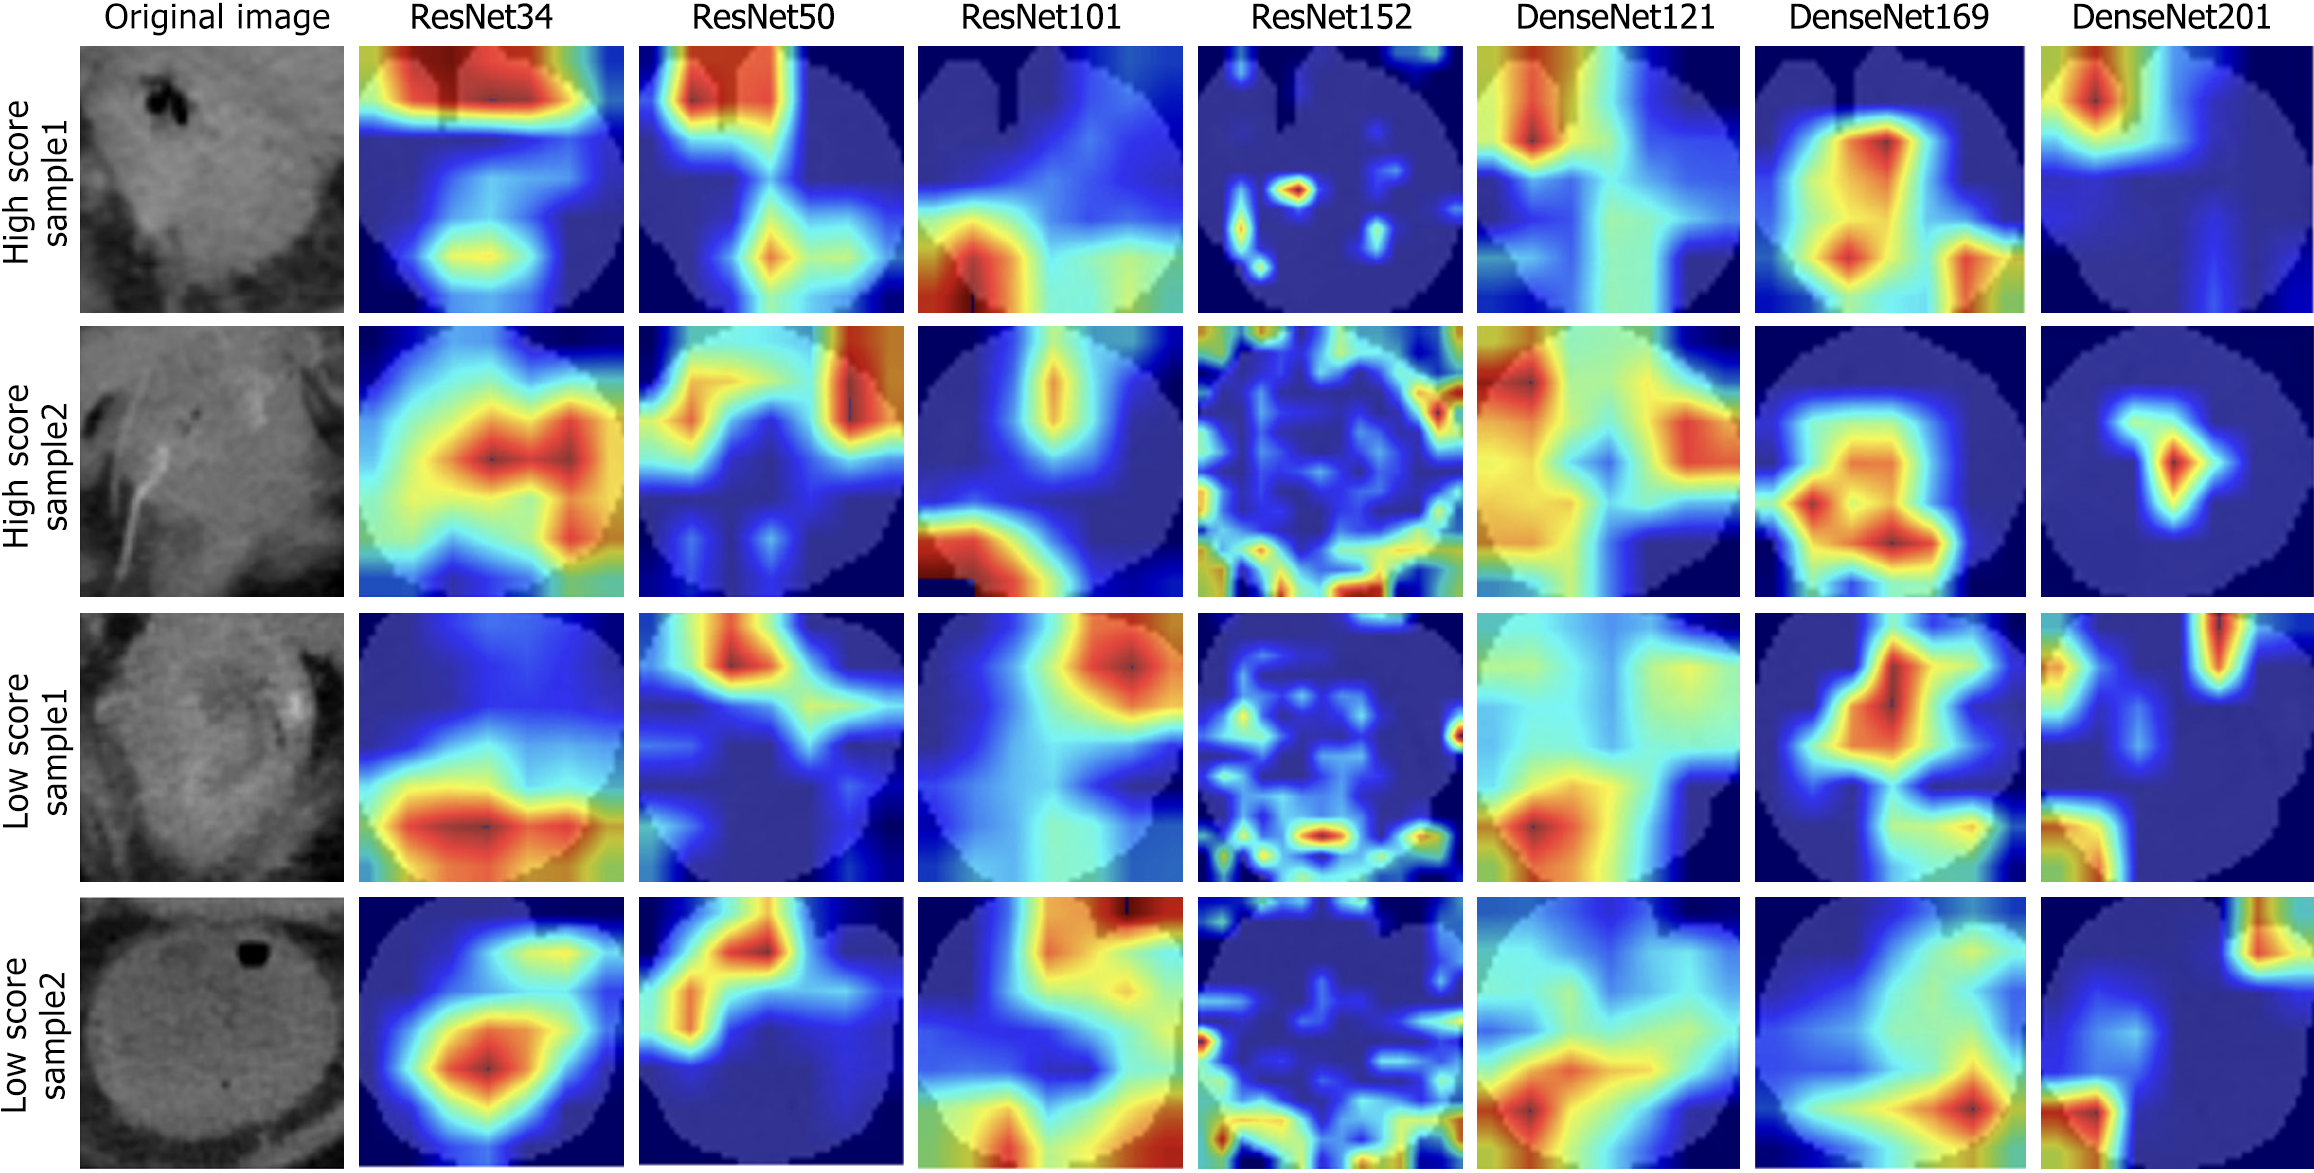
Deep learning model construction: A cohort of 315 CRC patients who met the inclusion criteria were randomly divided into two groups: A training set (n = 220) and a test set (n = 95), with a 7:3 ratio. The models selected for model pre-training included ResNet-34, ResNet-50, ResNet-101, ResNet-152, DenseNet-121, DenseNet-169, and DenseNet-201. The backbone employed for pre-training was the ImageNet dataset, which was initially trained and is accessible at http://www.image-net.org. The number of epochs was set to 100 and the batch size was set to 32. Normalization was performed using ‘imagenet’, and the initial learning rate was set to 0.01. To improve the transparency of the model’s decision-making, we employed the Gradient Weighted Class Activation Mapping (Grad-CAM) method to visualize and analyze the model. This method leverages the gradient data derived from the final convolutional layer of a convolutional neural network (CNN) to create a class activation map via weighted integration. The class activation map effectively pinpoints significant regions within the target image, thus aiding in a deeper comprehension of the model’s decision-making process.
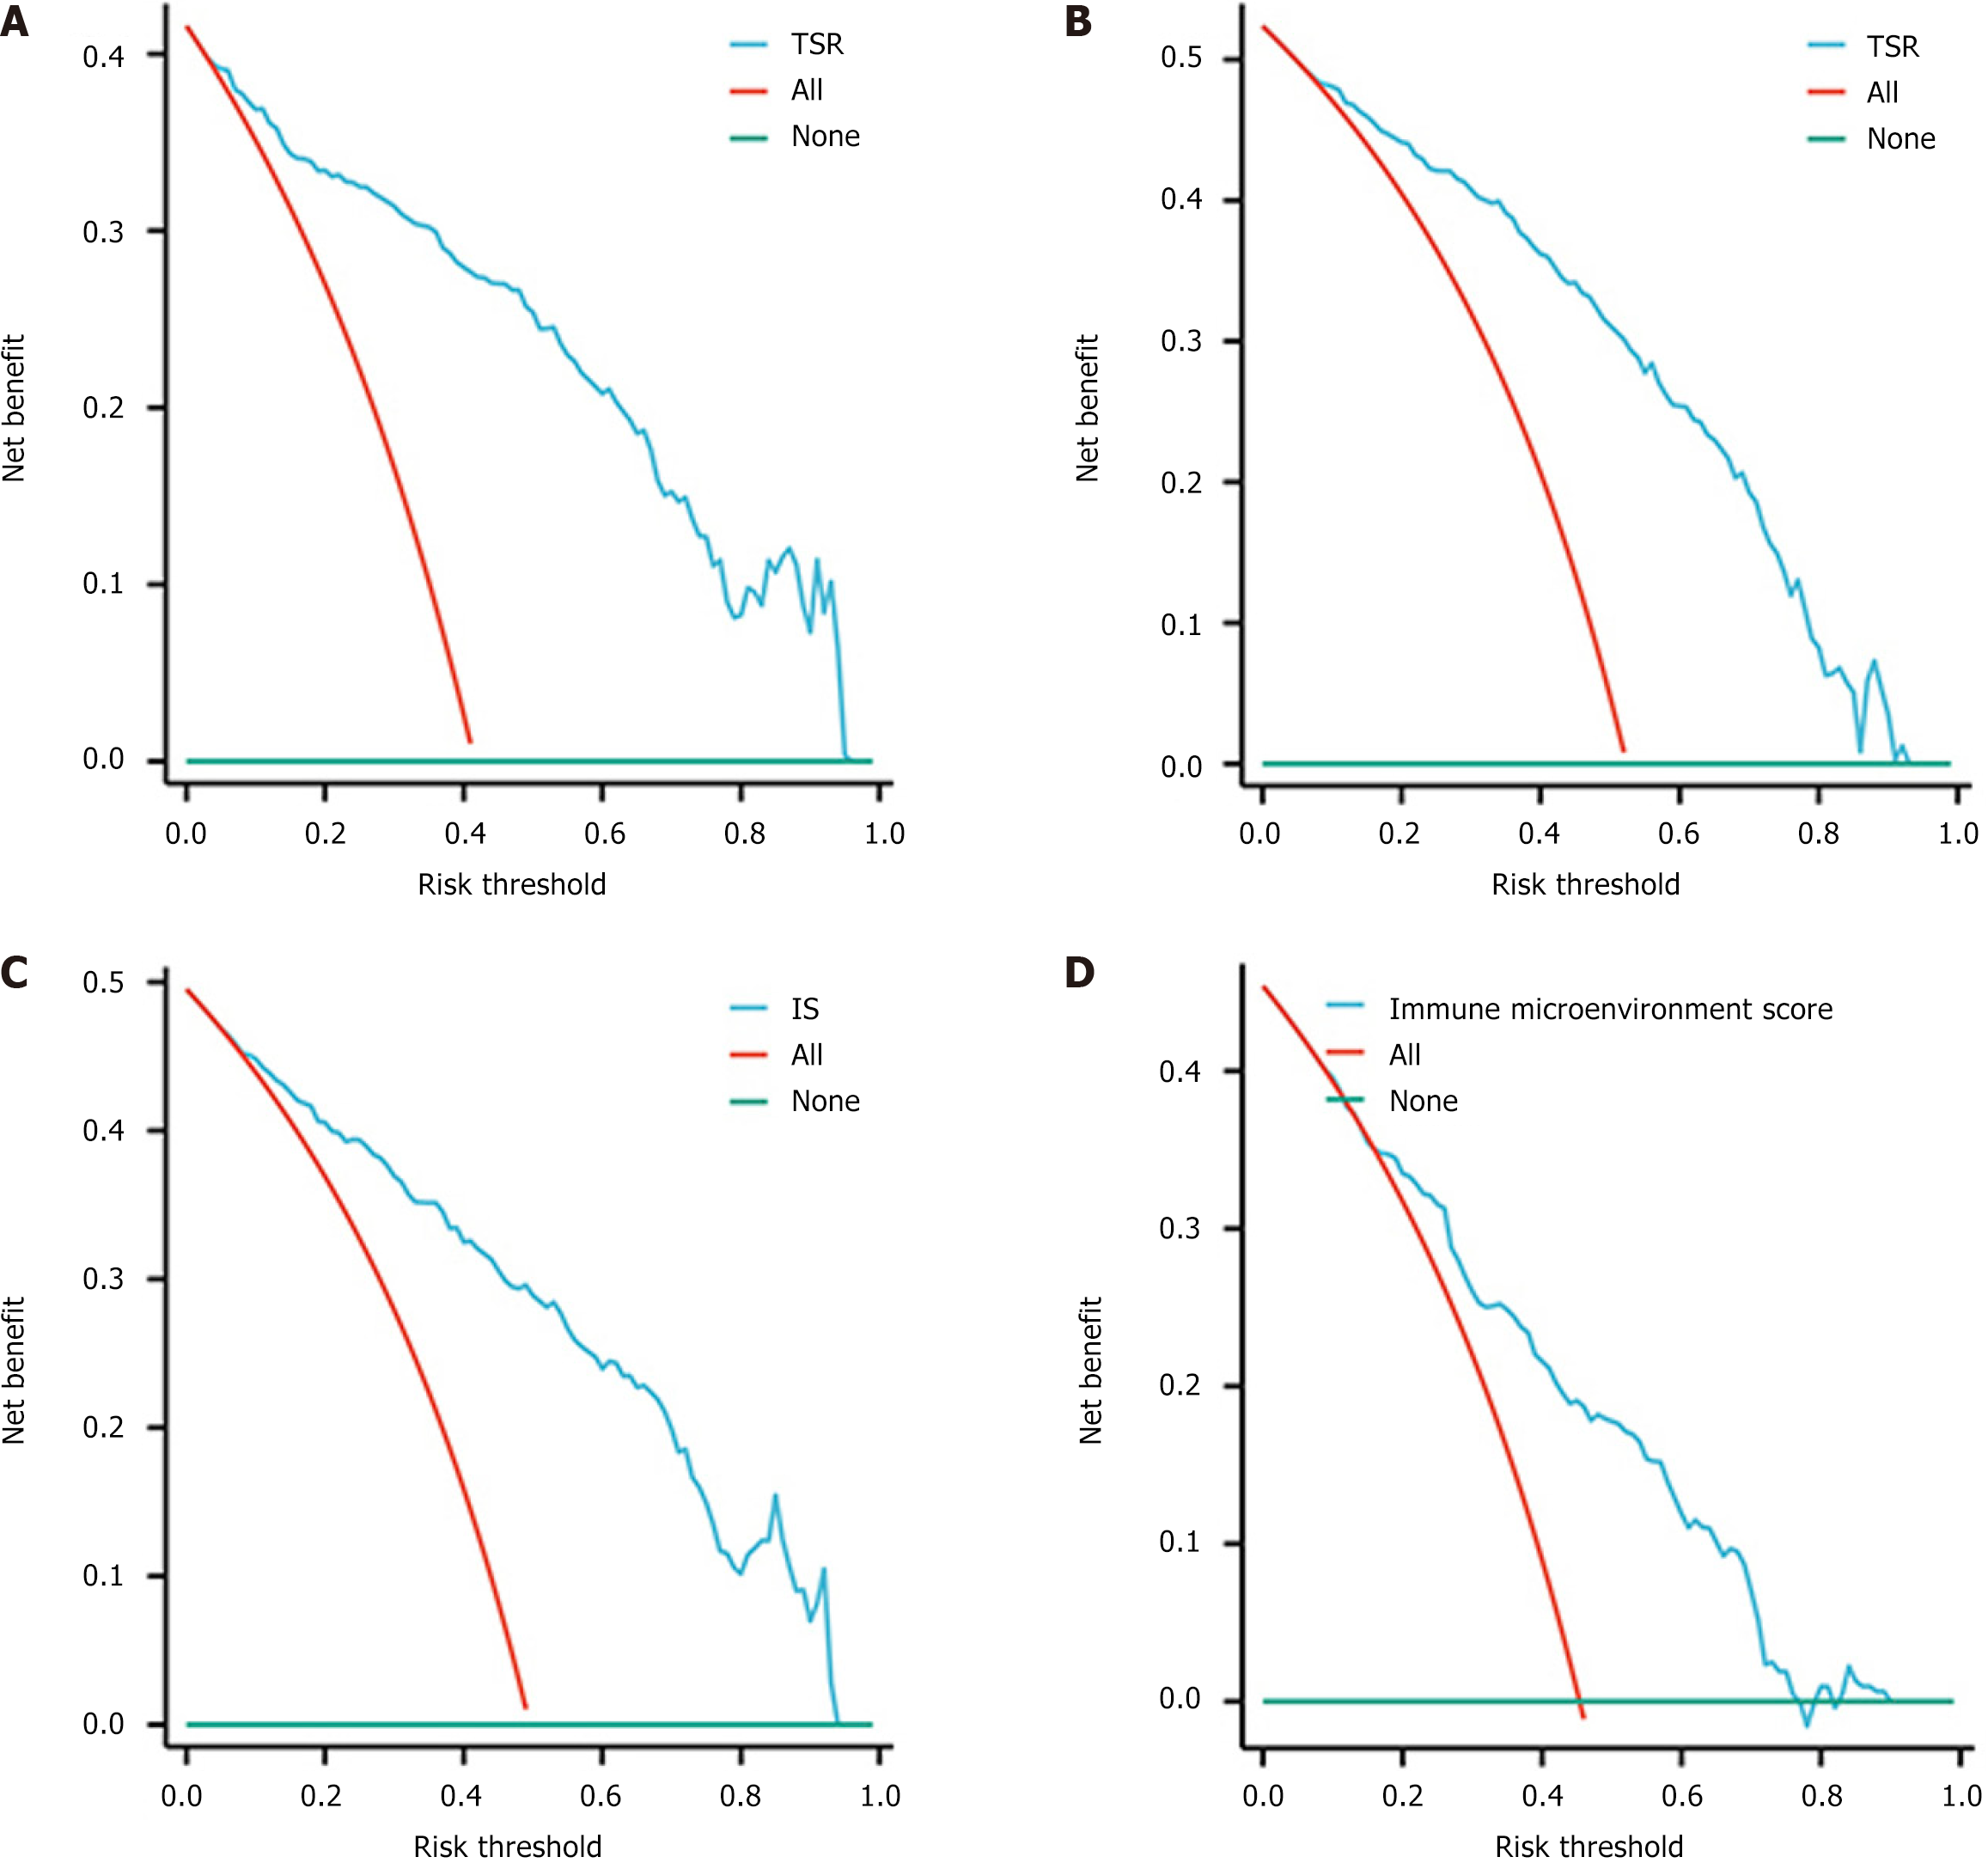
Model evaluation: To evaluate the models’ predictive accuracy, receiver operating characteristic (ROC) curves were generated for each one, and the AUC values were calculated. Additionally, we utilized decision curve analysis (DCA) curves and calibration curves to assess the joint model’s net clinical benefit and goodness of fit.
The data underwent statistical evaluation utilizing Statistical Package for Social Sciences version 30.0.0 (https://www.ibm.com/products/spss-statistics) alongside R statistical software (version 4.2.2 R, https://www.r-project.org/). The Kolmogorov-Smirnov test was employed to verify the normality of the data. Data that adhered to a normal distribution are expressed as the mean ± SD, whereas those that did not fit a normal distribution are indicated by the median along with the upper and lower quartiles. To compare the data, an independent samples t-test was used for data with a normal distribution and equal variance, while a Mann-Whitney U test was utilized for those with skewed distributions or unequal variance. Multivariate logistic regression analysis was used to identify independent predictors to assist in the development of the prediction model and the creation of the nomogram. Furthermore, the AUC was calculated to evaluate the model's capability to differentiate between various classes. A DCA curve was generated to assess and compare the clinical usefulness of the model. A P value of less than 0.05 indicated a statistically significant difference.
A total of 315 patients were included in the current study. The statistical analysis indicated that there were no significant differences in the clinical characteristics between the training and validation groups (Table 1).
| Variable | Training set (n = 220) | Validation set (n = 95) | t-test/Z/χ2 value | P value |
| Sex | 1.9223 | 0.166 | ||
| F | 90 | 31 | ||
| M | 130 | 64 | ||
| Age | 2.9513 | 0.229 | ||
| ≤ 50 years | 24 | 7 | ||
| 51-65 years | 109 | 41 | ||
| > 65 years | 87 | 47 | ||
| pT stage | 5.8273 | 0.120 | ||
| T1 | 5 | 1 | ||
| T2 | 41 | 29 | ||
| T3 | 150 | 55 | ||
| T4 | 24 | 10 | ||
| pN stage | 2.9333 | 0.231 | ||
| N0 | 62 | 36 | ||
| N1 | 71 | 26 | ||
| N2 | 87 | 33 | ||
| TP | 65.14 (61.60, 69.66) | 65.30 (61.60) | -0.3752 | 0.707 |
| ALB | 38.55 (35.95, 41.65) | 38.40 (36.02, 40.97) | -0.6092 | 0.543 |
| ALP | 76.00 (61.27, 89.00) | 76.00 (65.20, 88.00) | -0.7362 | 0.462 |
| UREA | 5.33 (4.46, 6.43) | 5.48 (4.35, 6.46) | -0.4562 | 0.649 |
| CREA | 62.50 (53.53, 71.03) | 64.40 (56.00, 72.50) | -1.2812 | 0.200 |
| UA | 269.73 (229.00, 331.75) | 265.00 (221.00, 314.00) | -0.8512 | 0.395 |
| TC, mean ± SD | 4.11 ± 2.47 | 7.22 ± 31.31 | -1.4691 | 0.143 |
| TG | 1.18 (0.93, 1.53) | 1.25 (0.92, 1.60) | -0.6002 | 0.549 |
| HDL-C | 0.95 (0.83, 1.11) | 0.97 (0.79, 1.15) | -0.2382 | 0.812 |
| LDL-C | 2.32 (1.90, 2.82) | 2.41 (1.77, 2.94) | -0.0422 | 0.967 |
| FBG | 2.96 (2.16, 3.57) | 3.02 (2.52, 3.71) | -0.9642 | 0.335 |
| D-dimer | 2.02 (0.75, 3.27) | 2.13 (0.93, 3.23) | -0.5052 | 0.614 |
| WBC | 5.75 (4.70, 7.10) | 5.70 (4.70, 7.00) | -0.2182 | 0.828 |
| NEUT | 3.26 (2.49, 4.48) | 3.29 (2.54, 4.59) | -0.0042 | 0.997 |
| Lym | 1.67 (1.14, 2.11) | 1.59 (1.16, 2.07) | -0.4182 | 0.676 |
| M | 0.46 (0.34, 0.56) | 0.45 (0.37, 0.54) | -0.1582 | 0.875 |
| E | 0.10 (0.06, 0.17) | 0.11 (0.06, 0.18) | -0.0202 | 0.984 |
| B | 0.03 (0.02, 0.04) | 0.02 (0.01, 0.04) | -1.3532 | 0.176 |
| RBC | 4.38 (3.96, 4.80) | 4.46 (4.06, 4.81) | -0.4462 | 0.656 |
| HB | 132.00 (117.25, 147.00) | 134.00 (121.00, 146.00) | -0.7342 | 0.463 |
| PLT | 208.00 (167.25, 251.00) | 204.00 (163.00, 248.00) | -0.2942 | 0.769 |
| BMI | 23.05 (20.82, 24.68) | 22.61 (20.81, 24.61) | -0.5722 | 0.568 |
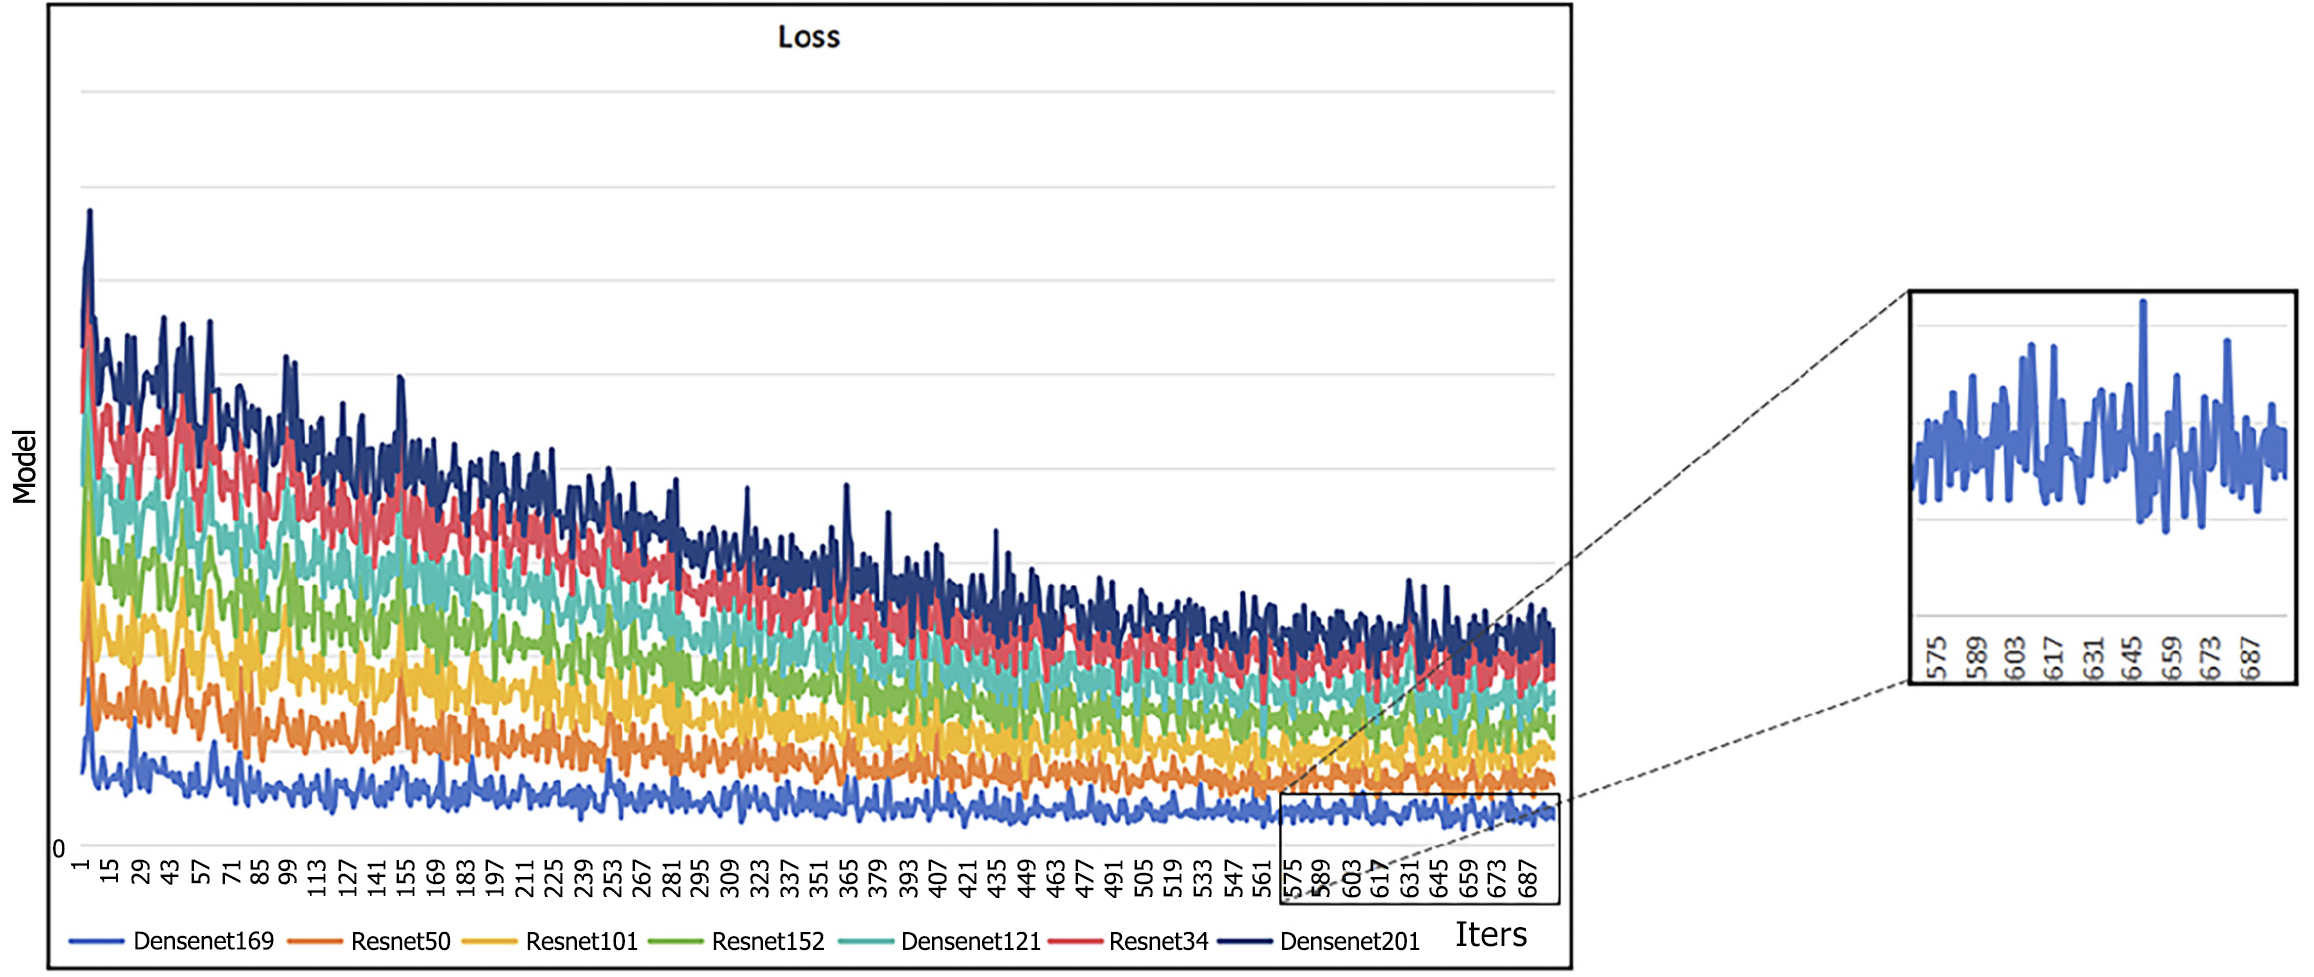
Two-dimensional ROIs with the largest cross-sectional areas were chosen, and different deep learning models were utilized for both pre-training and external validation. The assessment of these models showed that DenseNet-121 and DenseNet-169 demonstrated the best overall performance in the external validation dataset, as reflected by the minimum loss value. Furthermore, the illustrated graph demonstrates that both models exhibited minimal fluctuations. These findings indicate that DensNet-169 exhibits a reduced propensity for training errors and achieves quicker convergence in comparison to other CNN models (Figure 4). The ROIs in CT images, specifically the areas of focus for CNN, are visualized in Figure 5 using Grad-CAM. As observed from the findings presented in Figure 5, compared to other models, DenseNet169 demonstrated a stronger ability to focus on the most critical regions within the tumor.
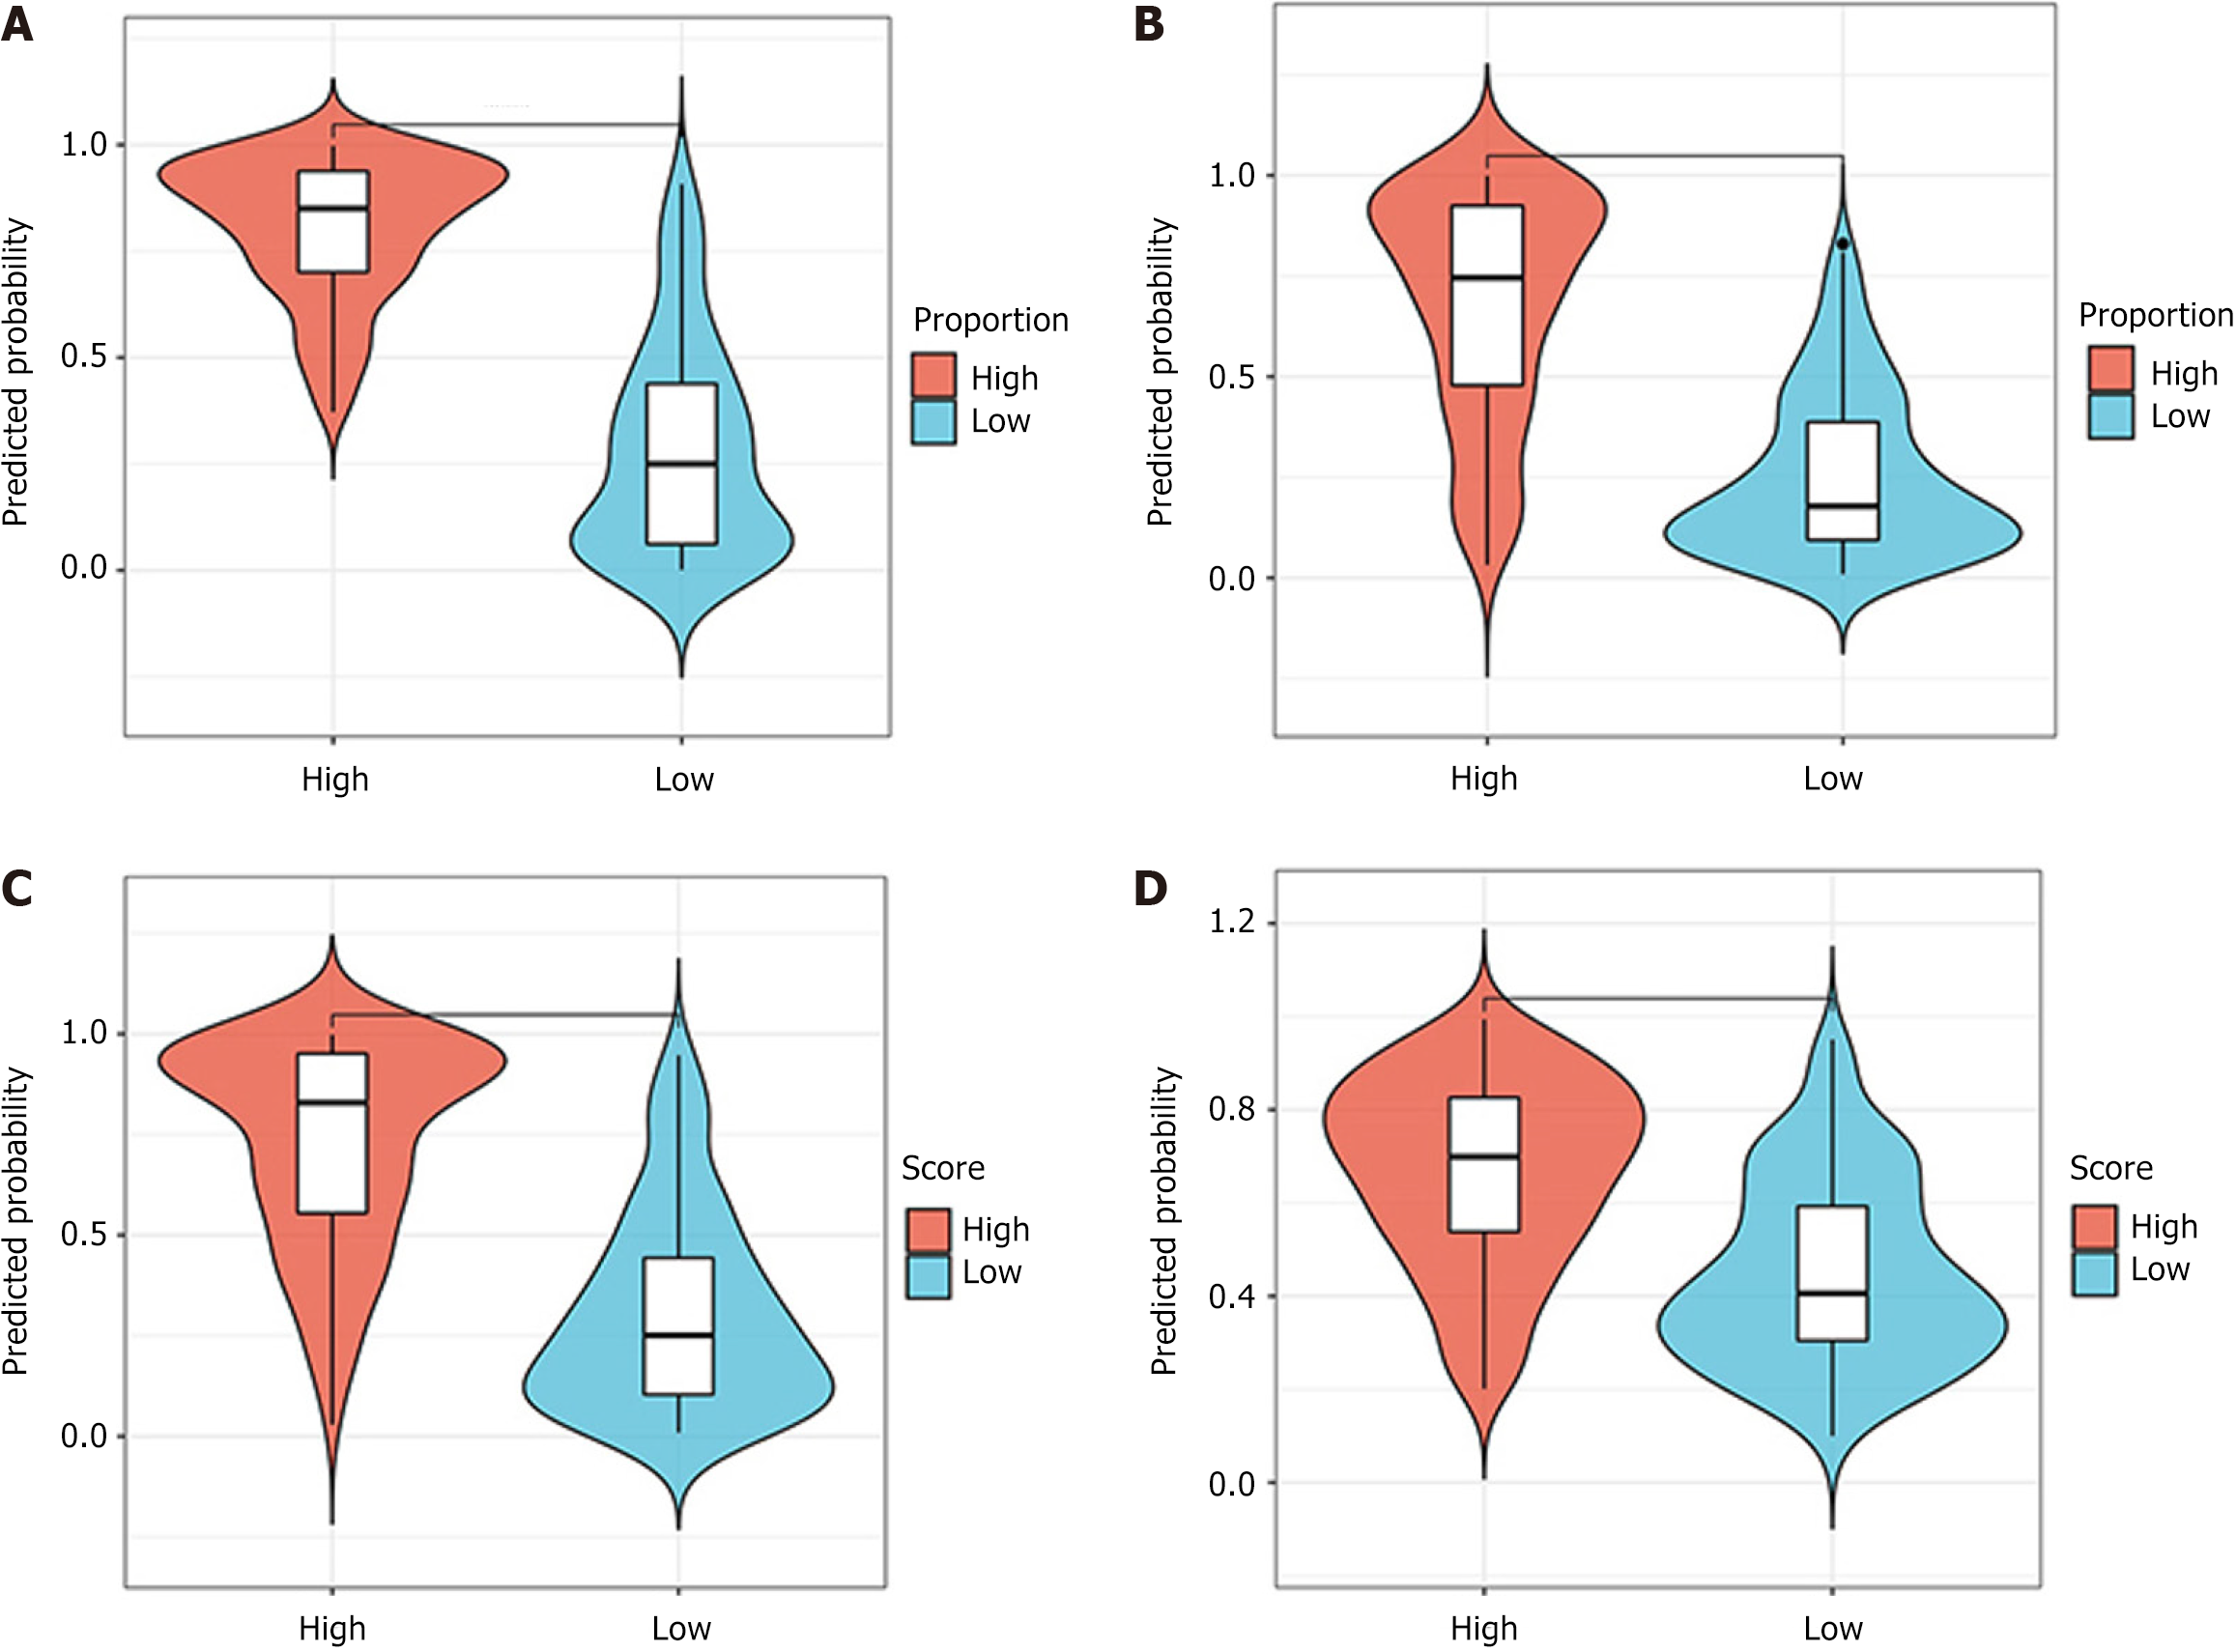
ROC curve: The predictive performance of the models was assessed using ROC analysis. The DenseNet-169 model was chosen as the expected TSR DL model, with an AUC value of 0.939 [95% confidence interval (CI): 0.908-0.970] for the training set and 0.892 (95%CI: 0.828-0.957) for the validation set (Figure 6A). The TILs prediction model, which employed DenseNet-121, achieved an AUC of 0.86 (95%CI: 0.815-0.911) for the training set and an AUC of 0.851 (95%CI: 0.76-0.933) for the validation set, as shown in Figure 6B. Similarly, DenseNet-121 was identified as the best model for predicting high and low IS scores, exhibiting AUC values of 0.885 (95%CI: 0.842-0.928) for the training set and 0.852 (95%CI: 0.775-0.928) for the validation set (Figure 6C). DenseNet-169 was identified as the best model for predicting high and low TIME scores, exhibiting AUC values of 0.780 (95%CI: 0.718-0.841) for the training set and 0.772 (95%CI: 0.674-0.870) for the validation set (Figure 6D). The specific performance of each model is shown in Table 2. In addition, Figure 7 (violin plot) displays the projected probability distributions in the four models, emphasizing the significant difference between the high score group and the low score group. This observation highlights the effectiveness of the predictive model in accurately classifying and detecting variations in the immune microenvironment within CT images with enhanced precision.
| Number | Model | ACC | AUC | 95%CI | Sensitivity | Specificity | PPV | NPV | Precision | Recall | F1 | Threshold | Cohort |
| 0 | DenseNet-121 | 0.741 | 0.797 | 0.7383-0.8556 | 0.707 | 0.769 | 0.714 | 0.762 | 0.714 | 0.707 | 0.711 | 0.520 | Train |
| 1 | DenseNet-121 | 0.800 | 0.759 | 0.6502-0.8676 | 0.705 | 0.882 | 0.838 | 0.776 | 0.838 | 0.705 | 0.765 | 0.407 | Test |
| 2 | DenseNet-169 | 0.709 | 0.780 | 0.7185-0.8406 | 0.768 | 0.661 | 0.650 | 0.777 | 0.650 | 0.768 | 0.704 | 0.385 | Train |
| 3 | DenseNet-169 | 0.768 | 0.772 | 0.6741-0.8696 | 0.682 | 0.834 | 0.789 | 0.754 | 0.789 | 0.682 | 0.732 | 0.541 | Test |
| 4 | DenseNet-201 | 0.718 | 0.765 | 0.7018-0.8274 | 0.495 | 0.901 | 0.803 | 0.686 | 0.803 | 0.495 | 0.612 | 0.591 | Train |
| 5 | DenseNet-201 | 0.768 | 0.737 | 0.6305-0.8432 | 0.636 | 0.882 | 0.824 | 0.738 | 0.824 | 0.636 | 0.718 | 0.586 | Test |
| 6 | ResNet-101 | 0.786 | 0.852 | 0.8032-0.9011 | 0.859 | 0.727 | 0.720 | 0.863 | 0.720 | 0.859 | 0.783 | 0.432 | Train |
| 7 | ResNet-101 | 0.737 | 0.752 | 0.6503-0.8541 | 0.636 | 0.824 | 0.757 | 0.724 | 0.757 | 0.636 | 0.691 | 0.446 | Test |
| 8 | ResNet-152 | 0.732 | 0.816 | 0.7603-0.8718 | 0.869 | 0.620 | 0.652 | 0852 | 0.652 | 0.869 | 0.745 | 0.336 | Train |
| 9 | ResNet-152 | 0.737 | 0.736 | 0.6272-0.8438 | 0.614 | 0.843 | 0.771 | 0.717 | 0.771 | 0.614 | 0.684 | 0.501 | Test |
| 10 | ResNet-34 | 0.782 | 0.860 | 0.8120-0.9072 | 0.808 | 0.760 | 0.734 | 0.829 | 0.734 | 0.808 | 0.769 | 0.444 | Train |
| 11 | ResNet-34 | 0.747 | 0.741 | 0.6344-0.8474 | 0.705 | 0.784 | 0.738 | 0.755 | 0.738 | 0.705 | 0.721 | 0.498 | Test |
| 12 | ResNet-50 | 0.795 | 0.863 | 0.8144-0.9120 | 0.828 | 0.769 | 0.745 | 0.845 | 0.745 | 0.828 | 0.785 | 0.464 | Train |
| 13 | ResNet-50 | 0.747 | 0.754 | 0.6491-0.8598 | 0.614 | 0.863 | 0.794 | 0.721 | 0.794 | 0.614 | 0.692 | 0.501 | Test |
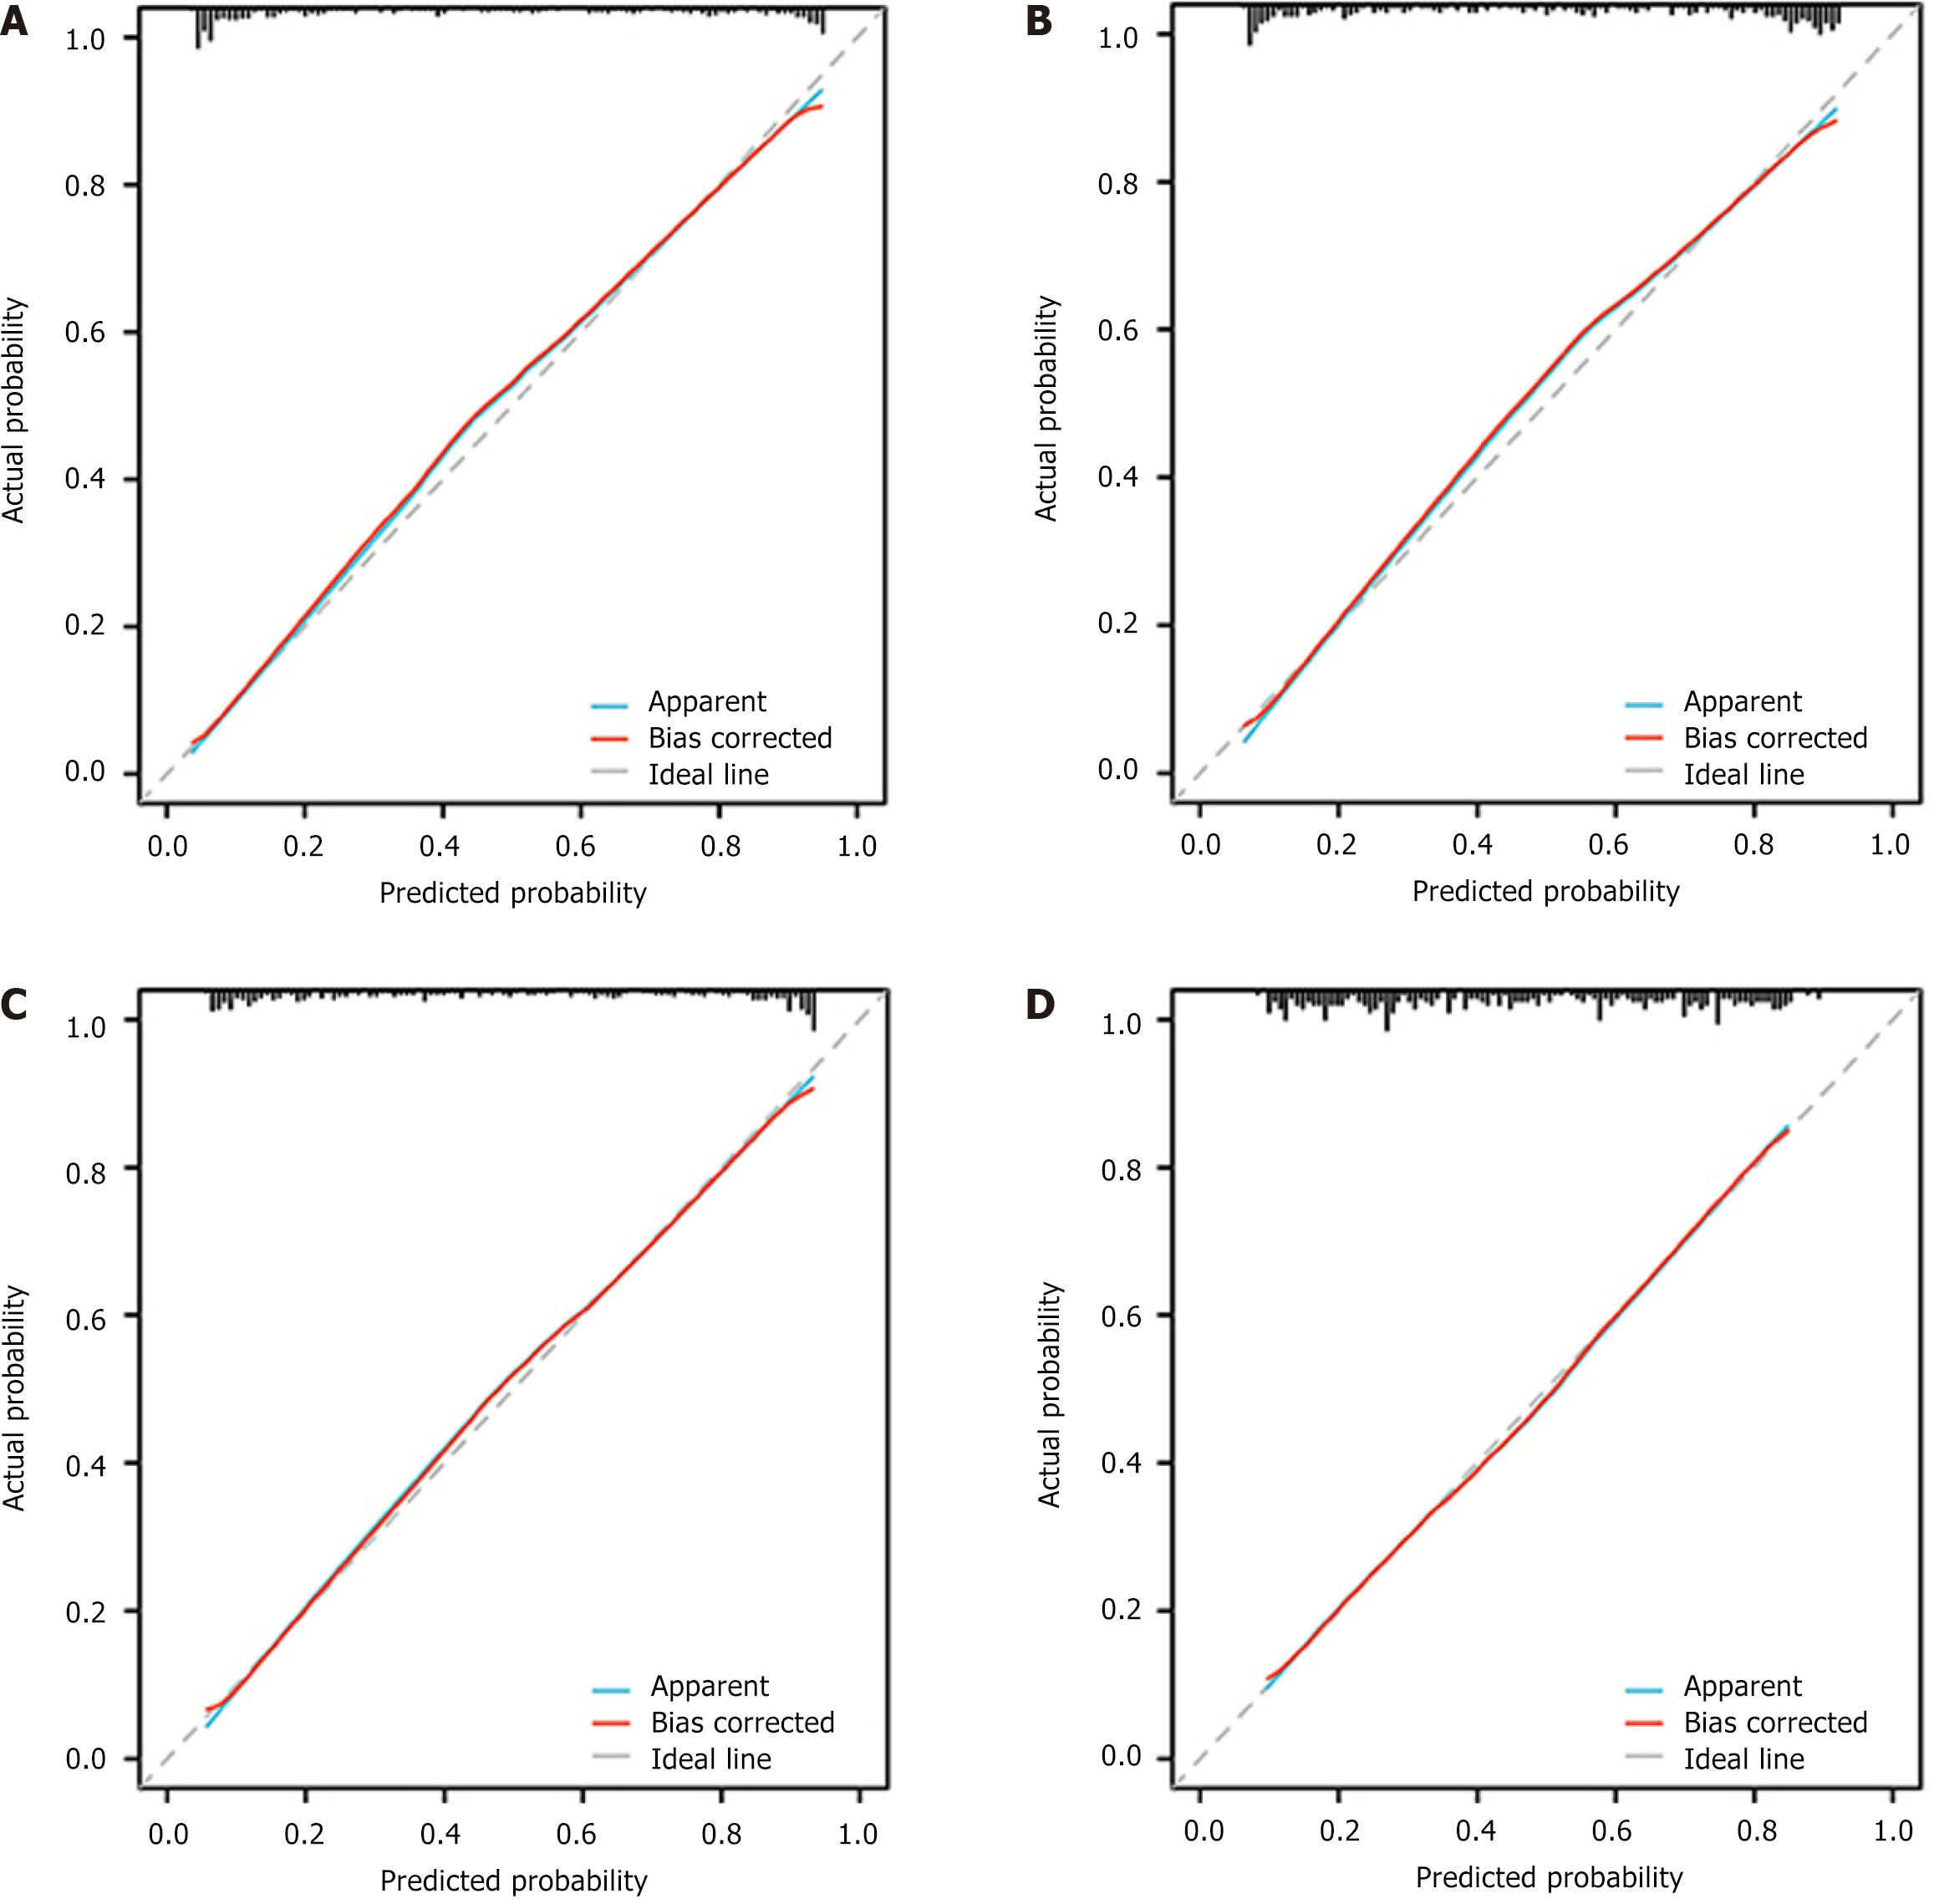
DCA and calibration curves: Upon analyzing the DCA curves, it was evident that all four models demonstrated a positive clinical utility. The calibration curves demonstrated a robust correlation among all four models, indicating their ability to accurately predict labeling (Figures 8 and 9).
The present study suggests that radiomics features extracted from CT images may potentially contribute to predicting the immune microenvironment of CRC patients prior to surgery, although further validation is required to confirm the robustness of this approach. To the best of our knowledge, this is the first radiomics study to include TSR, TILs, and IS in order to predict the preoperative TIME in CRC.
Previous research has shown that radiomics is capable of predicting various key factors during the preoperative period, thus enhancing the assessment and outcomes of immunotherapy for patients. In this regard, Cai et al[34] used MRI-derived radiomic features to evaluate the tumor response (TSR) in rectal cancer prior to surgery. Their results indicate that the radiomics features surpassed the apparent diffusion coefficient in terms of accurately differentiating the TSR in rectal cancer. Similarly, Meng et al[35] employed an XGBoost classifier that combined CT and MRI radiomics to forecast the TSR and improve patient risk classification in cases of pancreatic ductal adenocarcinoma. Notably, our study achieved an AUC of 0.892 for the TSR model, suggesting that our findings align with earlier investigations.
In addition, Li et al[36] utilized a preoperative T2-weighted MRI radiomics model to effectively predict the survival outcomes of glioma patients, as well as assess the extent of macrophage infiltration before surgery. Sun et al[37] developed a radiomics signature consisting of eight variables to identify CD8+ T cells, which was subsequently validated against the gene expression signature of CD8+ T cells in the Cancer Genome Atlas dataset, resulting in an AUC value of 0.67. This marker showcased its capacity to differentiate between inflammatory and immune wild-type tumors in groups of individuals with presumed immunophenotypes. In addition, three radiomics features were selected in the study of breast cancer to construct a prognostic radiomics model for TILs[38]. In contrast to analogous research endeavors, our developed model exhibited notably enhanced efficacy within the validation dataset, evidenced by an AUC metric of 0.790. It is our conviction that leveraging a DL framework, specifically employing the DesenNet-121 algorithm, has the potential to markedly augment the prognostic accuracy concerning TILs. Consequently, this advancement suggests that in forthcoming clinical practices, medical professionals could ascertain insights into the TME immune cell infiltration profiles of CRC patients prior to surgical intervention.
In addition to the above, Xue et al[31] developed a model to predict IS in CRC patients using multimodal MRI and applying an MR-radiomics methodology. Herein, Spearman correlation analysis, as well as the Gradient Boosting Decision Tree algorithm, was used to determine the most influential features, resulting in an AUC value of 0.768. This study also utilized CT, a widely accessible and cost-effective imaging modality that accommodates a wide range of subjects. Accordingly, the DL model was utilized to enable the accurate prediction of IS. Notably, the AUC of 0.851 in the validation set exceeded the findings of previous studies. The integration of the aforementioned crucial immune indicators in a simultaneous manner resulted in a favorable model efficacy, as demonstrated by an AUC value of 0.772. Based on this finding, we proposed a hypothesis regarding the possibility of combining the three immunological indicators to gain a more comprehensive understanding of DesenNet-169. The corresponding findings offered a more thorough representation of the TIME in patients with CRC. The model’s performance was confirmed by the satisfactory results obtained from the DCA and calibration curves. These findings are highly significant for clinicians, as they can assist in the preoperative evaluation and the development of immunotherapy strategies. However, characterizing the biological aspects of the TME cannot be sufficiently achieved by relying on a single or limited set of immune microenvironment indicators. Therefore, in order to reflect the situation of the TME as comprehensively as possible, the development and validation of integrated models that incorporate more effective indicators are urgently needed[39]. In this study, we chose Densnet-121 and Densnet-169 as the models based on their AUC values in the validation set and the closeness of the AUC values between the training and validation sets. However, this approach may have certain limitations, such as the observation that the accuracy in the validation set was higher than that in the training set (Table 2). This may be due to the data split between the training and validation sets, where the distribution of a few outlier samples could affect the model’s parameter performance in the training set. Future studies could involve multiple data splits or 10-fold cross-validation to enhance the scientific and objective nature of the model and address this issue.
The extraction of radiomic features inherently exhibits sensitivity to specific instrument parameters[40]. Essentially, the selection of CT machines and imaging techniques affects the representation of these characteristics, with texture attributes being especially dependent on scanning parameters[41]. Accordingly, this investigation solely utilized images from one CT scanner to guarantee uniformity. To ensure consistency, only images possessing the same scanning parameters and a slice thickness of 5 mm were used in the stages of feature extraction and post-processing. Multiple factors can impact the stability of functional performance, particularly the ROI, especially concerning its size and extent. Subsequently, the segmentation outcomes were corrected and reviewed by two clinical radiologists experienced in abdominal imaging to ensure inter-rater reliability. In our endeavor to characterize the TIME heterogeneity among CRC lesions, we focused on extracting DL features directly from the textures of CT images. In the study by Pan et al[42], a joint model was established by integrating ML features and DL features derived from two-dimensional CT images. Specifically, based on manually annotated ROIs, the ROIs were expanded to surrounding areas by 10 and 20 pixels to construct a DL model, namely ResNet-19[42]. This approach also demonstrated considerable predictive potential. The shape features related to the geometric attributes of the ROI, along with first-order statistical features that describe the distribution of single pixel values, also provided additional support to our model. As the accuracy of imaging technologies improves, issues concerning the stability of radiomic features are expected to gradually resolve[43]. On the other hand, although the characterization of tumor heterogeneity still relies on molecular and cellular biology, the evolution of imaging modalities has shown great potential in this regard[44]. However, further research is needed to reliably detect different tissue textures and establish connections with singular molecular causes, such as tumor-associated immune cells, which were the focus of this study.
The present study utilized ten DL models to perform visual training and evaluate factors such as specificity, sensitivity, and potential overfitting. Finally, the DenseNet model was selected, as it shares a fundamental concept with ResNet but forms dense connections between previous and subsequent layers[45,46]. DenseNet achieves feature reuse by establishing connections between features across channels, resulting in superior performance compared to ResNet employing fewer parameters and lower computational cost[47]. In accordance with previous investigations employing DL-based CT radiomics in CRC, our findings may contribute to the understanding of TME information, offering certain benefits. From this perspective, Wu et al[48] employed CNN models to predict the presence of KRAS mutation non-invasively, while Wei et al[49] employed ResNet-10 to predict the response to chemotherapy in patients with colorectal liver metastases. The study utilized a large sample size of 1028 cases and employed the CNN + recurrent neural network model to predict the initial response to treatment in metastatic CRC. Accordingly, the study yielded a C-index value of 0.649. However, unlike our findings, these studies do not offer personalized information on the TME, the integration of different types of data modalities, and a comprehensive understanding of the TIME in CRC patients, even though they may offer certain insights into the patient’s reaction to chemotherapeutics. Thus, the biological characteristics of the TIME cannot be adequately represented by individual indicators. As a result, there is a growing inclination towards the development of a thorough evaluation system that includes various indicators to fully describe the TME[50,51].
Although we recognize the potential clinical importance of our findings, it is crucial to acknowledge the presence of certain limitations and unexplored aspects that require further investigation in the future. First, there is a lack of adequate external validation, which limits the availability of easily accessible single-center retrospective studies. Therefore, there is a need for comprehensive, standardized prospective studies that include patient groups from multiple centers in future research efforts. Furthermore, this study did not provide a thorough classification of TSR and TILs. Consequently, additional investigations are necessary to elucidate the complex and extensive roles of TILs, specifically B cells, in combination with thorough analyses of cellular components within the tumor stroma. Furthermore, the research revealed that the procedure of image segmentation and pathology slice evaluation for radiomics was significantly time-intensive. The model exhibited low reproducibility and the findings of the study lacked generalizability. Therefore, it is essential to prioritize the advancement of automated image segmentation techniques in order to establish a consistent and standardized study process. Moreover, the inclusion of external validation is crucial to ensure the strength and dependability of the results.
This study developed a DL-based radiomics prediction model using preoperative CT images to non-invasively evaluate TSR, TILs, and IS in CRC patients. The integrated model demonstrated potential for assessing the TIME, offering a novel tool to guide immunotherapy strategies and improve personalized treatment planning in CRC management.
We thank Gansu Provincial Hospital, Lanzhou University, and Gansu University of Chinese Medicine for their guidance and advice during the implementation of this project.
| 1. | Siegel RL, Giaquinto AN, Jemal A. Cancer statistics, 2024. CA Cancer J Clin. 2024;74:12-49. [RCA] [PubMed] [DOI] [Full Text] [Cited by in Crossref: 2279] [Cited by in RCA: 4723] [Article Influence: 4723.0] [Reference Citation Analysis (3)] |
| 2. | Morgan E, Arnold M, Gini A, Lorenzoni V, Cabasag CJ, Laversanne M, Vignat J, Ferlay J, Murphy N, Bray F. Global burden of colorectal cancer in 2020 and 2040: incidence and mortality estimates from GLOBOCAN. Gut. 2023;72:338-344. [RCA] [PubMed] [DOI] [Full Text] [Cited by in Crossref: 511] [Cited by in RCA: 926] [Article Influence: 463.0] [Reference Citation Analysis (1)] |
| 3. | Micevic G, Bosenberg MW, Yan Q. The Crossroads of Cancer Epigenetics and Immune Checkpoint Therapy. Clin Cancer Res. 2023;29:1173-1182. [RCA] [PubMed] [DOI] [Full Text] [Cited by in Crossref: 6] [Cited by in RCA: 36] [Article Influence: 18.0] [Reference Citation Analysis (0)] |
| 4. | Sharma P, Siddiqui BA, Anandhan S, Yadav SS, Subudhi SK, Gao J, Goswami S, Allison JP. The Next Decade of Immune Checkpoint Therapy. Cancer Discov. 2021;11:838-857. [RCA] [PubMed] [DOI] [Full Text] [Cited by in Crossref: 124] [Cited by in RCA: 479] [Article Influence: 119.8] [Reference Citation Analysis (0)] |
| 5. | Ganesh K, Stadler ZK, Cercek A, Mendelsohn RB, Shia J, Segal NH, Diaz LA Jr. Immunotherapy in colorectal cancer: rationale, challenges and potential. Nat Rev Gastroenterol Hepatol. 2019;16:361-375. [RCA] [PubMed] [DOI] [Full Text] [Cited by in Crossref: 1114] [Cited by in RCA: 1229] [Article Influence: 204.8] [Reference Citation Analysis (0)] |
| 6. | Yang C, Zhao L, Lin Y, Wang S, Ye Y, Shen Z. Biomarkers for immune checkpoint inhibitors in colorectal cancer: recent advances and future perspectives. Cancer Biol Med. 2023;20:633-639. [RCA] [PubMed] [DOI] [Full Text] [Reference Citation Analysis (0)] |
| 7. | Giraldo NA, Sanchez-Salas R, Peske JD, Vano Y, Becht E, Petitprez F, Validire P, Ingels A, Cathelineau X, Fridman WH, Sautès-Fridman C. The clinical role of the TME in solid cancer. Br J Cancer. 2019;120:45-53. [RCA] [PubMed] [DOI] [Full Text] [Full Text (PDF)] [Cited by in Crossref: 185] [Cited by in RCA: 479] [Article Influence: 68.4] [Reference Citation Analysis (0)] |
| 8. | van Pelt GW, Sandberg TP, Morreau H, Gelderblom H, van Krieken JHJM, Tollenaar RAEM, Mesker WE. The tumour-stroma ratio in colon cancer: the biological role and its prognostic impact. Histopathology. 2018;73:197-206. [RCA] [PubMed] [DOI] [Full Text] [Cited by in Crossref: 55] [Cited by in RCA: 106] [Article Influence: 15.1] [Reference Citation Analysis (0)] |
| 9. | Kramer CJH, Vangangelt KMH, van Pelt GW, Dekker TJA, Tollenaar RAEM, Mesker WE. The prognostic value of tumour-stroma ratio in primary breast cancer with special attention to triple-negative tumours: a review. Breast Cancer Res Treat. 2019;173:55-64. [RCA] [PubMed] [DOI] [Full Text] [Full Text (PDF)] [Cited by in Crossref: 44] [Cited by in RCA: 72] [Article Influence: 10.3] [Reference Citation Analysis (0)] |
| 10. | Wang K, Ma W, Wang J, Yu L, Zhang X, Wang Z, Tan B, Wang N, Bai B, Yang S, Liu H, Zhu S, Cheng Y. Tumor-stroma ratio is an independent predictor for survival in esophageal squamous cell carcinoma. J Thorac Oncol. 2012;7:1457-1461. [RCA] [PubMed] [DOI] [Full Text] [Cited by in Crossref: 99] [Cited by in RCA: 120] [Article Influence: 10.0] [Reference Citation Analysis (0)] |
| 11. | Rozek LS, Schmit SL, Greenson JK, Tomsho LP, Rennert HS, Rennert G, Gruber SB. Tumor-Infiltrating Lymphocytes, Crohn's-Like Lymphoid Reaction, and Survival From Colorectal Cancer. J Natl Cancer Inst. 2016;108. [RCA] [PubMed] [DOI] [Full Text] [Cited by in Crossref: 120] [Cited by in RCA: 167] [Article Influence: 18.6] [Reference Citation Analysis (0)] |
| 12. | Loupakis F, Depetris I, Biason P, Intini R, Prete AA, Leone F, Lombardi P, Filippi R, Spallanzani A, Cascinu S, Bonetti LR, Maddalena G, Valeri N, Sottoriva A, Zapata L, Salmaso R, Munari G, Rugge M, Dei Tos AP, Golovato J, Sanborn JZ, Nguyen A, Schirripa M, Zagonel V, Lonardi S, Fassan M. Prediction of Benefit from Checkpoint Inhibitors in Mismatch Repair Deficient Metastatic Colorectal Cancer: Role of Tumor Infiltrating Lymphocytes. Oncologist. 2020;25:481-487. [RCA] [PubMed] [DOI] [Full Text] [Cited by in Crossref: 86] [Cited by in RCA: 90] [Article Influence: 18.0] [Reference Citation Analysis (0)] |
| 13. | Corti F, Lonardi S, Intini R, Salati M, Fenocchio E, Belli C, Borelli B, Brambilla M, Prete AA, Quarà V, Antista M, Fassan M, Morano F, Spallanzani A, Ambrosini M, Curigliano G, de Braud F, Zagonel V, Fucà G, Pietrantonio F. The Pan-Immune-Inflammation Value in microsatellite instability-high metastatic colorectal cancer patients treated with immune checkpoint inhibitors. Eur J Cancer. 2021;150:155-167. [RCA] [PubMed] [DOI] [Full Text] [Cited by in Crossref: 74] [Cited by in RCA: 71] [Article Influence: 17.8] [Reference Citation Analysis (0)] |
| 14. | Sun D, Liu J, Zhou H, Shi M, Sun J, Zhao S, Chen G, Zhang Y, Zhou T, Ma Y, Zhao Y, Fang W, Zhao H, Huang Y, Yang Y, Zhang L. Classification of Tumor Immune Microenvironment According to Programmed Death-Ligand 1 Expression and Immune Infiltration Predicts Response to Immunotherapy Plus Chemotherapy in Advanced Patients With NSCLC. J Thorac Oncol. 2023;18:869-881. [RCA] [PubMed] [DOI] [Full Text] [Cited by in Crossref: 13] [Cited by in RCA: 41] [Article Influence: 20.5] [Reference Citation Analysis (0)] |
| 15. | Pagès F, Mlecnik B, Marliot F, Bindea G, Ou FS, Bifulco C, Lugli A, Zlobec I, Rau TT, Berger MD, Nagtegaal ID, Vink-Börger E, Hartmann A, Geppert C, Kolwelter J, Merkel S, Grützmann R, Van den Eynde M, Jouret-Mourin A, Kartheuser A, Léonard D, Remue C, Wang JY, Bavi P, Roehrl MHA, Ohashi PS, Nguyen LT, Han S, MacGregor HL, Hafezi-Bakhtiari S, Wouters BG, Masucci GV, Andersson EK, Zavadova E, Vocka M, Spacek J, Petruzelka L, Konopasek B, Dundr P, Skalova H, Nemejcova K, Botti G, Tatangelo F, Delrio P, Ciliberto G, Maio M, Laghi L, Grizzi F, Fredriksen T, Buttard B, Angelova M, Vasaturo A, Maby P, Church SE, Angell HK, Lafontaine L, Bruni D, El Sissy C, Haicheur N, Kirilovsky A, Berger A, Lagorce C, Meyers JP, Paustian C, Feng Z, Ballesteros-Merino C, Dijkstra J, van de Water C, van Lent-van Vliet S, Knijn N, Mușină AM, Scripcariu DV, Popivanova B, Xu M, Fujita T, Hazama S, Suzuki N, Nagano H, Okuno K, Torigoe T, Sato N, Furuhata T, Takemasa I, Itoh K, Patel PS, Vora HH, Shah B, Patel JB, Rajvik KN, Pandya SJ, Shukla SN, Wang Y, Zhang G, Kawakami Y, Marincola FM, Ascierto PA, Sargent DJ, Fox BA, Galon J. International validation of the consensus Immunoscore for the classification of colon cancer: a prognostic and accuracy study. Lancet. 2018;391:2128-2139. [RCA] [PubMed] [DOI] [Full Text] [Cited by in Crossref: 1567] [Cited by in RCA: 1487] [Article Influence: 212.4] [Reference Citation Analysis (0)] |
| 16. | Mlecnik B, Bindea G, Angell HK, Maby P, Angelova M, Tougeron D, Church SE, Lafontaine L, Fischer M, Fredriksen T, Sasso M, Bilocq AM, Kirilovsky A, Obenauf AC, Hamieh M, Berger A, Bruneval P, Tuech JJ, Sabourin JC, Le Pessot F, Mauillon J, Rafii A, Laurent-Puig P, Speicher MR, Trajanoski Z, Michel P, Sesboüe R, Frebourg T, Pagès F, Valge-Archer V, Latouche JB, Galon J. Integrative Analyses of Colorectal Cancer Show Immunoscore Is a Stronger Predictor of Patient Survival Than Microsatellite Instability. Immunity. 2016;44:698-711. [RCA] [PubMed] [DOI] [Full Text] [Cited by in Crossref: 788] [Cited by in RCA: 757] [Article Influence: 84.1] [Reference Citation Analysis (0)] |
| 17. | Gillies RJ, Kinahan PE, Hricak H. Radiomics: Images Are More than Pictures, They Are Data. Radiology. 2016;278:563-577. [RCA] [PubMed] [DOI] [Full Text] [Full Text (PDF)] [Cited by in Crossref: 4541] [Cited by in RCA: 5556] [Article Influence: 617.3] [Reference Citation Analysis (3)] |
| 18. | Luker GD. Imaging the Immune Tumor Microenvironment to Monitor and Improve Therapy. Radiology. 2021;298:133-134. [RCA] [PubMed] [DOI] [Full Text] [Cited by in Crossref: 2] [Cited by in RCA: 5] [Article Influence: 1.0] [Reference Citation Analysis (0)] |
| 19. | Zu G, Kuang Y, Dong J, Cao Y, Zhang T, Liu M, Luo L, Pei R. Gadolinium(III)-based Polymeric Magnetic Resonance Imaging Agents for Tumor Imaging. Curr Med Chem. 2018;25:2910-2937. [RCA] [PubMed] [DOI] [Full Text] [Cited by in Crossref: 4] [Cited by in RCA: 4] [Article Influence: 0.6] [Reference Citation Analysis (0)] |
| 20. | Zhou C, Zhang YF, Guo S, Wang D, Lv HX, Qiao XN, Wang R, Chang DH, Zhao LM, Zhou FH. Multiparametric MRI radiomics in prostate cancer for predicting Ki-67 expression and Gleason score: a multicenter retrospective study. Discov Oncol. 2023;14:133. [RCA] [PubMed] [DOI] [Full Text] [Cited by in RCA: 7] [Reference Citation Analysis (0)] |
| 21. | Wang R, Dai W, Gong J, Huang M, Hu T, Li H, Lin K, Tan C, Hu H, Tong T, Cai G. Development of a novel combined nomogram model integrating deep learning-pathomics, radiomics and immunoscore to predict postoperative outcome of colorectal cancer lung metastasis patients. J Hematol Oncol. 2022;15:11. [RCA] [PubMed] [DOI] [Full Text] [Full Text (PDF)] [Cited by in Crossref: 3] [Cited by in RCA: 147] [Article Influence: 49.0] [Reference Citation Analysis (0)] |
| 22. | Lambin P, Rios-Velazquez E, Leijenaar R, Carvalho S, van Stiphout RG, Granton P, Zegers CM, Gillies R, Boellard R, Dekker A, Aerts HJ. Radiomics: extracting more information from medical images using advanced feature analysis. Eur J Cancer. 2012;48:441-446. [RCA] [PubMed] [DOI] [Full Text] [Cited by in Crossref: 2415] [Cited by in RCA: 3857] [Article Influence: 296.7] [Reference Citation Analysis (2)] |
| 23. | Fan G, Qin J, Liu H, Liao X. Commentary: Radiomics in oncology: A 10-year bibliometric analysis. Front Oncol. 2022;12:891056. [RCA] [PubMed] [DOI] [Full Text] [Full Text (PDF)] [Cited by in RCA: 5] [Reference Citation Analysis (0)] |
| 24. | Yang L, Dong D, Fang M, Zhu Y, Zang Y, Liu Z, Zhang H, Ying J, Zhao X, Tian J. Can CT-based radiomics signature predict KRAS/NRAS/BRAF mutations in colorectal cancer? Eur Radiol. 2018;28:2058-2067. [RCA] [PubMed] [DOI] [Full Text] [Cited by in Crossref: 120] [Cited by in RCA: 175] [Article Influence: 25.0] [Reference Citation Analysis (0)] |
| 25. | Ma S, Lu H, Jing G, Li Z, Zhang Q, Ma X, Chen F, Shao C, Lu Y, Wang H, Shen F. Deep learning-based clinical-radiomics nomogram for preoperative prediction of lymph node metastasis in patients with rectal cancer: a two-center study. Front Med (Lausanne). 2023;10:1276672. [RCA] [PubMed] [DOI] [Full Text] [Reference Citation Analysis (0)] |
| 26. | Li M, Zhang J, Dan Y, Yao Y, Dai W, Cai G, Yang G, Tong T. A clinical-radiomics nomogram for the preoperative prediction of lymph node metastasis in colorectal cancer. J Transl Med. 2020;18:46. [RCA] [PubMed] [DOI] [Full Text] [Full Text (PDF)] [Cited by in Crossref: 35] [Cited by in RCA: 86] [Article Influence: 17.2] [Reference Citation Analysis (0)] |
| 27. | Shu Z, Fang S, Ding Z, Mao D, Cai R, Chen Y, Pang P, Gong X. MRI-based Radiomics nomogram to detect primary rectal cancer with synchronous liver metastases. Sci Rep. 2019;9:3374. [RCA] [PubMed] [DOI] [Full Text] [Full Text (PDF)] [Cited by in Crossref: 34] [Cited by in RCA: 62] [Article Influence: 10.3] [Reference Citation Analysis (0)] |
| 28. | Giannini V, Rosati S, Defeudis A, Balestra G, Vassallo L, Cappello G, Mazzetti S, De Mattia C, Rizzetto F, Torresin A, Sartore-Bianchi A, Siena S, Vanzulli A, Leone F, Zagonel V, Marsoni S, Regge D. Radiomics predicts response of individual HER2-amplified colorectal cancer liver metastases in patients treated with HER2-targeted therapy. Int J Cancer. 2020;147:3215-3223. [RCA] [PubMed] [DOI] [Full Text] [Cited by in Crossref: 10] [Cited by in RCA: 27] [Article Influence: 5.4] [Reference Citation Analysis (0)] |
| 29. | Dercle L, Lu L, Schwartz LH, Qian M, Tejpar S, Eggleton P, Zhao B, Piessevaux H. Radiomics Response Signature for Identification of Metastatic Colorectal Cancer Sensitive to Therapies Targeting EGFR Pathway. J Natl Cancer Inst. 2020;112:902-912. [RCA] [PubMed] [DOI] [Full Text] [Cited by in Crossref: 61] [Cited by in RCA: 107] [Article Influence: 26.8] [Reference Citation Analysis (0)] |
| 30. | Trabelsi M, Farah F, Zouari B, Jaafoura MH, Kharrat M. An Immunoscore System Based On CD3(+) And CD8(+) Infiltrating Lymphocytes Densities To Predict The Outcome Of Patients With Colorectal Adenocarcinoma. Onco Targets Ther. 2019;12:8663-8673. [RCA] [PubMed] [DOI] [Full Text] [Full Text (PDF)] [Cited by in Crossref: 12] [Cited by in RCA: 28] [Article Influence: 4.7] [Reference Citation Analysis (0)] |
| 31. | Xue K, Liu L, Liu Y, Guo Y, Zhu Y, Zhang M. Radiomics model based on multi-sequence MR images for predicting preoperative immunoscore in rectal cancer. Radiol Med. 2022;127:702-713. [RCA] [PubMed] [DOI] [Full Text] [Cited by in Crossref: 28] [Cited by in RCA: 27] [Article Influence: 9.0] [Reference Citation Analysis (0)] |
| 32. | Lanzi A, Pagès F, Lagorce-Pagès C, Galon J. The consensus immunoscore: toward a new classification of colorectal cancer. Oncoimmunology. 2020;9:1789032. [RCA] [PubMed] [DOI] [Full Text] [Full Text (PDF)] [Cited by in Crossref: 13] [Cited by in RCA: 29] [Article Influence: 5.8] [Reference Citation Analysis (0)] |
| 33. | Galon J, Fox BA, Bifulco CB, Masucci G, Rau T, Botti G, Marincola FM, Ciliberto G, Pages F, Ascierto PA, Capone M. Immunoscore and Immunoprofiling in cancer: an update from the melanoma and immunotherapy bridge 2015. J Transl Med. 2016;14:273. [RCA] [PubMed] [DOI] [Full Text] [Full Text (PDF)] [Cited by in Crossref: 102] [Cited by in RCA: 115] [Article Influence: 12.8] [Reference Citation Analysis (0)] |
| 34. | Cai C, Hu T, Gong J, Huang D, Liu F, Fu C, Tong T. Multiparametric MRI-based radiomics signature for preoperative estimation of tumor-stroma ratio in rectal cancer. Eur Radiol. 2021;31:3326-3335. [RCA] [PubMed] [DOI] [Full Text] [Cited by in Crossref: 5] [Cited by in RCA: 26] [Article Influence: 5.2] [Reference Citation Analysis (0)] |
| 35. | Meng Y, Zhang H, Li Q, Liu F, Fang X, Li J, Yu J, Feng X, Lu J, Bian Y, Shao C. Magnetic Resonance Radiomics and Machine-learning Models: An Approach for Evaluating Tumor-stroma Ratio in Patients with Pancreatic Ductal Adenocarcinoma. Acad Radiol. 2022;29:523-535. [RCA] [PubMed] [DOI] [Full Text] [Cited by in Crossref: 1] [Cited by in RCA: 4] [Article Influence: 1.3] [Reference Citation Analysis (0)] |
| 36. | Li G, Li L, Li Y, Qian Z, Wu F, He Y, Jiang H, Li R, Wang D, Zhai Y, Wang Z, Jiang T, Zhang J, Zhang W. An MRI radiomics approach to predict survival and tumour-infiltrating macrophages in gliomas. Brain. 2022;145:1151-1161. [RCA] [PubMed] [DOI] [Full Text] [Full Text (PDF)] [Cited by in Crossref: 5] [Cited by in RCA: 145] [Article Influence: 48.3] [Reference Citation Analysis (0)] |
| 37. | Sun R, Limkin EJ, Vakalopoulou M, Dercle L, Champiat S, Han SR, Verlingue L, Brandao D, Lancia A, Ammari S, Hollebecque A, Scoazec JY, Marabelle A, Massard C, Soria JC, Robert C, Paragios N, Deutsch E, Ferté C. A radiomics approach to assess tumour-infiltrating CD8 cells and response to anti-PD-1 or anti-PD-L1 immunotherapy: an imaging biomarker, retrospective multicohort study. Lancet Oncol. 2018;19:1180-1191. [RCA] [PubMed] [DOI] [Full Text] [Cited by in Crossref: 506] [Cited by in RCA: 829] [Article Influence: 118.4] [Reference Citation Analysis (0)] |
| 38. | Su GH, Xiao Y, Jiang L, Zheng RC, Wang H, Chen Y, Gu YJ, You C, Shao ZM. Radiomics features for assessing tumor-infiltrating lymphocytes correlate with molecular traits of triple-negative breast cancer. J Transl Med. 2022;20:471. [RCA] [PubMed] [DOI] [Full Text] [Full Text (PDF)] [Cited by in RCA: 45] [Reference Citation Analysis (0)] |
| 39. | Kang W, Qiu X, Luo Y, Luo J, Liu Y, Xi J, Li X, Yang Z. Application of radiomics-based multiomics combinations in the tumor microenvironment and cancer prognosis. J Transl Med. 2023;21:598. [RCA] [PubMed] [DOI] [Full Text] [Full Text (PDF)] [Cited by in Crossref: 46] [Cited by in RCA: 48] [Article Influence: 24.0] [Reference Citation Analysis (0)] |
| 40. | Chen Y, Zhong J, Wang L, Shi X, Lu W, Li J, Feng J, Xia Y, Chang R, Fan J, Chen L, Zhu Y, Yan F, Yao W, Zhang H. Robustness of CT radiomics features: consistency within and between single-energy CT and dual-energy CT. Eur Radiol. 2022;32:5480-5490. [RCA] [PubMed] [DOI] [Full Text] [Full Text (PDF)] [Cited by in Crossref: 1] [Cited by in RCA: 22] [Article Influence: 7.3] [Reference Citation Analysis (0)] |
| 41. | Lennartz S, O'Shea A, Parakh A, Persigehl T, Baessler B, Kambadakone A. Robustness of dual-energy CT-derived radiomic features across three different scanner types. Eur Radiol. 2022;32:1959-1970. [RCA] [PubMed] [DOI] [Full Text] [Cited by in Crossref: 4] [Cited by in RCA: 18] [Article Influence: 4.5] [Reference Citation Analysis (0)] |
| 42. | Pan L, He T, Huang Z, Chen S, Zhang J, Zheng S, Chen X. Radiomics approach with deep learning for predicting T4 obstructive colorectal cancer using CT image. Abdom Radiol (NY). 2023;48:1246-1259. [RCA] [PubMed] [DOI] [Full Text] [Cited by in RCA: 4] [Reference Citation Analysis (0)] |
| 43. | Tharmaseelan H, Rotkopf LT, Ayx I, Hertel A, Nörenberg D, Schoenberg SO, Froelich MF. Evaluation of radiomics feature stability in abdominal monoenergetic photon counting CT reconstructions. Sci Rep. 2022;12:19594. [RCA] [PubMed] [DOI] [Full Text] [Full Text (PDF)] [Cited by in RCA: 28] [Reference Citation Analysis (0)] |
| 44. | Froelich MF, Heinemann V, Sommer WH, Holch JW, Schoeppe F, Hesse N, Baumann AB, Kunz WG, Reiser MF, Ricke J, D'Anastasi M, Stintzing S, Modest DP, Kazmierczak PM, Hofmann FO. CT attenuation of liver metastases before targeted therapy is a prognostic factor of overall survival in colorectal cancer patients. Results from the randomised, open-label FIRE-3/AIO KRK0306 trial. Eur Radiol. 2018;28:5284-5292. [RCA] [PubMed] [DOI] [Full Text] [Cited by in Crossref: 11] [Cited by in RCA: 20] [Article Influence: 2.9] [Reference Citation Analysis (0)] |
| 45. | Huang G, Liu Z, Pleiss G, Maaten LV, Weinberger KQ. Convolutional Networks with Dense Connectivity. IEEE Trans Pattern Anal Mach Intell. 2022;44:8704-8716. [RCA] [PubMed] [DOI] [Full Text] [Cited by in Crossref: 154] [Cited by in RCA: 147] [Article Influence: 49.0] [Reference Citation Analysis (0)] |
| 46. | Shelhamer E, Long J, Darrell T. Fully Convolutional Networks for Semantic Segmentation. IEEE Trans Pattern Anal Mach Intell. 2017;39:640-651. [RCA] [PubMed] [DOI] [Full Text] [Cited by in Crossref: 4004] [Cited by in RCA: 1771] [Article Influence: 221.4] [Reference Citation Analysis (0)] |
| 47. | Wei J, Ji Q, Gao Y, Yang X, Guo D, Gu D, Yuan C, Tian J, Ding D. A multi-scale, multi-region and attention mechanism-based deep learning framework for prediction of grading in hepatocellular carcinoma. Med Phys. 2023;50:2290-2302. [RCA] [PubMed] [DOI] [Full Text] [Cited by in RCA: 9] [Reference Citation Analysis (0)] |
| 48. | Wu X, Li Y, Chen X, Huang Y, He L, Zhao K, Huang X, Zhang W, Huang Y, Li Y, Dong M, Huang J, Xia T, Liang C, Liu Z. Deep Learning Features Improve the Performance of a Radiomics Signature for Predicting KRAS Status in Patients with Colorectal Cancer. Acad Radiol. 2020;27:e254-e262. [RCA] [PubMed] [DOI] [Full Text] [Cited by in Crossref: 24] [Cited by in RCA: 38] [Article Influence: 7.6] [Reference Citation Analysis (0)] |
| 49. | Wei J, Cheng J, Gu D, Chai F, Hong N, Wang Y, Tian J. Deep learning-based radiomics predicts response to chemotherapy in colorectal liver metastases. Med Phys. 2021;48:513-522. [RCA] [PubMed] [DOI] [Full Text] [Cited by in Crossref: 11] [Cited by in RCA: 43] [Article Influence: 8.6] [Reference Citation Analysis (0)] |
| 50. | Lipkova J, Chen RJ, Chen B, Lu MY, Barbieri M, Shao D, Vaidya AJ, Chen C, Zhuang L, Williamson DFK, Shaban M, Chen TY, Mahmood F. Artificial intelligence for multimodal data integration in oncology. Cancer Cell. 2022;40:1095-1110. [RCA] [PubMed] [DOI] [Full Text] [Cited by in Crossref: 205] [Cited by in RCA: 259] [Article Influence: 86.3] [Reference Citation Analysis (0)] |
| 51. | Wu P, Wu K, Li Z, Liu H, Yang K, Zhou R, Zhou Z, Xing N, Wu S. Multimodal investigation of bladder cancer data based on computed tomography, whole slide imaging, and transcriptomics. Quant Imaging Med Surg. 2023;13:1023-1035. [RCA] [PubMed] [DOI] [Full Text] [Full Text (PDF)] [Reference Citation Analysis (0)] |


