Published online May 15, 2024. doi: 10.4251/wjgo.v16.i5.1947
Peer-review started: December 13, 2023
First decision: December 19, 2023
Revised: January 4, 2024
Accepted: March 14, 2024
Article in press: March 14, 2024
Published online: May 15, 2024
Processing time: 148 Days and 12.1 Hours
Gastric cancer (GC) has a high mortality rate worldwide. Despite significant progress in GC diagnosis and treatment, the prognosis for affected patients still remains unfavorable.
To identify important candidate genes related to the development of GC and iden
The Gene Expression Omnibus database was used to obtain the GSE183136 dataset, which includes a total of 135 GC samples. The limma package in R soft
We selected 19214 genes from the GSE183136 dataset, among which there were 250 downregulated genes and 401 upregulated genes in the tumor samples of stage III-IV in comparison to those in tumor samples of stage I-II with a P-value < 0.05. In addition, GO and KEGG results revealed that the various upregulated DEGs were mainly enriched in plasma membrane and neuroactive ligand-receptor interaction, whereas the downregulated DEGs were primarily enriched in cytosol and pancreatic secretion, vascular smooth muscle contraction and biosynthesis of the different cofactors. Furthermore, PPI networks were constructed based on the various upregulated and downregulated genes, and there were a total 15 upregulated and 10 downregulated hub genes. After a comprehensive analysis, several hub genes, including runt-related transcription factor 2 (RUNX2), salmonella pathogenicity island 1 (SPI1), lysyl oxidase (LOX), fibrillin 1 (FBN1) and GPT, displayed prognostic values. Interestingly, it was observed that GPT was downregulated in GC cells and its upregulation could suppress the malignant phenotypes of GC cells. Furthermore, the expression level of GPT was found to be associated with age, lymph node metastasis, pathological staging and distant metastasis (P < 0.05).
RUNX2, SPI1, LOX, FBN1 and GPT were identified key hub genes in GC by bioinformatics analysis. GPT was significantly associated with the prognosis of GC, and its upregulation can effectively inhibit the proliferative, migrative and invasive capabilities of GC cells.
Core Tip: Five hub genes, including RUNX2, SPI1, LOX, FBN1 and GPT, were found to display prognostic values. The oncogenic role of all of these hub genes, except GPT, have been previously reported in gastric cancer. Glutamic-pyruvic transaminase (GPT) expression was significantly associated with age, lymph node metastasis, pathological staging and distant metastasis in patients with gastric cancer. Additionally, GPT was downregulated in gastric cancer cells, and its overexpression inhibited the proliferative, migrative and invasive capabilities of gastric cancer cells. Consequently, we have identified five hub genes (RUNX2, SPI1, LOX, FBN1 and GPT) as potential biomarkers and therapeutic targets for gastric diagnosis and treatment.
- Citation: Zhou JW, Zhang YB, Huang ZY, Yuan YP, Jin J. Identification of differentially expressed mRNAs as novel predictive biomarkers for gastric cancer diagnosis and prognosis. World J Gastrointest Oncol 2024; 16(5): 1947-1964
- URL: https://www.wjgnet.com/1948-5204/full/v16/i5/1947.htm
- DOI: https://dx.doi.org/10.4251/wjgo.v16.i5.1947
As a malignant tumor of the digestive tract, gastric cancer (GC) represents the fifth most prevalent malignancy and the third leading cause of cancer-related mortality worldwide[1]. According to the global cancer statistics in 2018, there were approximately one million new cases and 78.3 million deaths from GC[2]. Helicobacter pylori infection, alcohol con
Messenger RNAs (mRNAs) have been reported to play important role in cycle regulation[8], cell adhesion[9], an
In this study, the mRNA expression profile in the GSE183136 dataset was first downloaded from the Gene Expression Omnibus (GEO) database. Thereafter, novel mRNA signatures were constructed through the publicly available databases. Our results may provide a new reference for both predicting and understanding the prognosis in GC patients.
An expression profile dataset for the mRNAs (GSE183136) was obtained from the GEO database (https://www.ncbi.nlm.nih.gov/geo). This dataset contains a total of 135 GC samples, including 41 stage I-II tumor samples and 94 stage III-IV tumor samples.
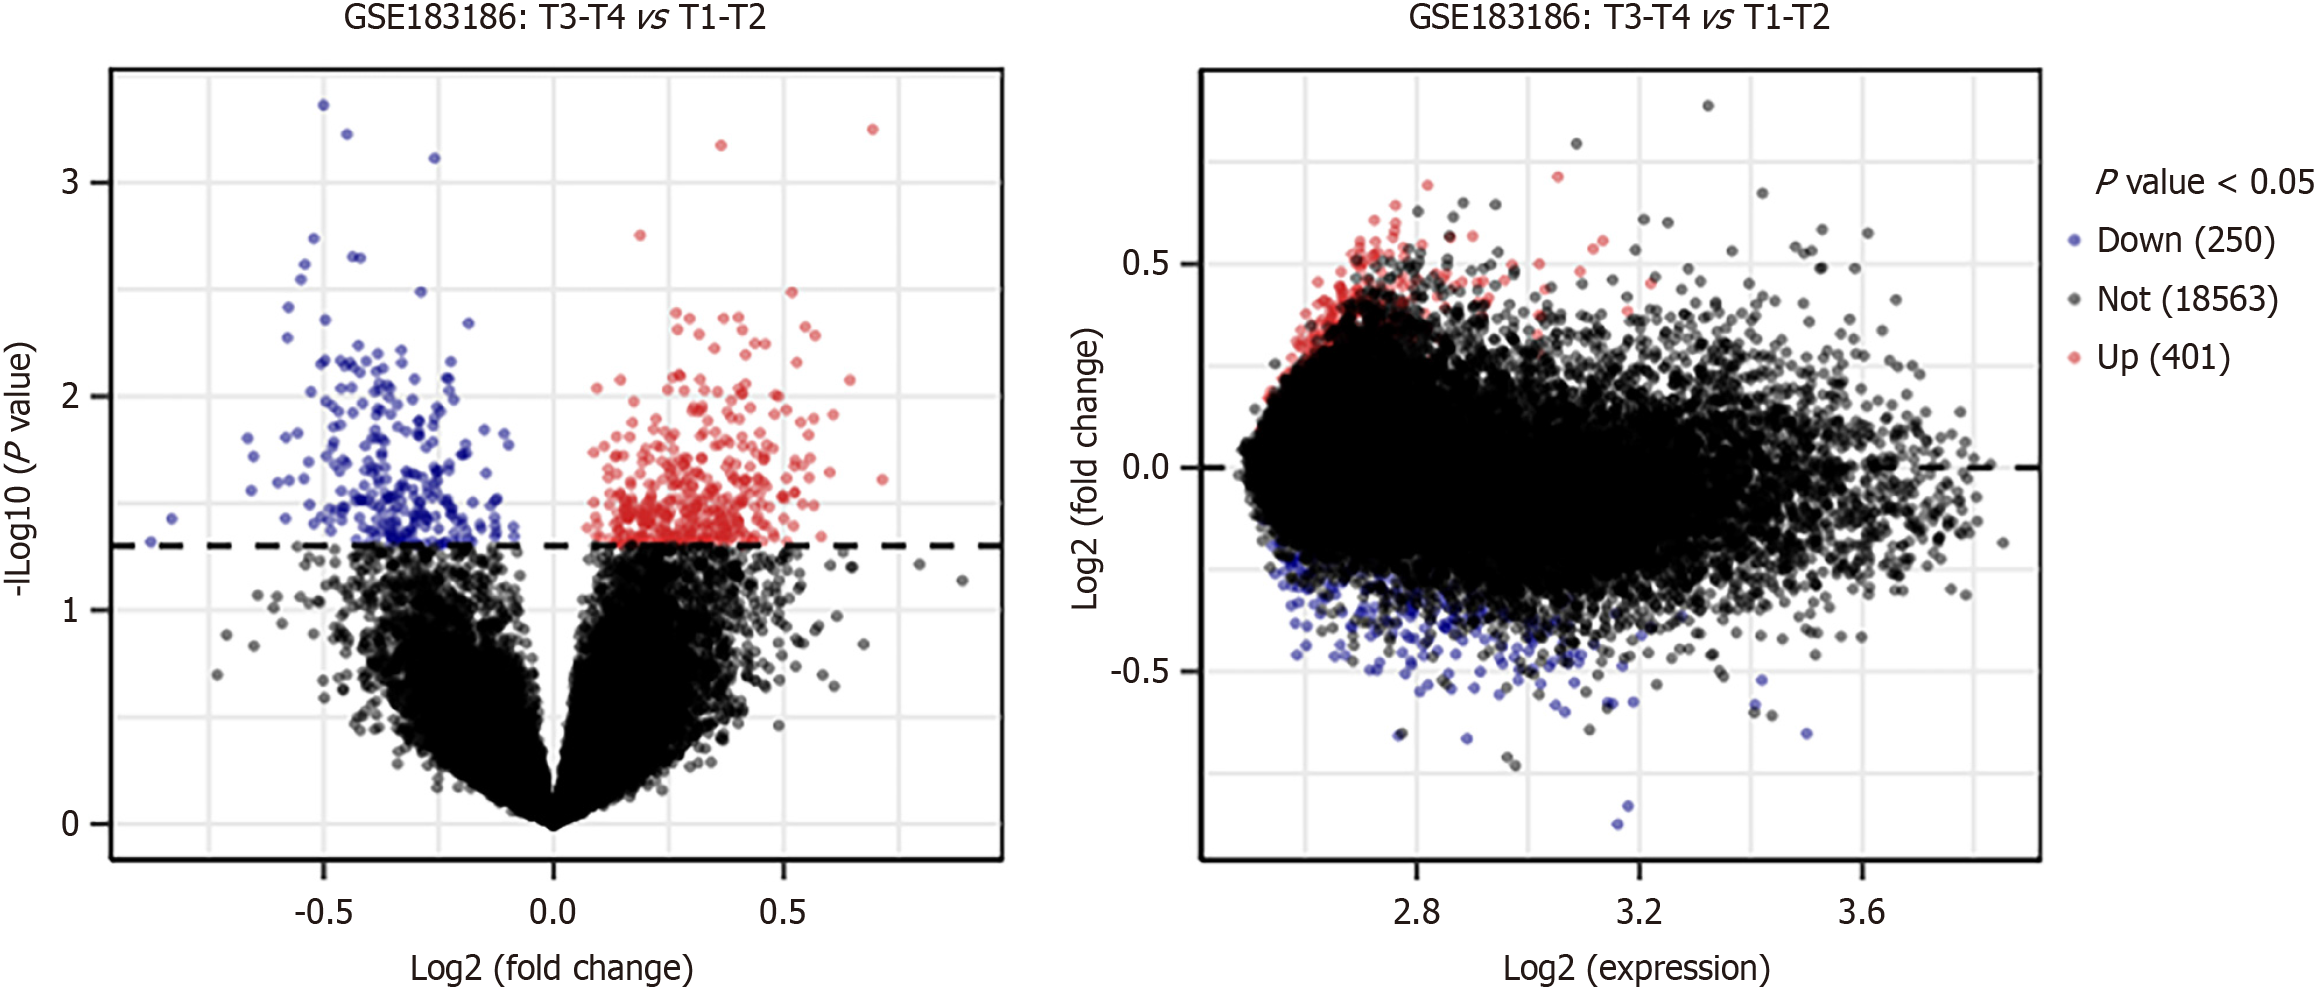
For the GEO data, the DEGs were identified through the limma package in R software. P < 0.05 was considered as statistically significant. The R tool ggplot2 was used to construct a volcano plot to visualize the DEGs. The various highlighted genes were differentially expressed at a default adjusted P value cutoff of 0.05. The log2 fold change vs average log2 expression values were shown in a mean difference plot. The top ten upregulated and downregulated genes have been respectively shown in Supplementary Tables 1 and 2.
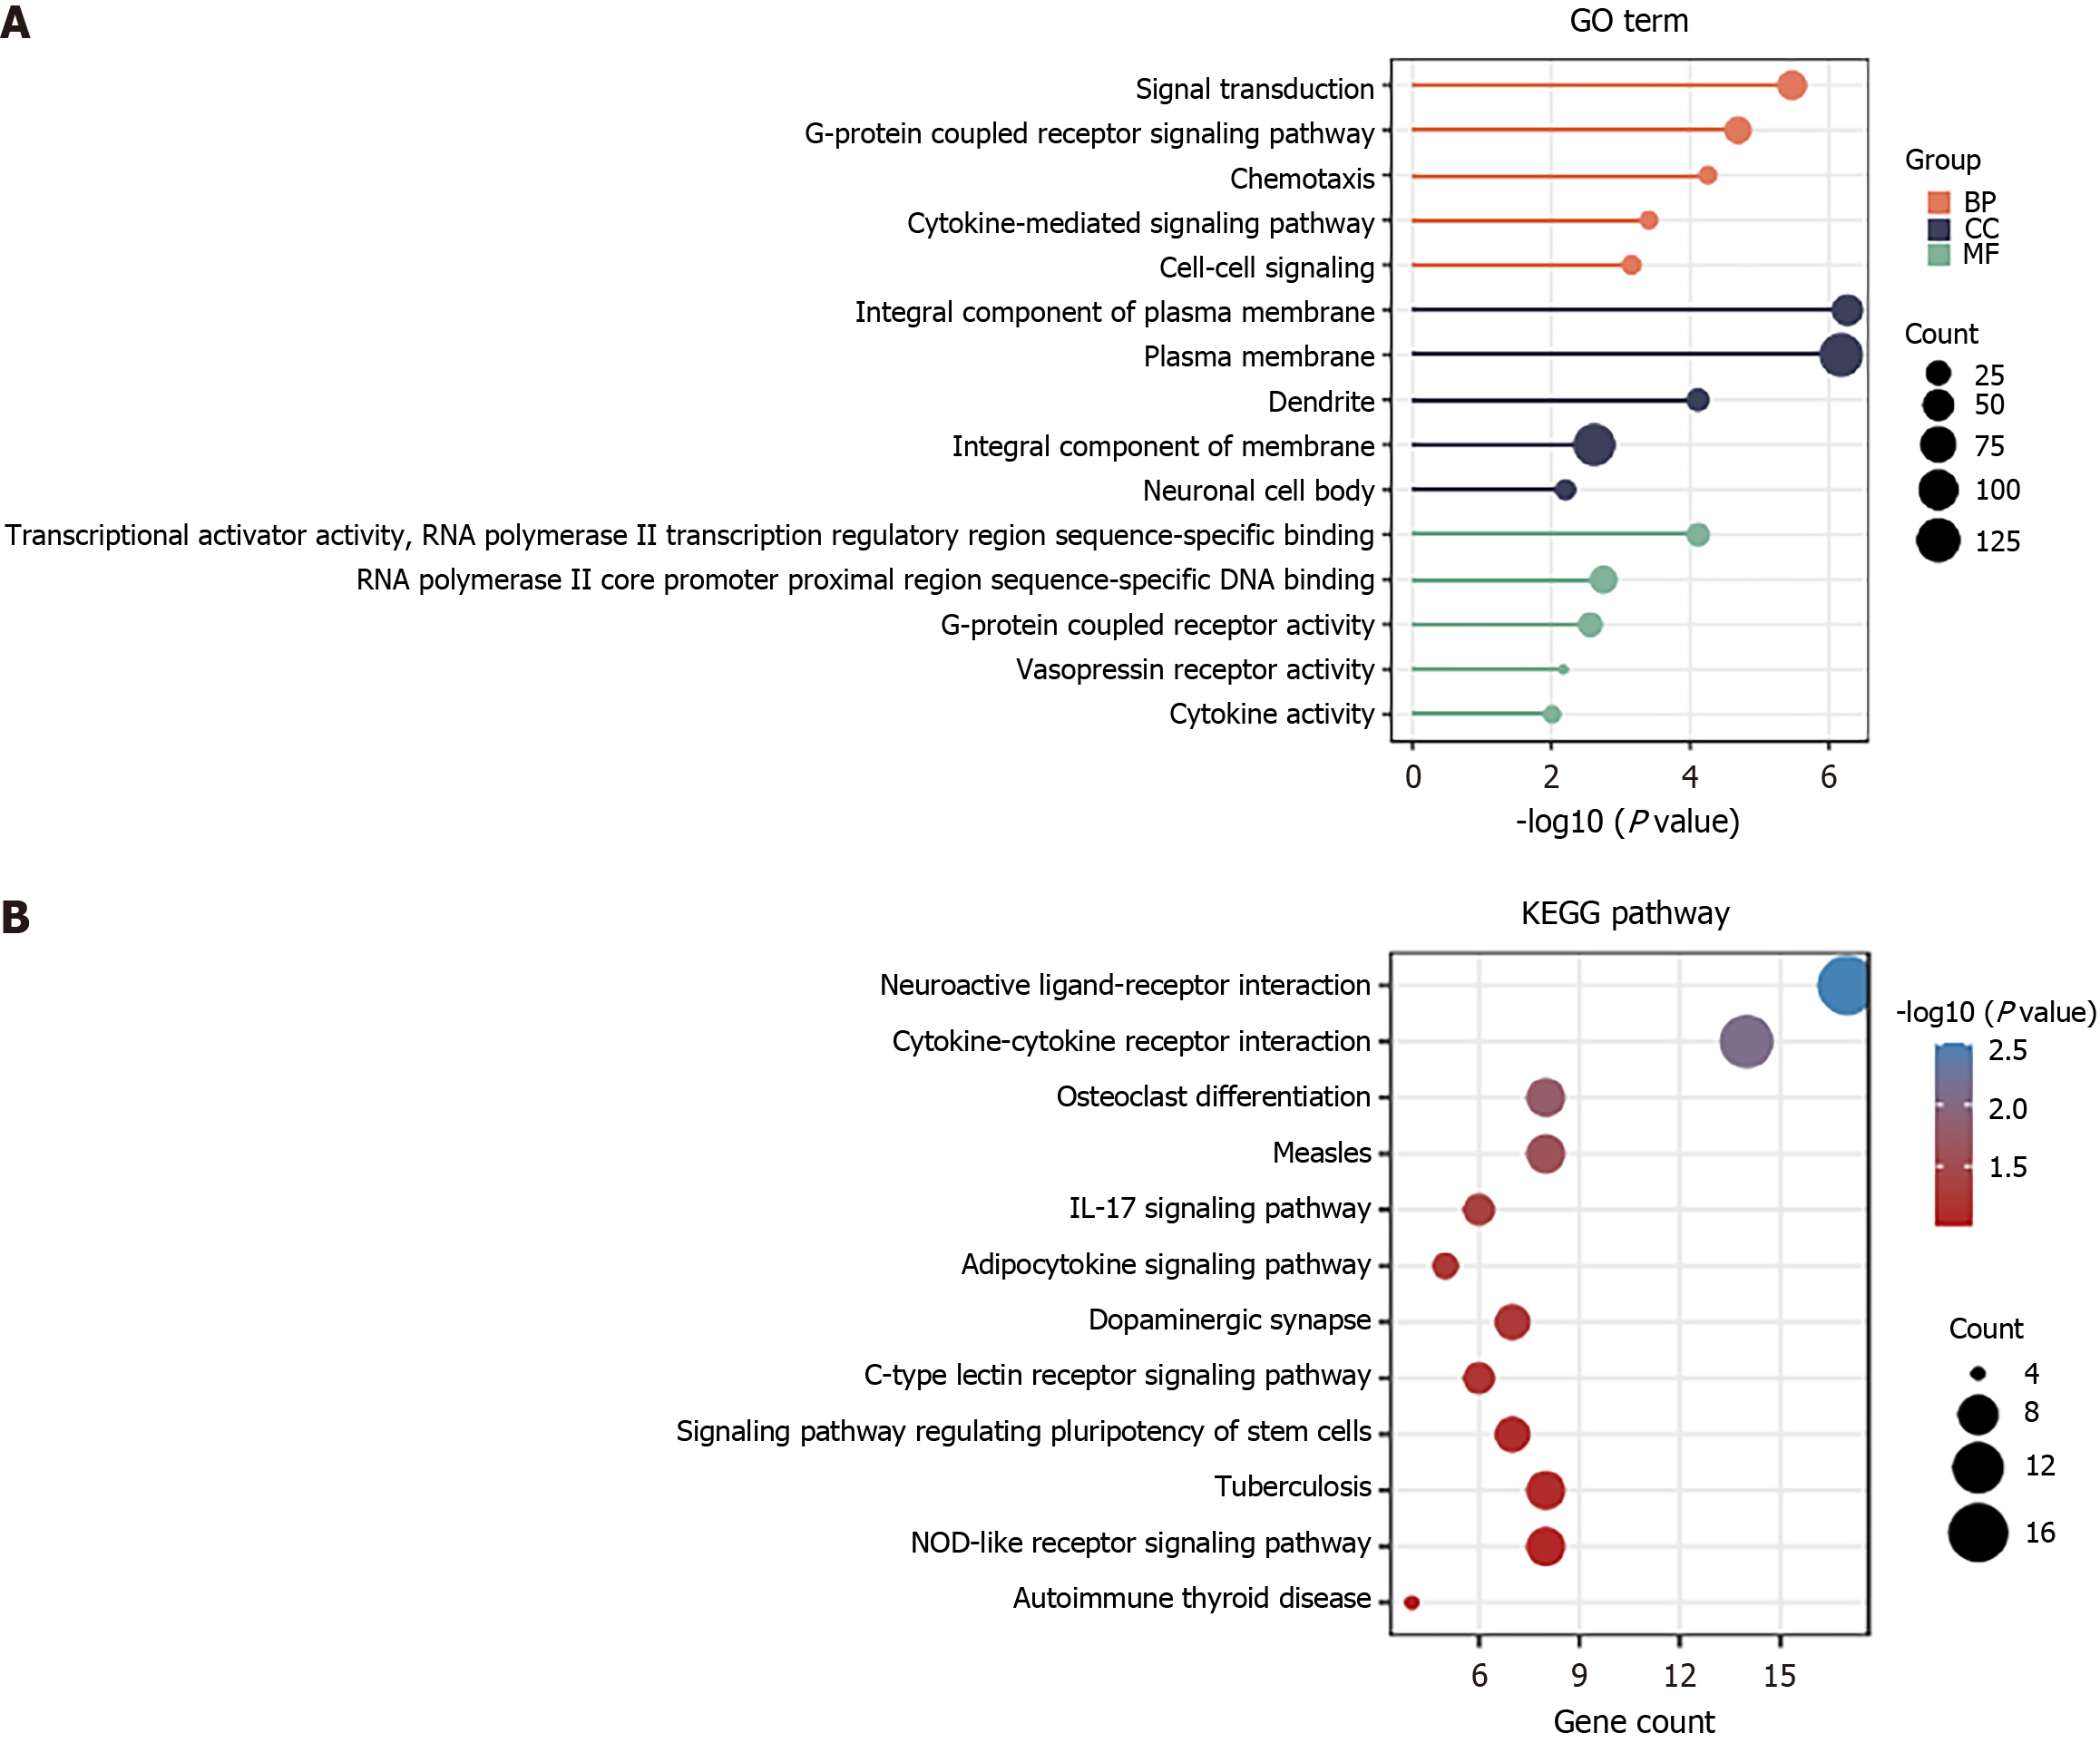
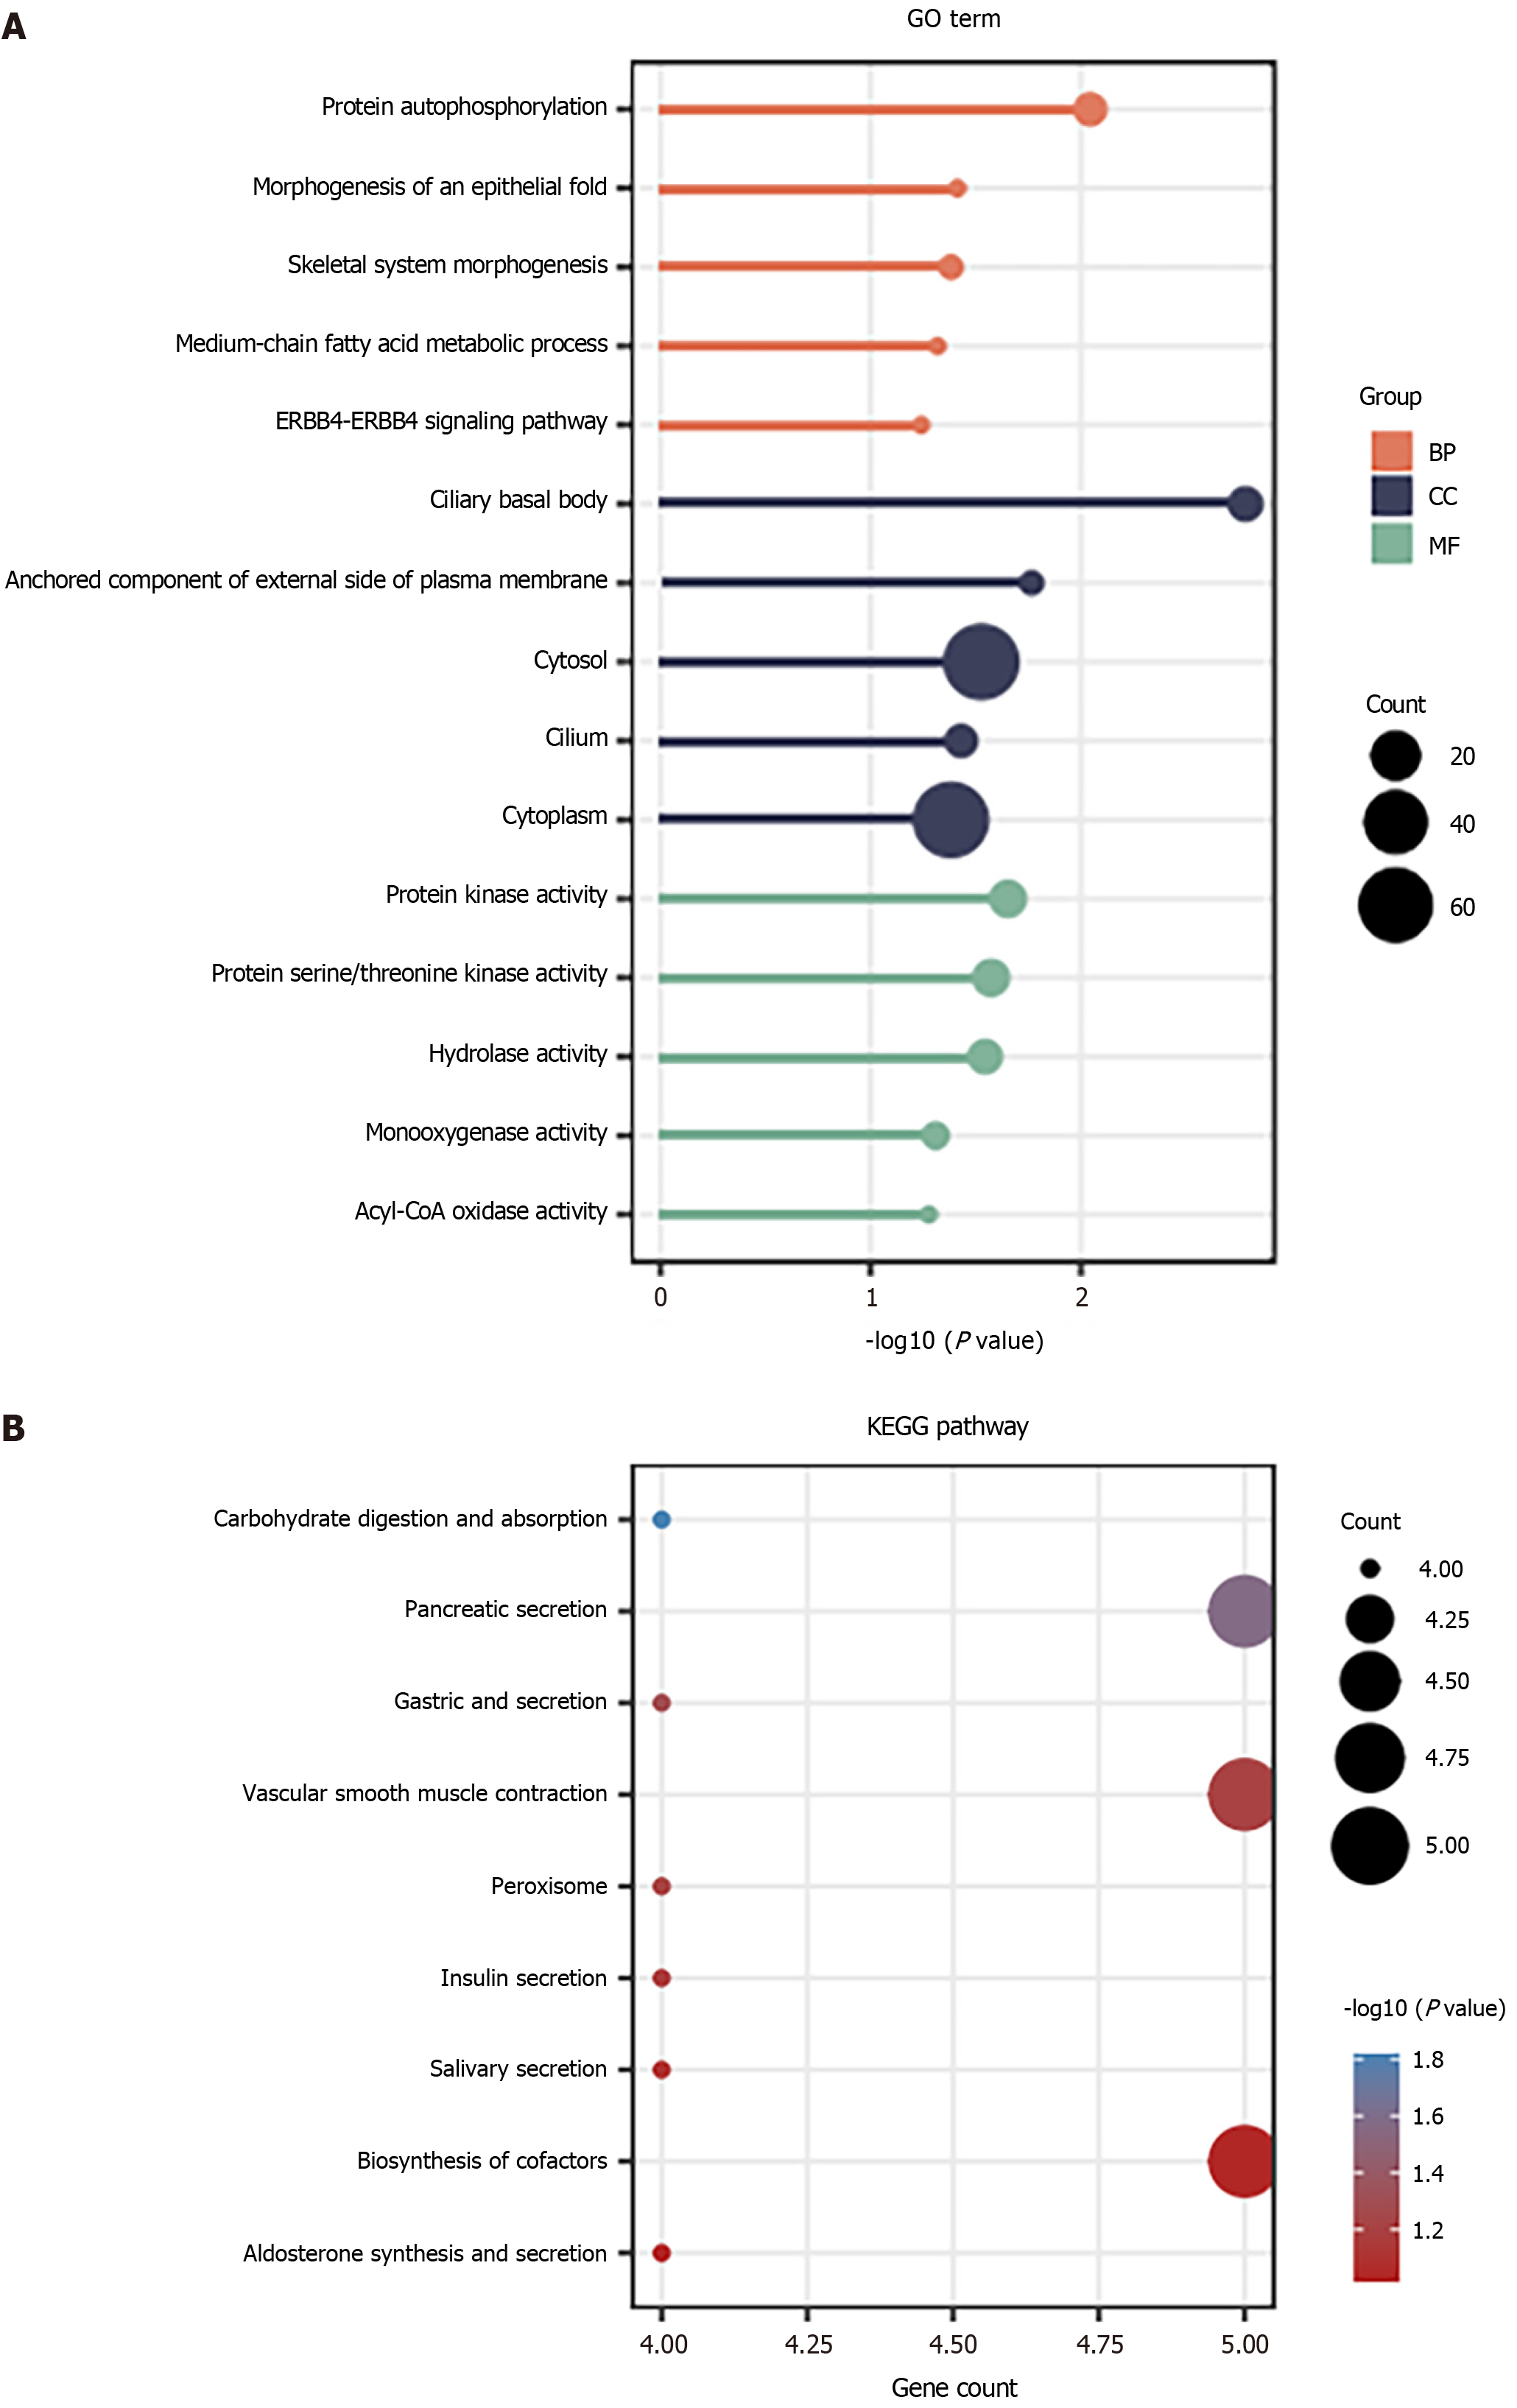
The DAVID database (http://david.ncifcrf.gov/) provides functional annotation of genes obtained from the various genomic resources. Gene Ontology (GO) and Kyoto Encyclopedia of Genes and Genomes (KEEG) analyses were performed using the DAVID and R software. GO analysis was then divided into molecular function (MF), cellular component (CC), and biological process (BP) categories. A false discovery rate < 0.05 was set as the screening threshold for the significant enrichment. The ggplot2 package of R was employed to visualize the results of the functional enrichment analysis.
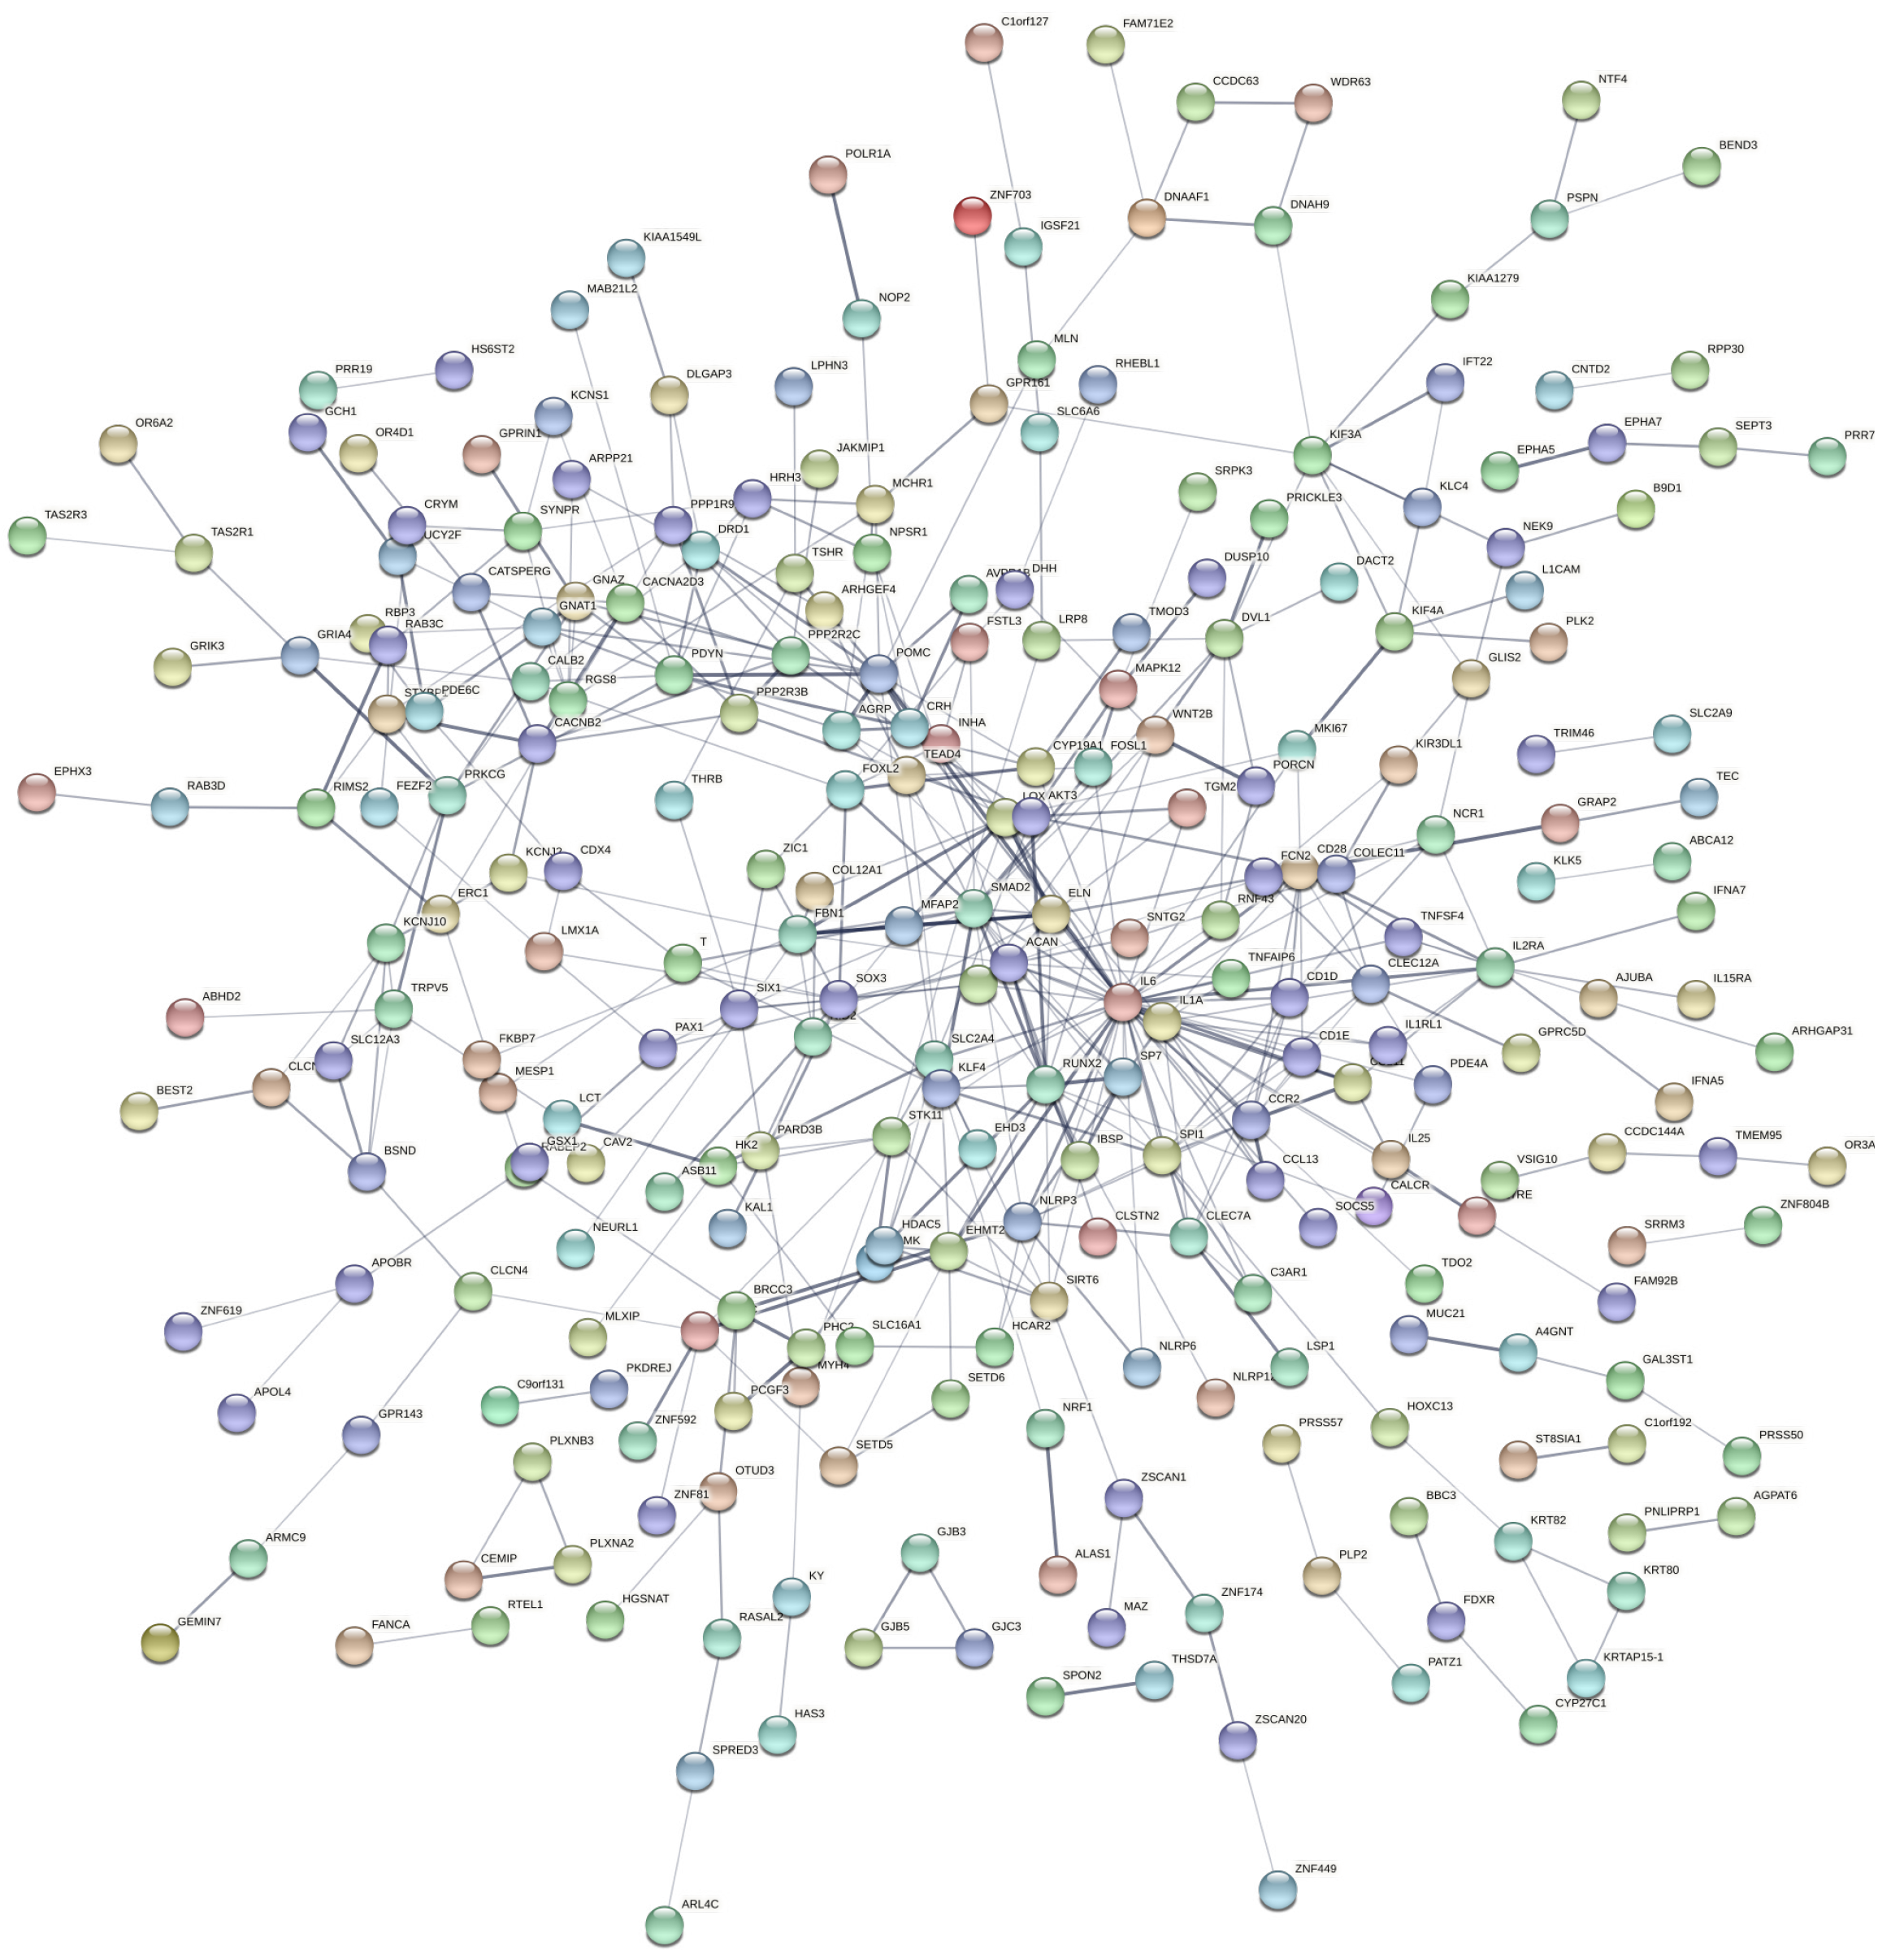
The protein-protein interaction (PPI) network of the various target genes was constructed using the STRING website (http://string-db.org/) with the medium confidence of 0.4. The molecular interaction network was thereafter visualized through the Cytoscape (version 3.4.0). The hub genes have been listed in Supplementary Table 3.
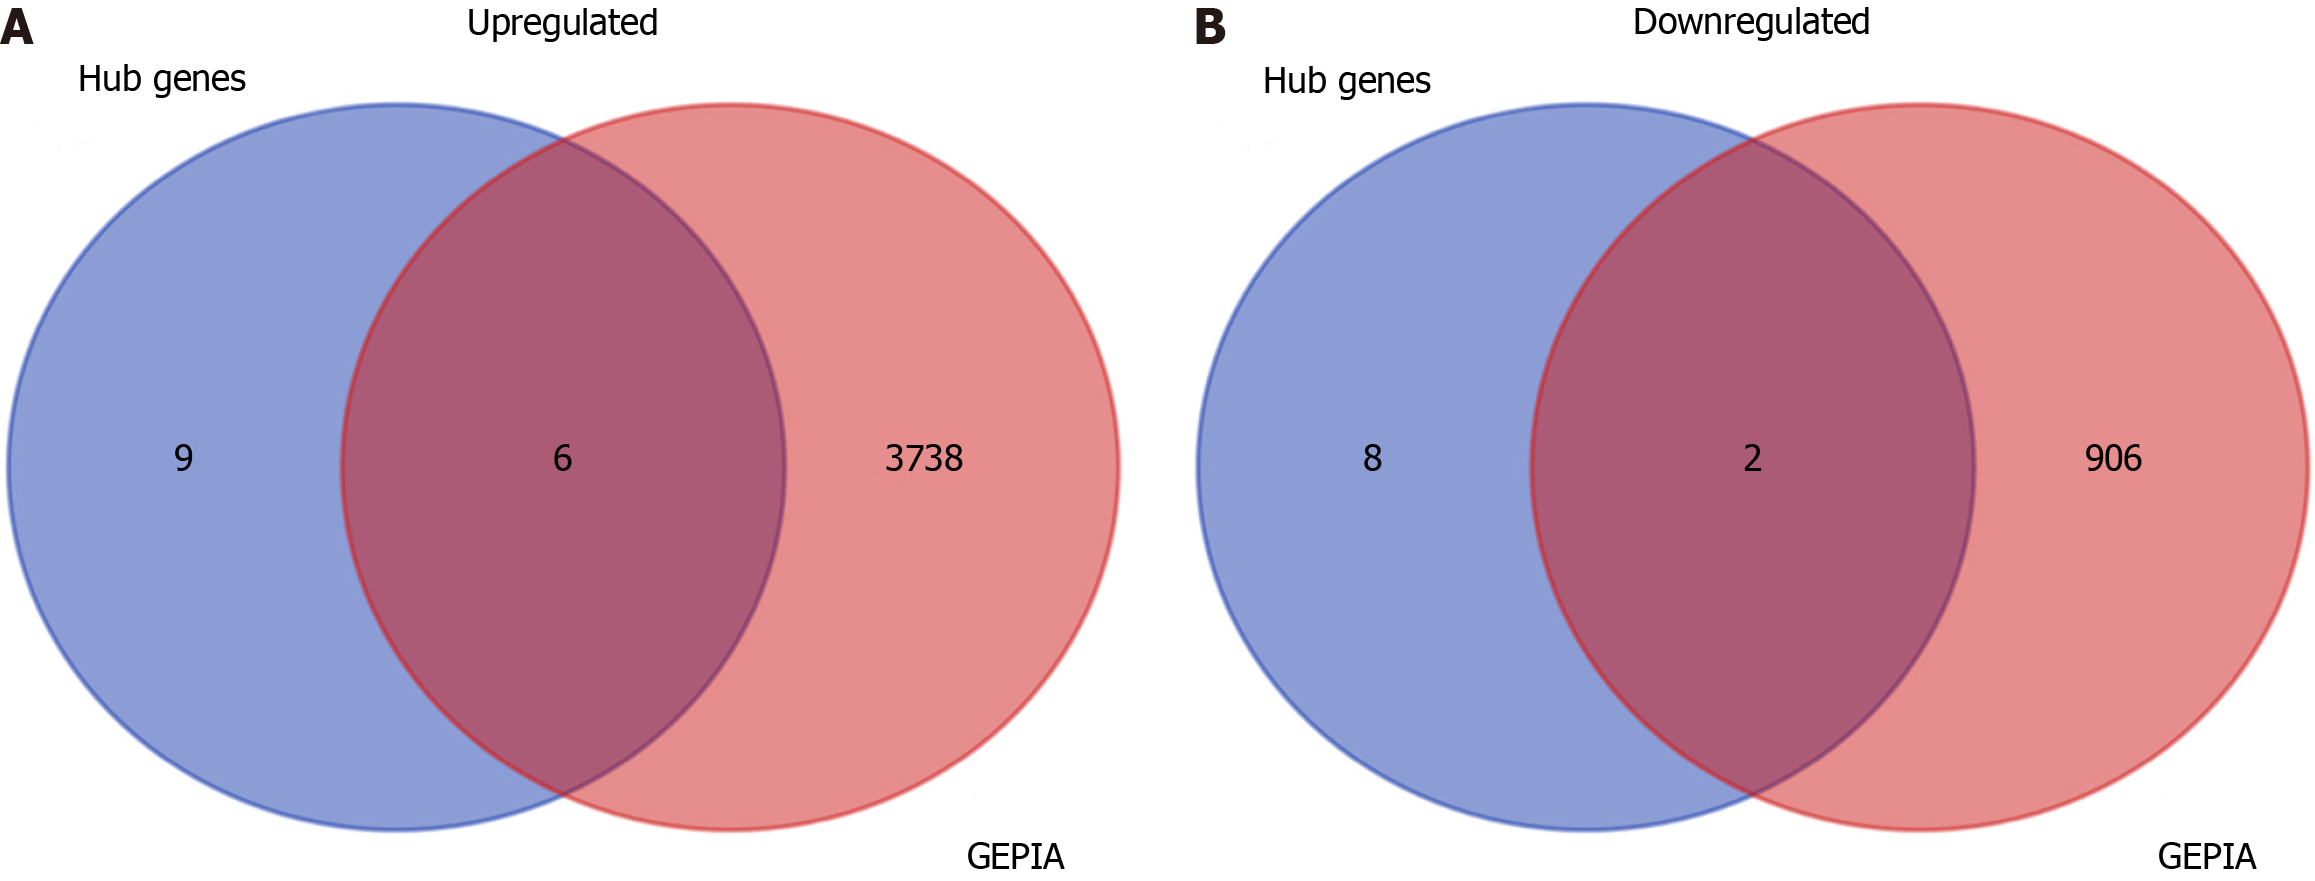
The upregulated and downregulated genes were obtained from the GEPIA database (http://gepia.cancer-pku.cn/). The intersection between the hub genes and the differential genes obtained from the GEPIA database was screened using the Venn Diagram package of R. The overlapping gene expression profile in stomach adenocarcinoma (STAD) samples and non-tumor samples and their potential association with prognosis in GC patients were also collected from the GEPIA database and Kaplan-Meier curves (https://kmplot.com/analysis/index.php?p=miRnaAnalysis).
Human normal gastric mucosal cell line (GES1) and GC cell lines (AGS, MKN45, MKN28, HGC27) were obtained from the Type Culture Collection of Chinese Academy of Science (Shanghai, China). These cells were cultured in Roswell Park Memorial Institute (RPMI) 1640 medium supplemented with 10% fetal bovine serum (FBS), 100 mg/mL streptomycin, and 100 U/mL penicillin (Procell, Wuhan, China) at 37 ℃ in the presence of 5% CO2 in a humidified incubator.
The cells were divided into two different groups: control group and GPT overexpression group (GPT). AGS and HGC27 cells were seeded into 6-well plates (1 × 10⁵ cells/well). After the cells reached 80%–90% confluence, they were transfected using Lipofectamine 2000 (Sigma-Aldrich, Shanghai, China) with the vectors (pcDNA3.1-GPT overexpression vector and negative control empty vector) purchased from Shanghai Gene Biochemistry (Shanghai, China). After 24 h of transfection, the normal RPMI 1640 medium containing 10% FBS was used to replace the residual medium of each well, followed by incubation for 48 h at 37 ℃ with 5% CO2.
The mRNA level of GPT was analyzed by RT-qPCR as previously described[15]. Total RNA was isolated from various GC cells (AGS, MKN45, MKN28 and HGC27) and the normal immortalized cells (GES1) by using TRIzol reagent (Absin, Shanghai, China), and then the total RNA (1 μg) was reverse transcribed into cDNA using a reverse transcription kit (Sigma-Aldrich). The various primers and Go Taq polymerase (Promega, Beijing, China) were used in the PCR reaction, which used the cDNA as a template. The RT-qPCR was performed on the thermal cycler (Bio-Rad, Richmond, CA, United States) and on the ABI PRISM 7000 Sequence Detection System using Sensi FAST SYBR Hi-ROX Mix (Bioline, London, United Kingdom). Glyceraldehyde-3-phosphate dehydrogenase (GAPDH) was used as an endogenous reference for the mRNA detection. The 2-ΔΔCT method[16] was used to calculate the data. The experimental setup consisted of 40 cycles of 95 ℃ for 10 min, 95 ℃ for 5 s, and 60 ℃ for 60 s. The primer sequences used were as follows: GPT, forward 5′-GGACTACTACCTGGACGAAGA-3′, reverse 5’-CACATAGCCACCACGAAAC-3’; GAPDH, forward 5′-TCCTGCACCACCAACTGCTTAG-3′, reverse 5′-AGTGGCAGTGATGGCATGGACT-3′.
The protein level of GPT was measured using Western blotting as described previously[17]. The total protein was isolated from GC cells (AGS, MKN45, MKN28 and HGC27) and the normal immortalized cells (GES1) using RIPA lysis buffer containing protease phosphatase cocktail obtained from Beyotime (Shanghai, China). The extract was centrifuged at 10000 × g for 15 min to remove the cell debris. The protein concentration was quantified using a bicinchoninic acid (BCA) protein assay kit (Beyotime). Thereafter, the protein samples (20 μg per lane) were resolved using 10% Sodium dodecyl-sulfate polyacrylamide gel electrophoresis (SDS-PAGE) and transferred onto a polyvinylidene difluoride (PVDF) membrane. After blocking with 5% skimmed milk for 1 h, the membrane was incubated overnight with the primary antibodies against GPT (PAS-29600, 1:1000; Thermo Fisher Scientific, Shanghai, China) and GAPDH (ab8245, 1:2000; Abcam) at 4 ℃. Subsequently the membranes were incubated with secondary antibodies for 2 h at the room temperature. The bands were visualized using an enhanced chemiluminescent reagent (Yeasen, Shanghai, China). The immunoblot images were quantified by ImageJ software.
Cell counting kit-8 (CCK-8) assay was employed to determine cell viability as described previously[18]. AGS and HGC27 cell lines were seeded into 96-well plates (1 × 10⁴ cells/well) and incubated at 37 ℃ with 5% CO2. Thereafter, on days 0-7 respectively, 100 μL medium containing 10 μL CCK-8 solution (Beyotime) was added to each well followed by additional 2 h of incubation at 37 ℃ in 5% CO2. Finally, absorbance was measured at 450 nm using a microplate reader (Molecular Devices, Shanghai, China).
The progression of cell cycle was analyzed by flow cytometry as described previously[19]. The cells were harvested after 72 h of transfection by trypsin and washed thrice with PBS. Thereafter, the cells were fixed in ice-cold 70% ethanol for 4 h at 4 ℃. Subsequently, the supernatant was discarded, and the cells were incubated with propidium iodide (Sigma-Aldrich) for 30 min at the room temperature. The cell cycle was detected using FACS Calibur (BD Biosciences, San Jose, CA, United States), and data was analyzed by FlowJo software (TreeStar Inc., Ashland, OR, United States).
The cell migration and invasion were examined by Transwell assays as previously described[20]. A suspension of AGS and HGC27 cells in RPMI 1640 medium was added at a density of 2 × 10⁴ cells into a transwell insertion (with 8 mm pore size; Corning, Shanghai, China). The transwell membrane was precoated with Matrigel (Corning), and 500 μL of RPMI-1640 medium containing 5% FBS was then added to the bottom chambers as an inducer. After 48 h of incubation, invaded cells on the bottom of the transwell membrane were fixed by methanol and stained with 0.1% crystal violet, whereas the non-invaded cells were removed using a cotton swab. A light microscope (Olympus, Tokyo, Japan) was employed to visualize the invaded cells. The cell migration was also measured as described above without the Matrigel. The number of cells per field was counted using the ImageJ software.
A retrospective analysis was performed on 70 GC patients diagnosed and surgically treated in Wenzhou Central Hospital, Dingli Clinical College of Wenzhou Medical University, The Second Affiliated Hospital of Shanghai University from January 2017 to December 2020. Inclusion criteria were as following: (1) Pathology-diagnosed cancer tissue specimens, and adjacent tissues surrounding tissues that were found to be free of cancer or inflammatory cell infiltration; and (2) patients with complete medical records and follow-up data. Exclusion criteria: (1) Patients who had undergone radiotherapy and chemotherapy prior to the collection of specimens; (2) pregnant or lactating patients; (3) patients with other severe diseases; and (4) patients with communication or cognitive disorders. During the operation, GC and the adjacent tissues (5 cm away from the cancerous tissues) were collected and stored at -80℃. This study was approved by the Ethics Committee of Wenzhou Central Hospital, Dingli Clinical College of Wenzhou Medical University, The Second Affiliated Hospital of Shanghai University (No. 202401302247000596077). All the patients who participated in this research had signed informed consents. The potential correlation between the expression level of GPT and clinicopathological features in 70 GC patients were analyzed and have been presented in Table 1.
| Clinical and pathological features | n = 70 | GPT expression | P value | |
| Low (35) | High (35) | |||
| Gender | 0.631 | |||
| Male | 38 | 18 | 20 | |
| Female | 32 | 17 | 15 | |
| Age (yr) | 0.015a | |||
| ≤ 50 | 28 | 9 | 19 | |
| > 50 | 42 | 26 | 16 | |
| Lymph node metastasis | 0.016a | |||
| Yes | 51 | 30 | 21 | |
| No | 19 | 5 | 14 | |
| Pathological staging | 0.006b | |||
| Sage I-II | 25 | 7 | 18 | |
| Stage III-IV | 45 | 28 | 17 | |
| Distant metastasis | 0.001c | |||
| Yes | 43 | 28 | 15 | |
| No | 27 | 7 | 20 | |
| Location classification | 0.685 | |||
| Gastric fundus and cardia cancer | 31 | 14 | 17 | |
| Gastric corpus cancer | 21 | 12 | 9 | |
| Gastric antrum cancer | 18 | 9 | 10 | |
All the experiments were performed at least in three independent repeats. The Statistical analysis was conducted using GraphPad Prism 8 (GraphPad Software, San Diego, CA, United States). The data was described as the mean ± SD. One-way analysis of variance followed by Tukey’s post hoc analysis and student’s t-test were used for the comparison analyses. P < 0.05 was considered as statistically significant.
To explore the possible role of systems biology in GC pathogenesis, we downloaded the mRNA expression array (GSE183136). Thereafter, in order to extract DEGs, we screened the GSE183136 dataset using the limma program (P value < 0.05). The Volcano plots showed the differential expression of multiple genes from 41 tumor samples of stage I-II and 94 tumor samples of stage III-IV. Overall, a total of 651 DEGs were screened, including 250 downregulated and 401 upregulated genes (Figure 1). The top ten upregulated and downregulated genes have been displayed in Supplementary Tables 1 and 2 respectively. CEMIP, KRT80, EMP2, APOL4, IPMK, C1orf127, ECM1, GPR143, CCL13, and KLF4 were identified as upregulated genes in the tumor samples of stage III-IV, whereas the downregulated genes included TM4SF4, FAM3D, MT1M, GC, RPL21, MT1IP, MSRA, SLC25A23, CCDC115, and R3HCC1.
We performed GO function and KEGG enrichment analysis by DAVID to gain a deeper understanding of the biological functions of the elevated DEGs shown in Figure 1. Functional enrichment analysis was conducted on the DEGs. GO results revealed that the DEGs were significantly enriched in the signal transduction and G-protein coupled receptor signaling pathway of BP, plasma membrane and integral component of membrane of CC, as well as RNA polymerase II core promoter proximal region sequence-specific DNA binding and G-protein coupled receptor activity of MF (Figure 2A). Moreover, KEGG analysis demonstrated that the upregulated DEGs were primarily enriched in neuroactive ligand-receptor interaction and cytokine-cytokine receptor interaction (Figure 2B).
For all the downregulated DEGs identified in Figure 1, it was found that the protein autophosphorylation and skeletal system morphogenesis were the most enriched in the BP, cytosol and cytoplasm were the most enriched gene terms in the CC, whereas the protein kinase activity, protein serine/threonine kinase activity and hydrolase activity were the most enriched gene terms in the MF (Figure 3A). Furthermore, the downregulated DEGs were enriched in the pancreatic secretion, vascular smooth muscle contraction and biosynthesis of cofactors (Figure 3B).
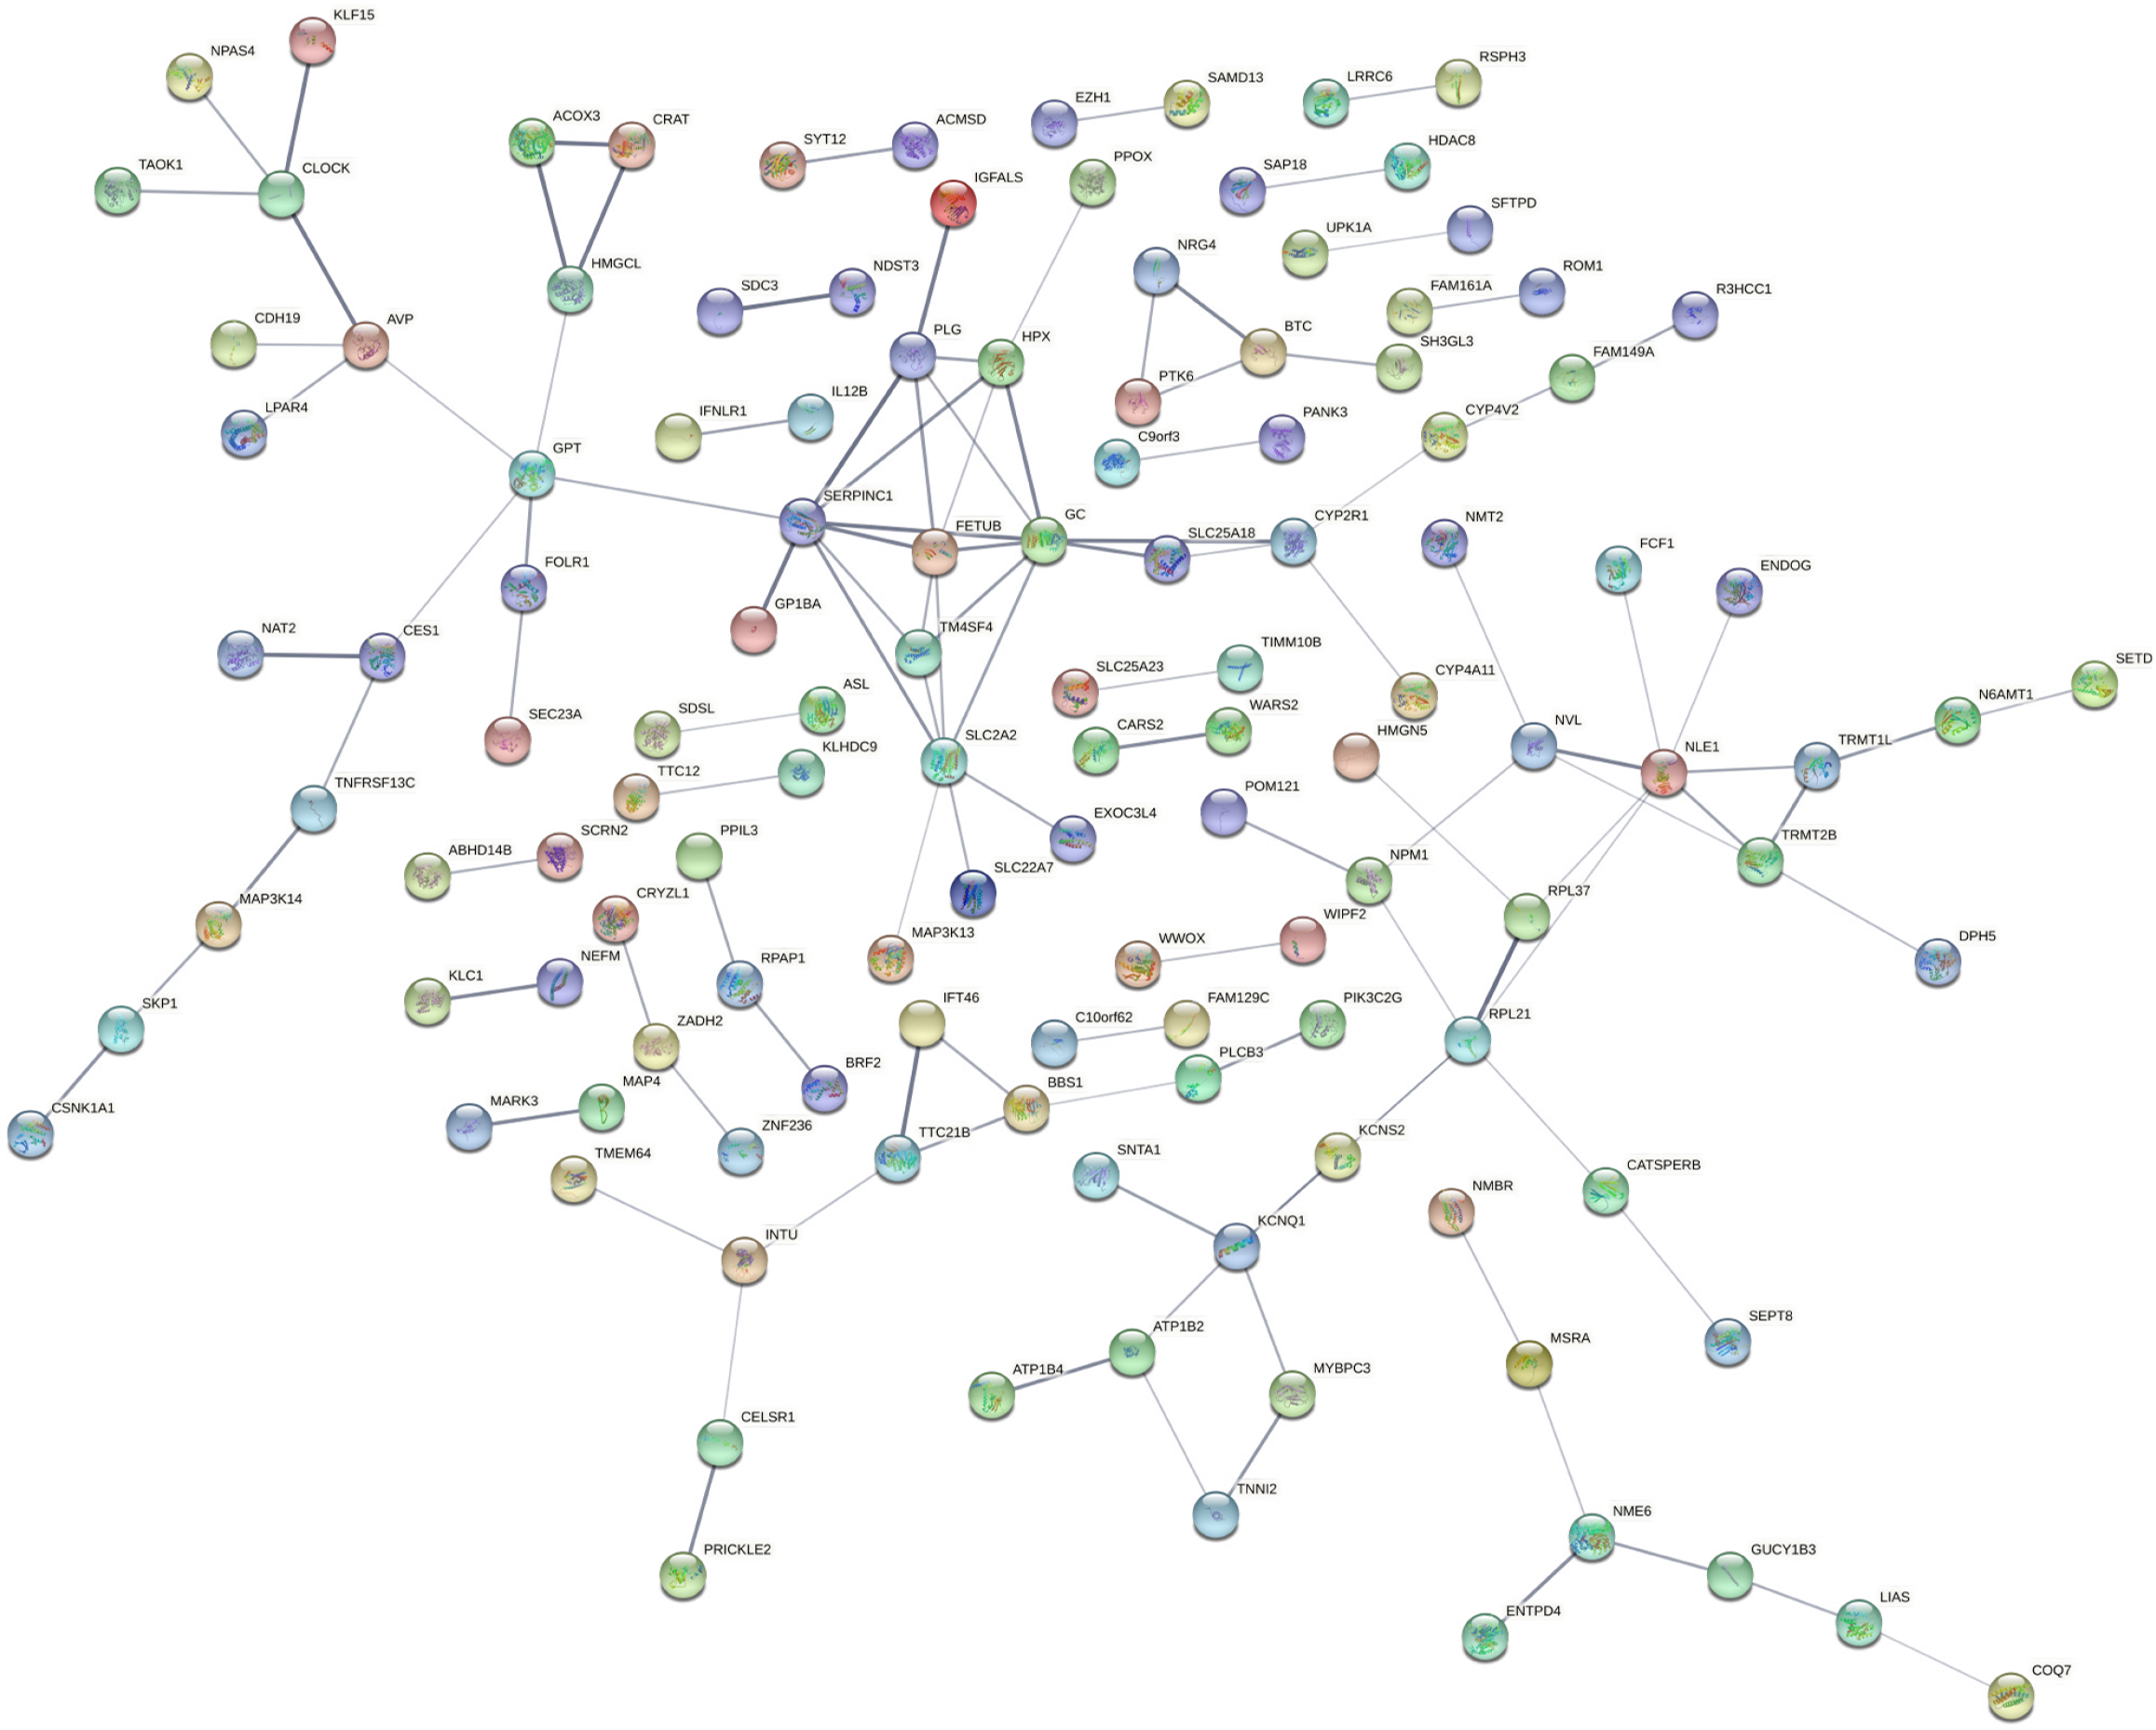
To identify the key hub genes, the PPI networks were created based on the selected DEGs from STRING and visualized by Cytoscape (Figures 4 and 5). The hub genes have been listed in Supplementary Table 3. The various up-regulated hub genes were identified with node degree ≥ 10, including IL6, SMAD2, RUNX2, POMC, ACAN, CD28, IL1A, CCR2, SPI1, ELN, FBN1, IL2RA, LOX, PDYN, and SOX3. In addition, 10 downregulated hub genes were screened with node degree ≥ 5, including SERPINC1, GC vitamin D binding protein, SLC2A2, NLE1, RPL21, FETUB, PLG, KCNQ1, HPX, and GPT.
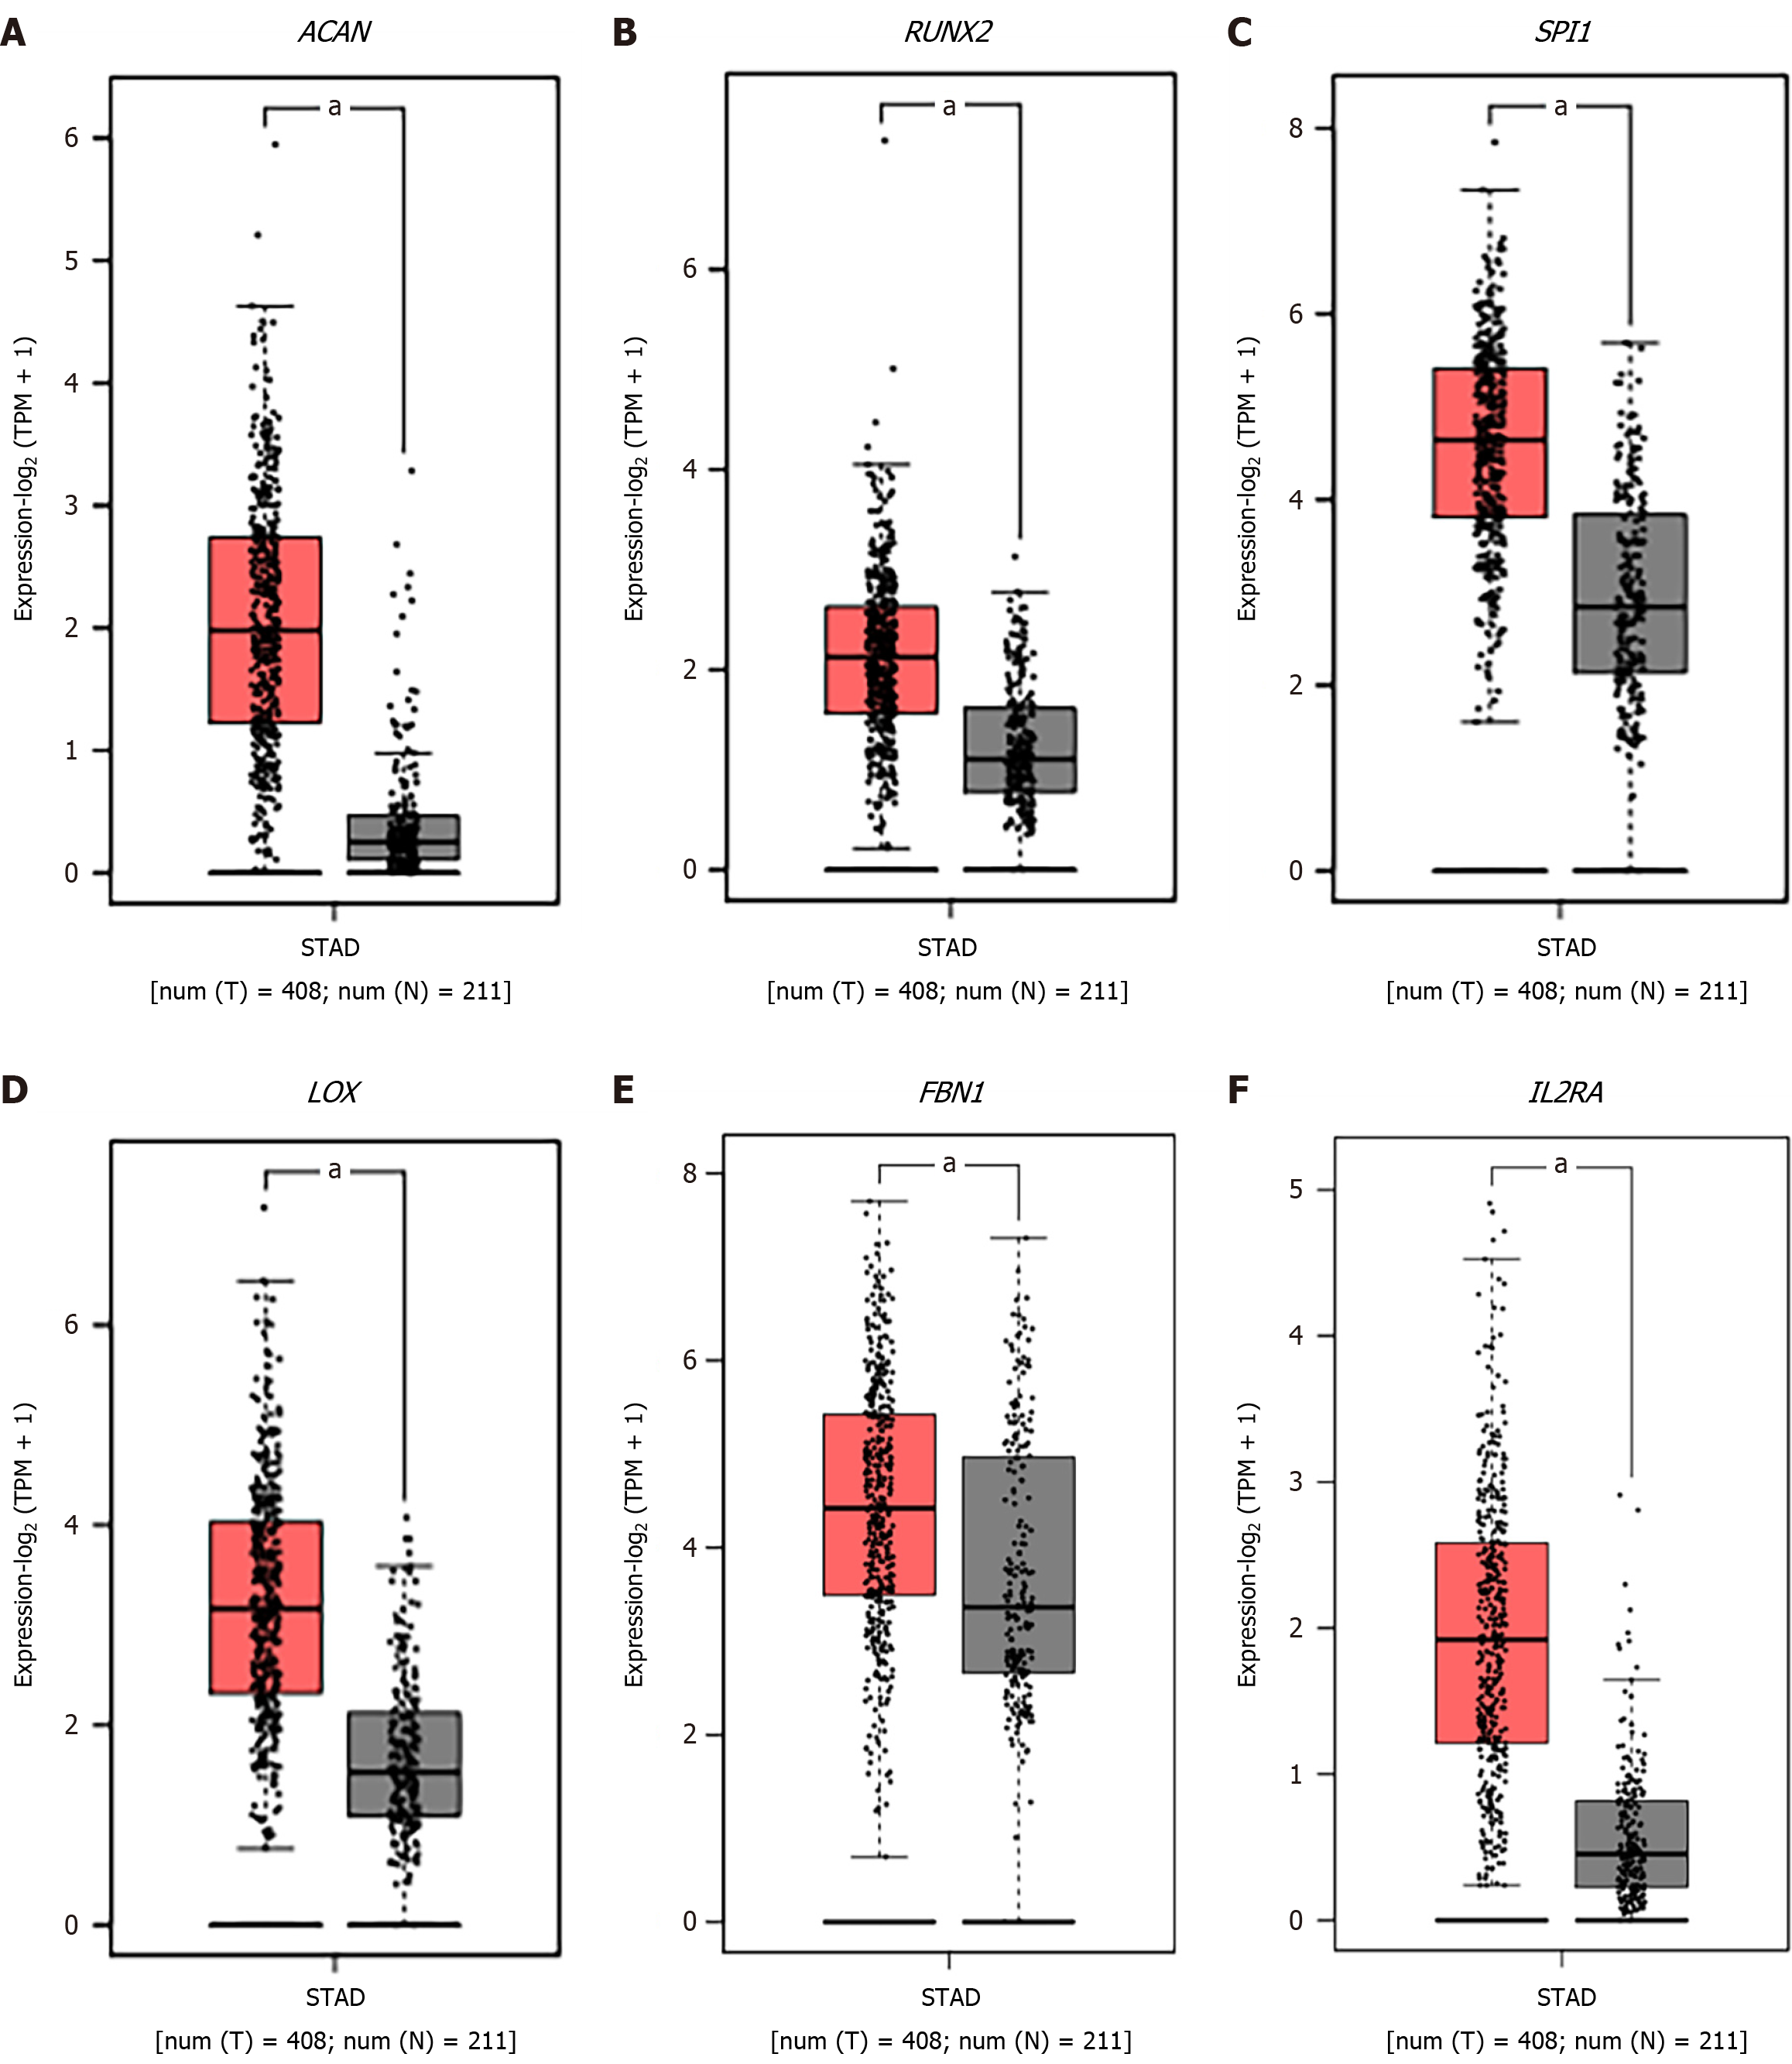
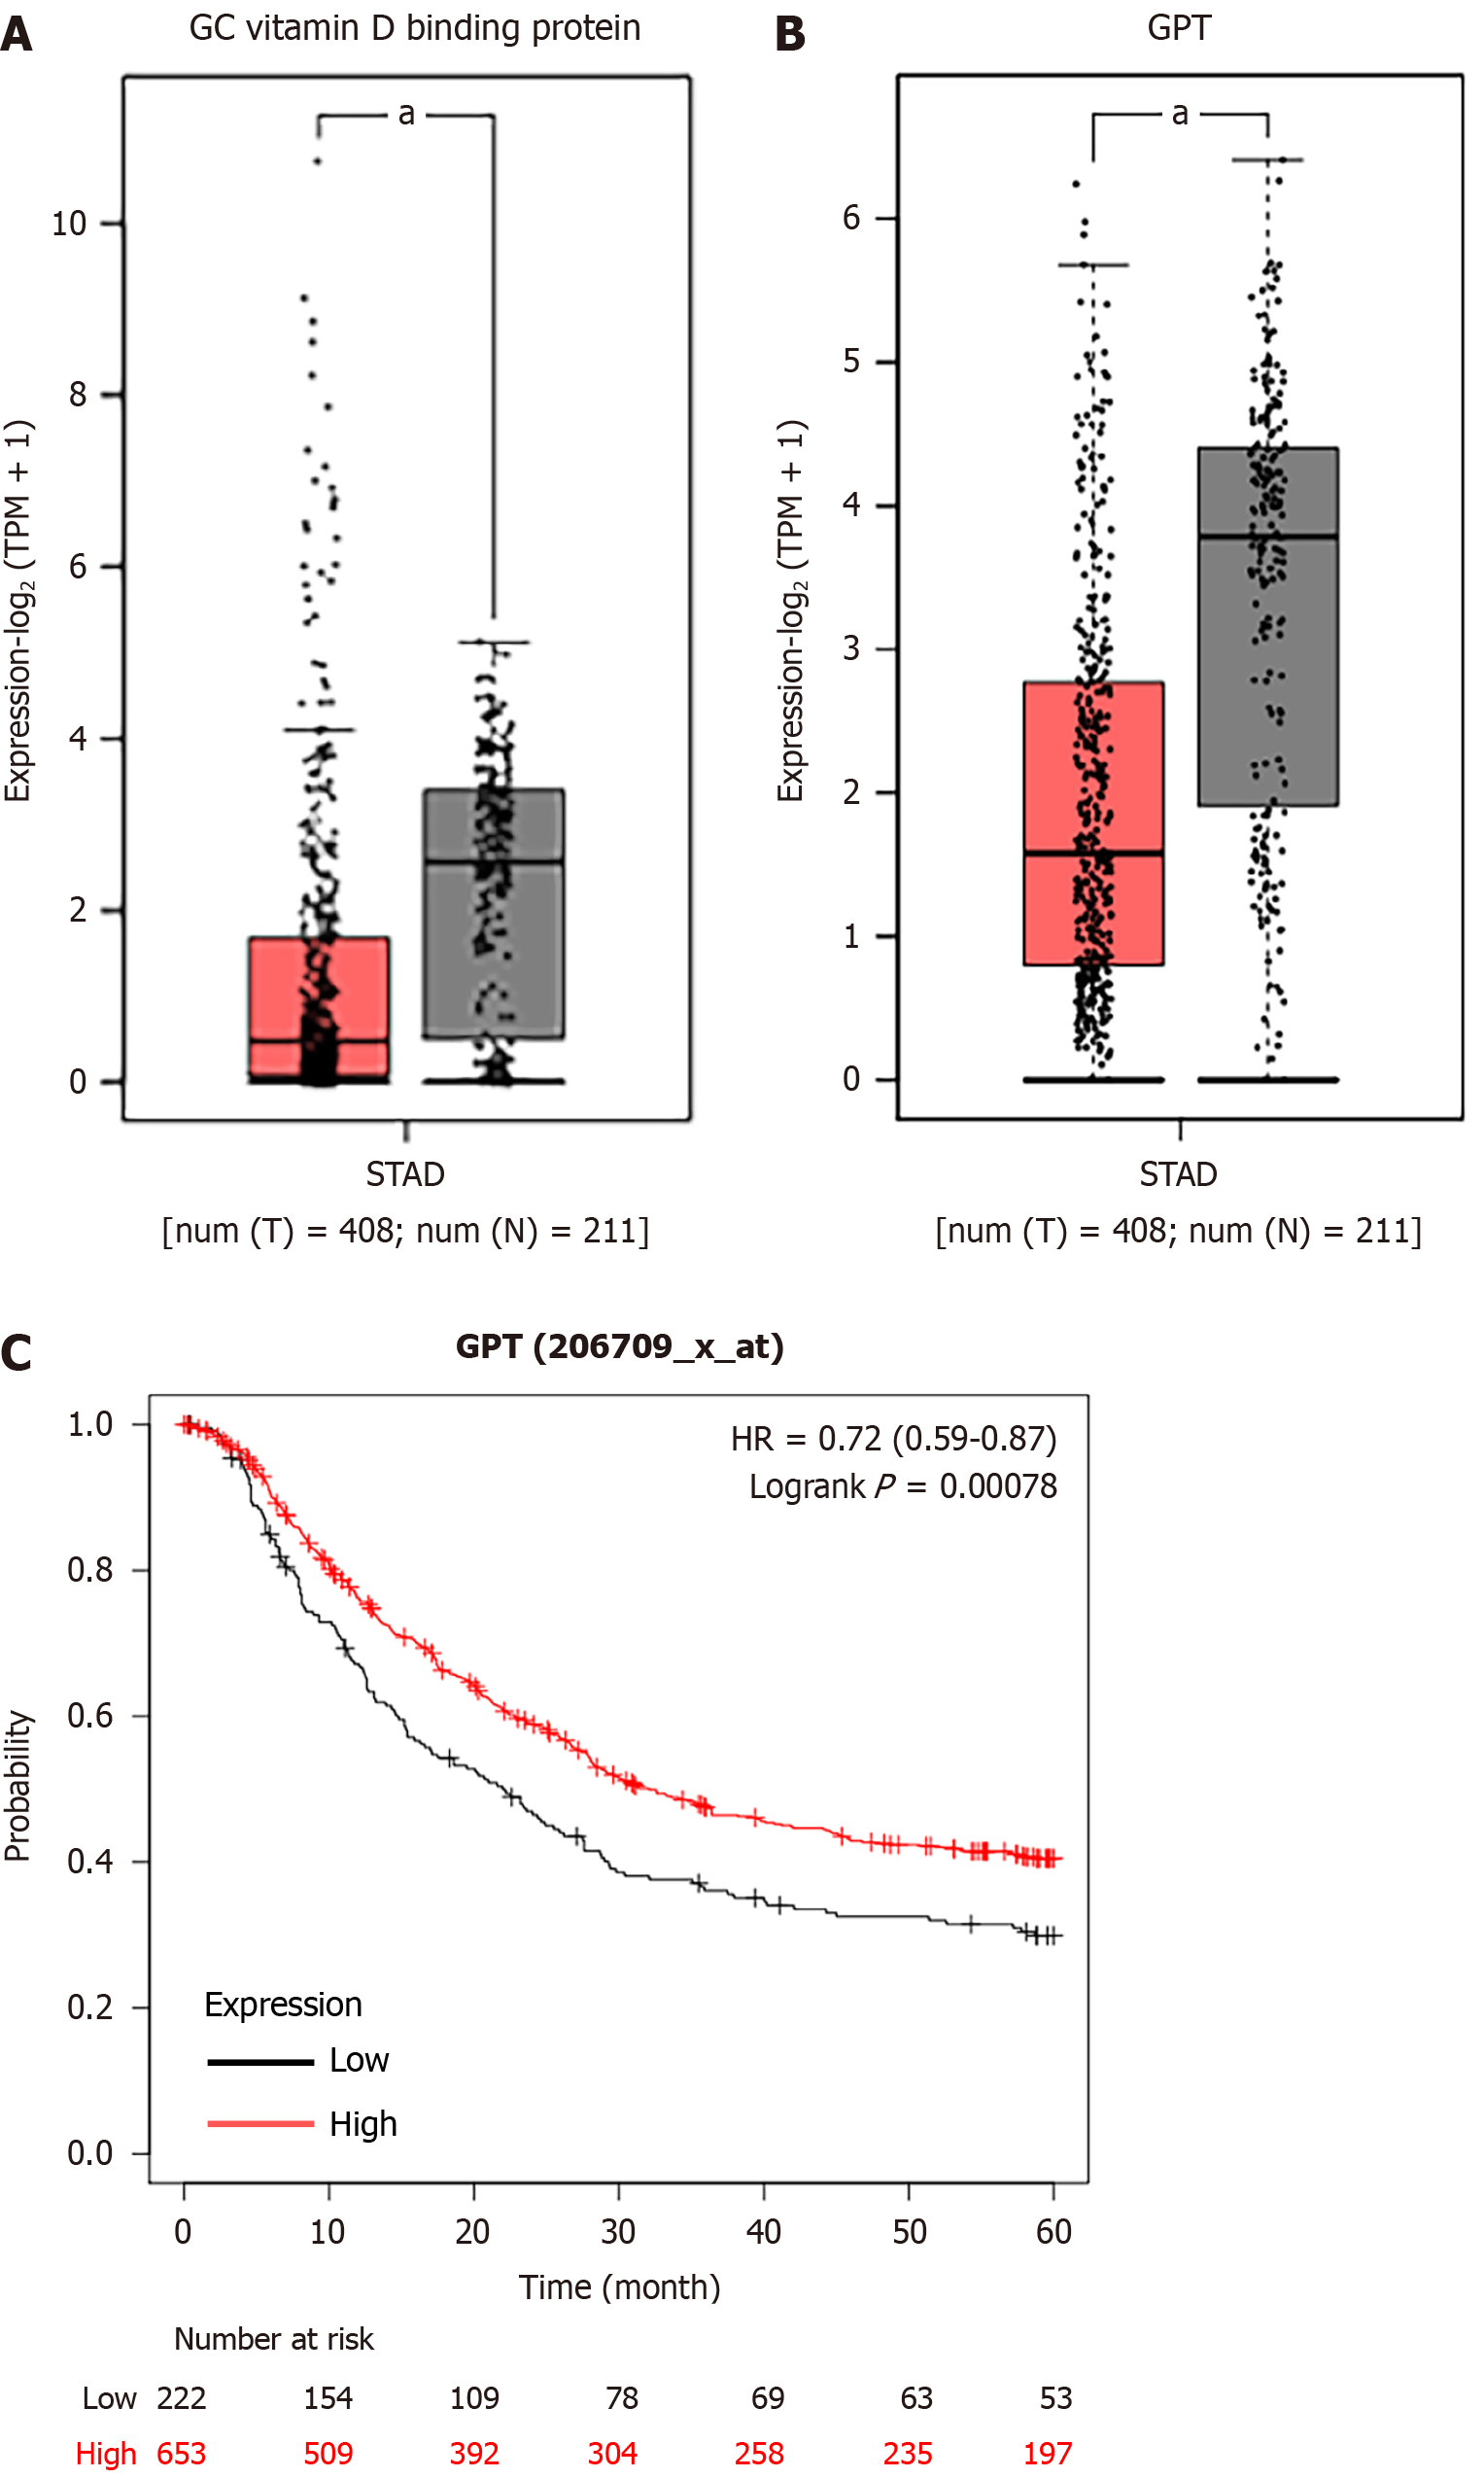
The mRNA expression levels of 15 upregulated and 10 downregulated key hub genes were validated by GEPIA database, and the results indicated that the expression levels of ACAN. RUNX2, SPI1, LOX, FBN1, and IL2RA were significantly higher but the expression levels of GC vitamin D binding protein and GPT were significantly lower in STAD samples in comparison to those in the normal tissues (Figure 6).
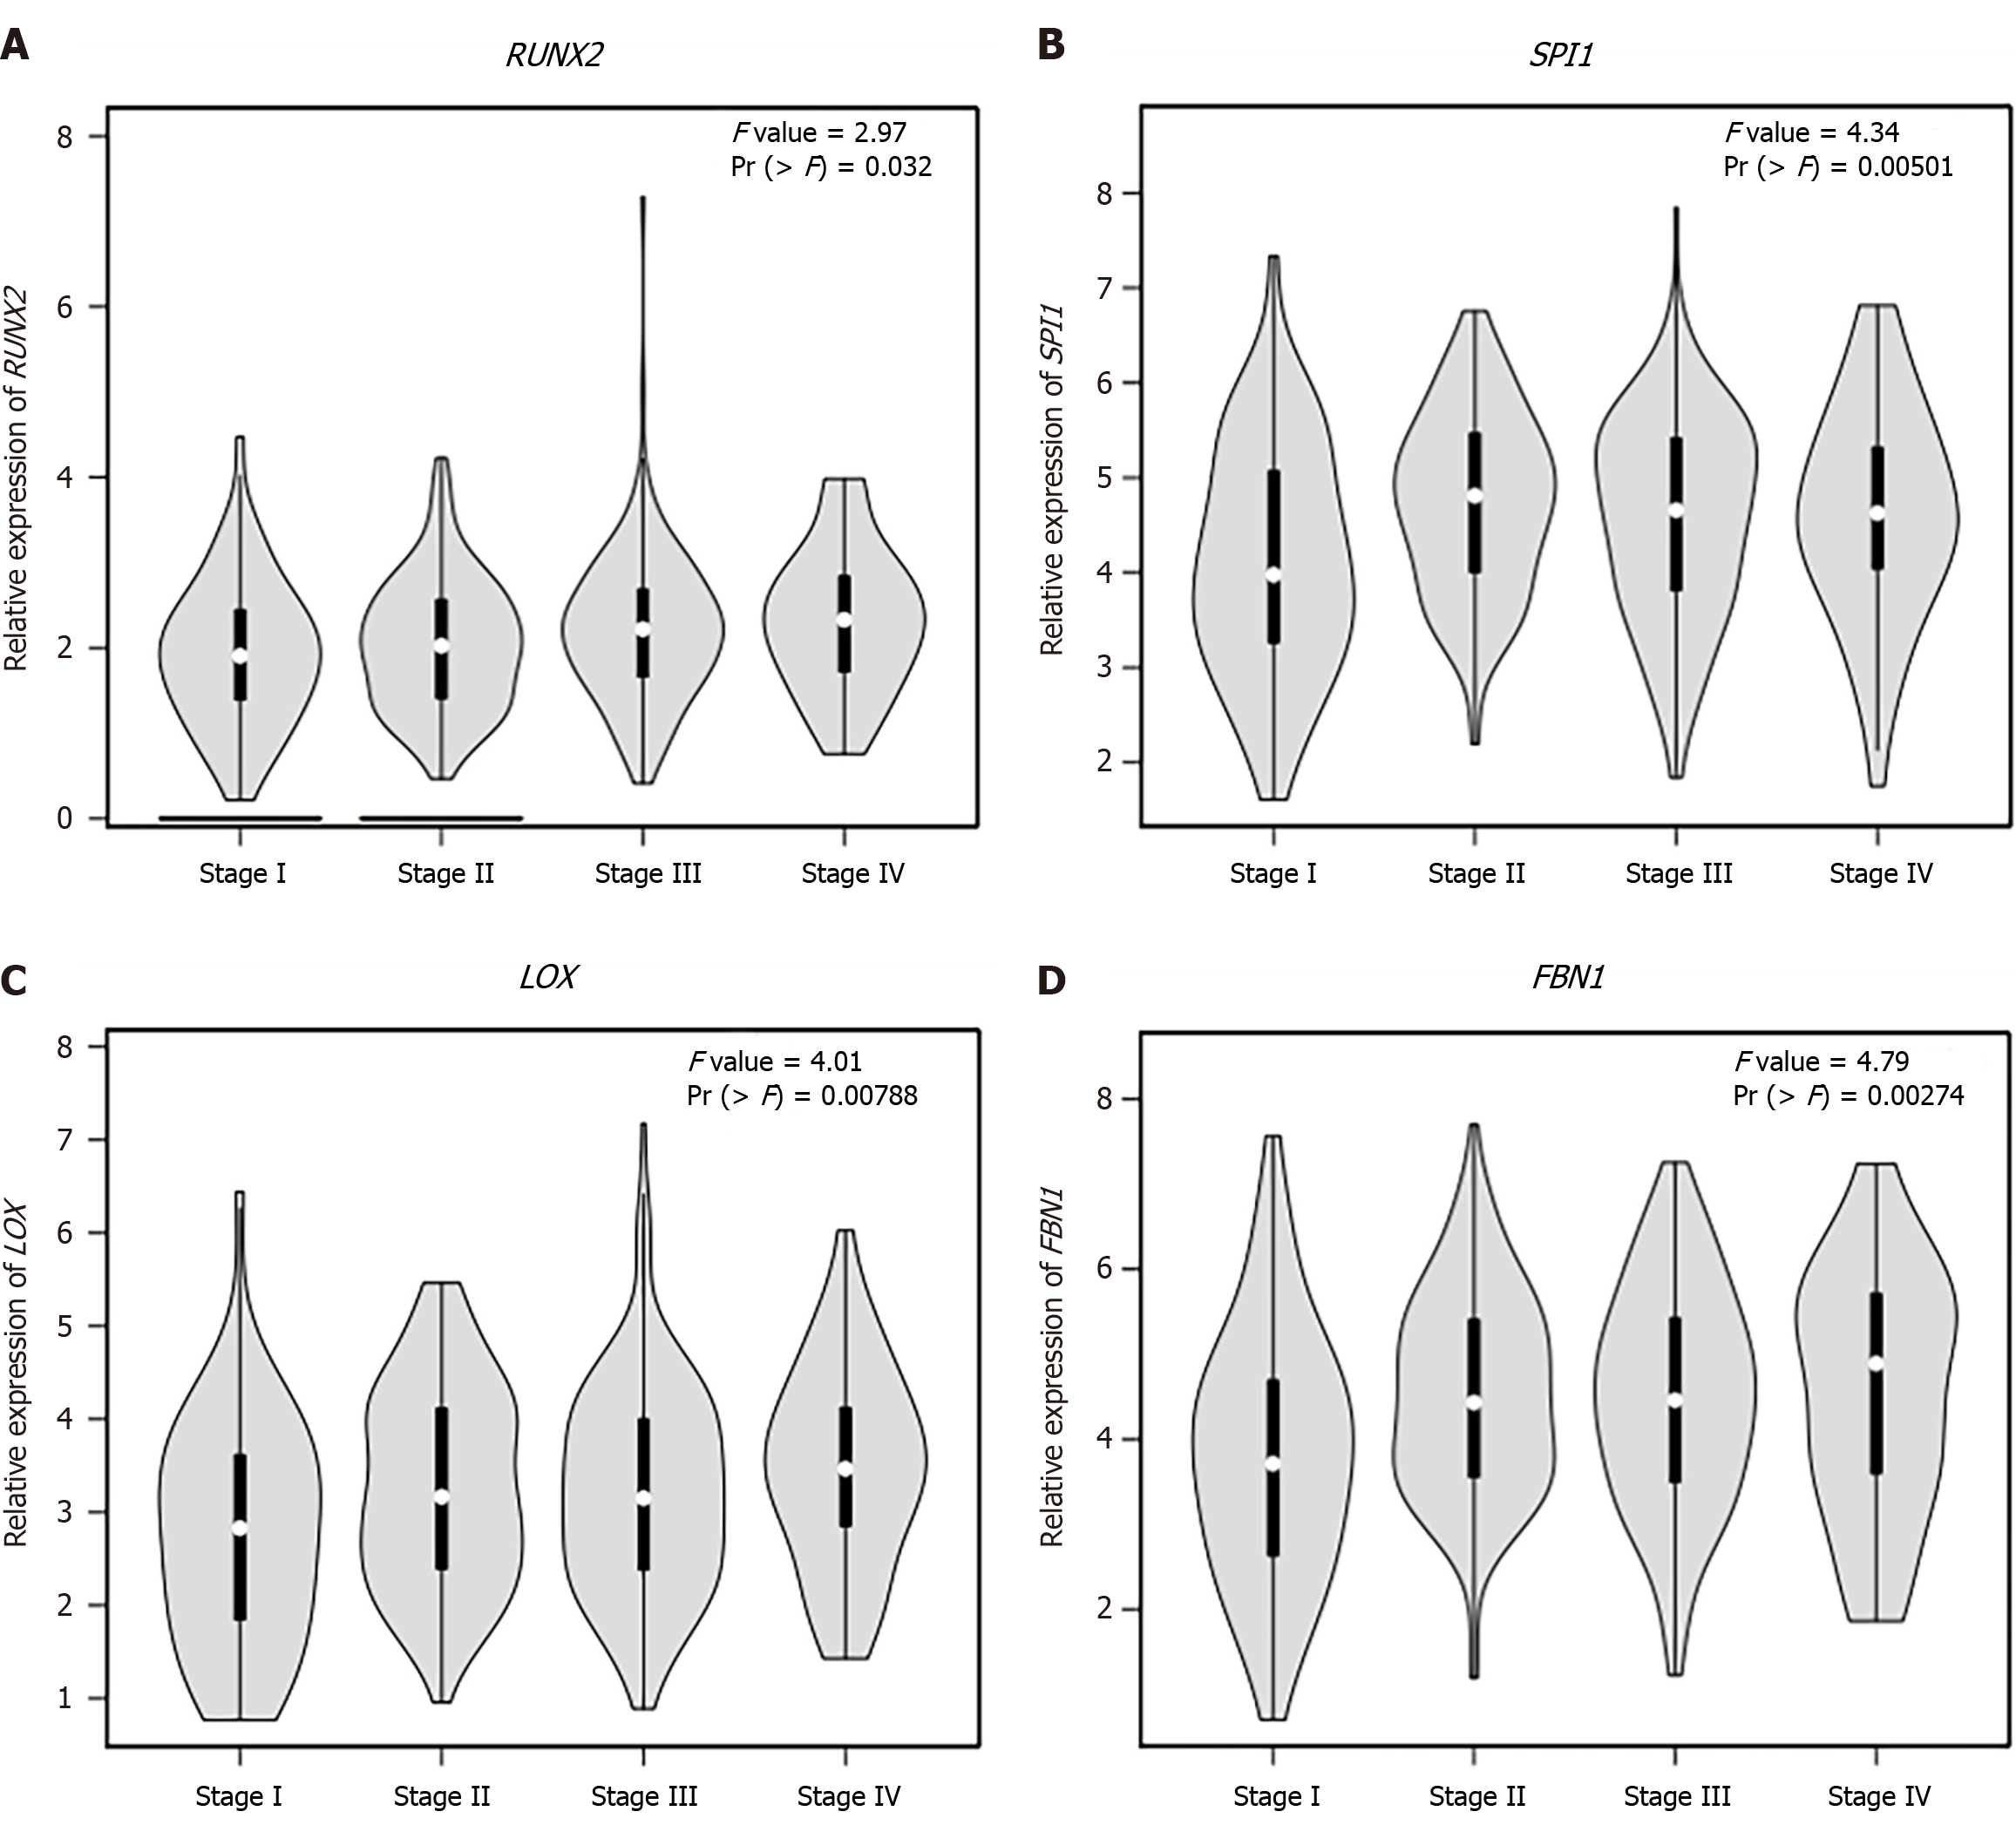
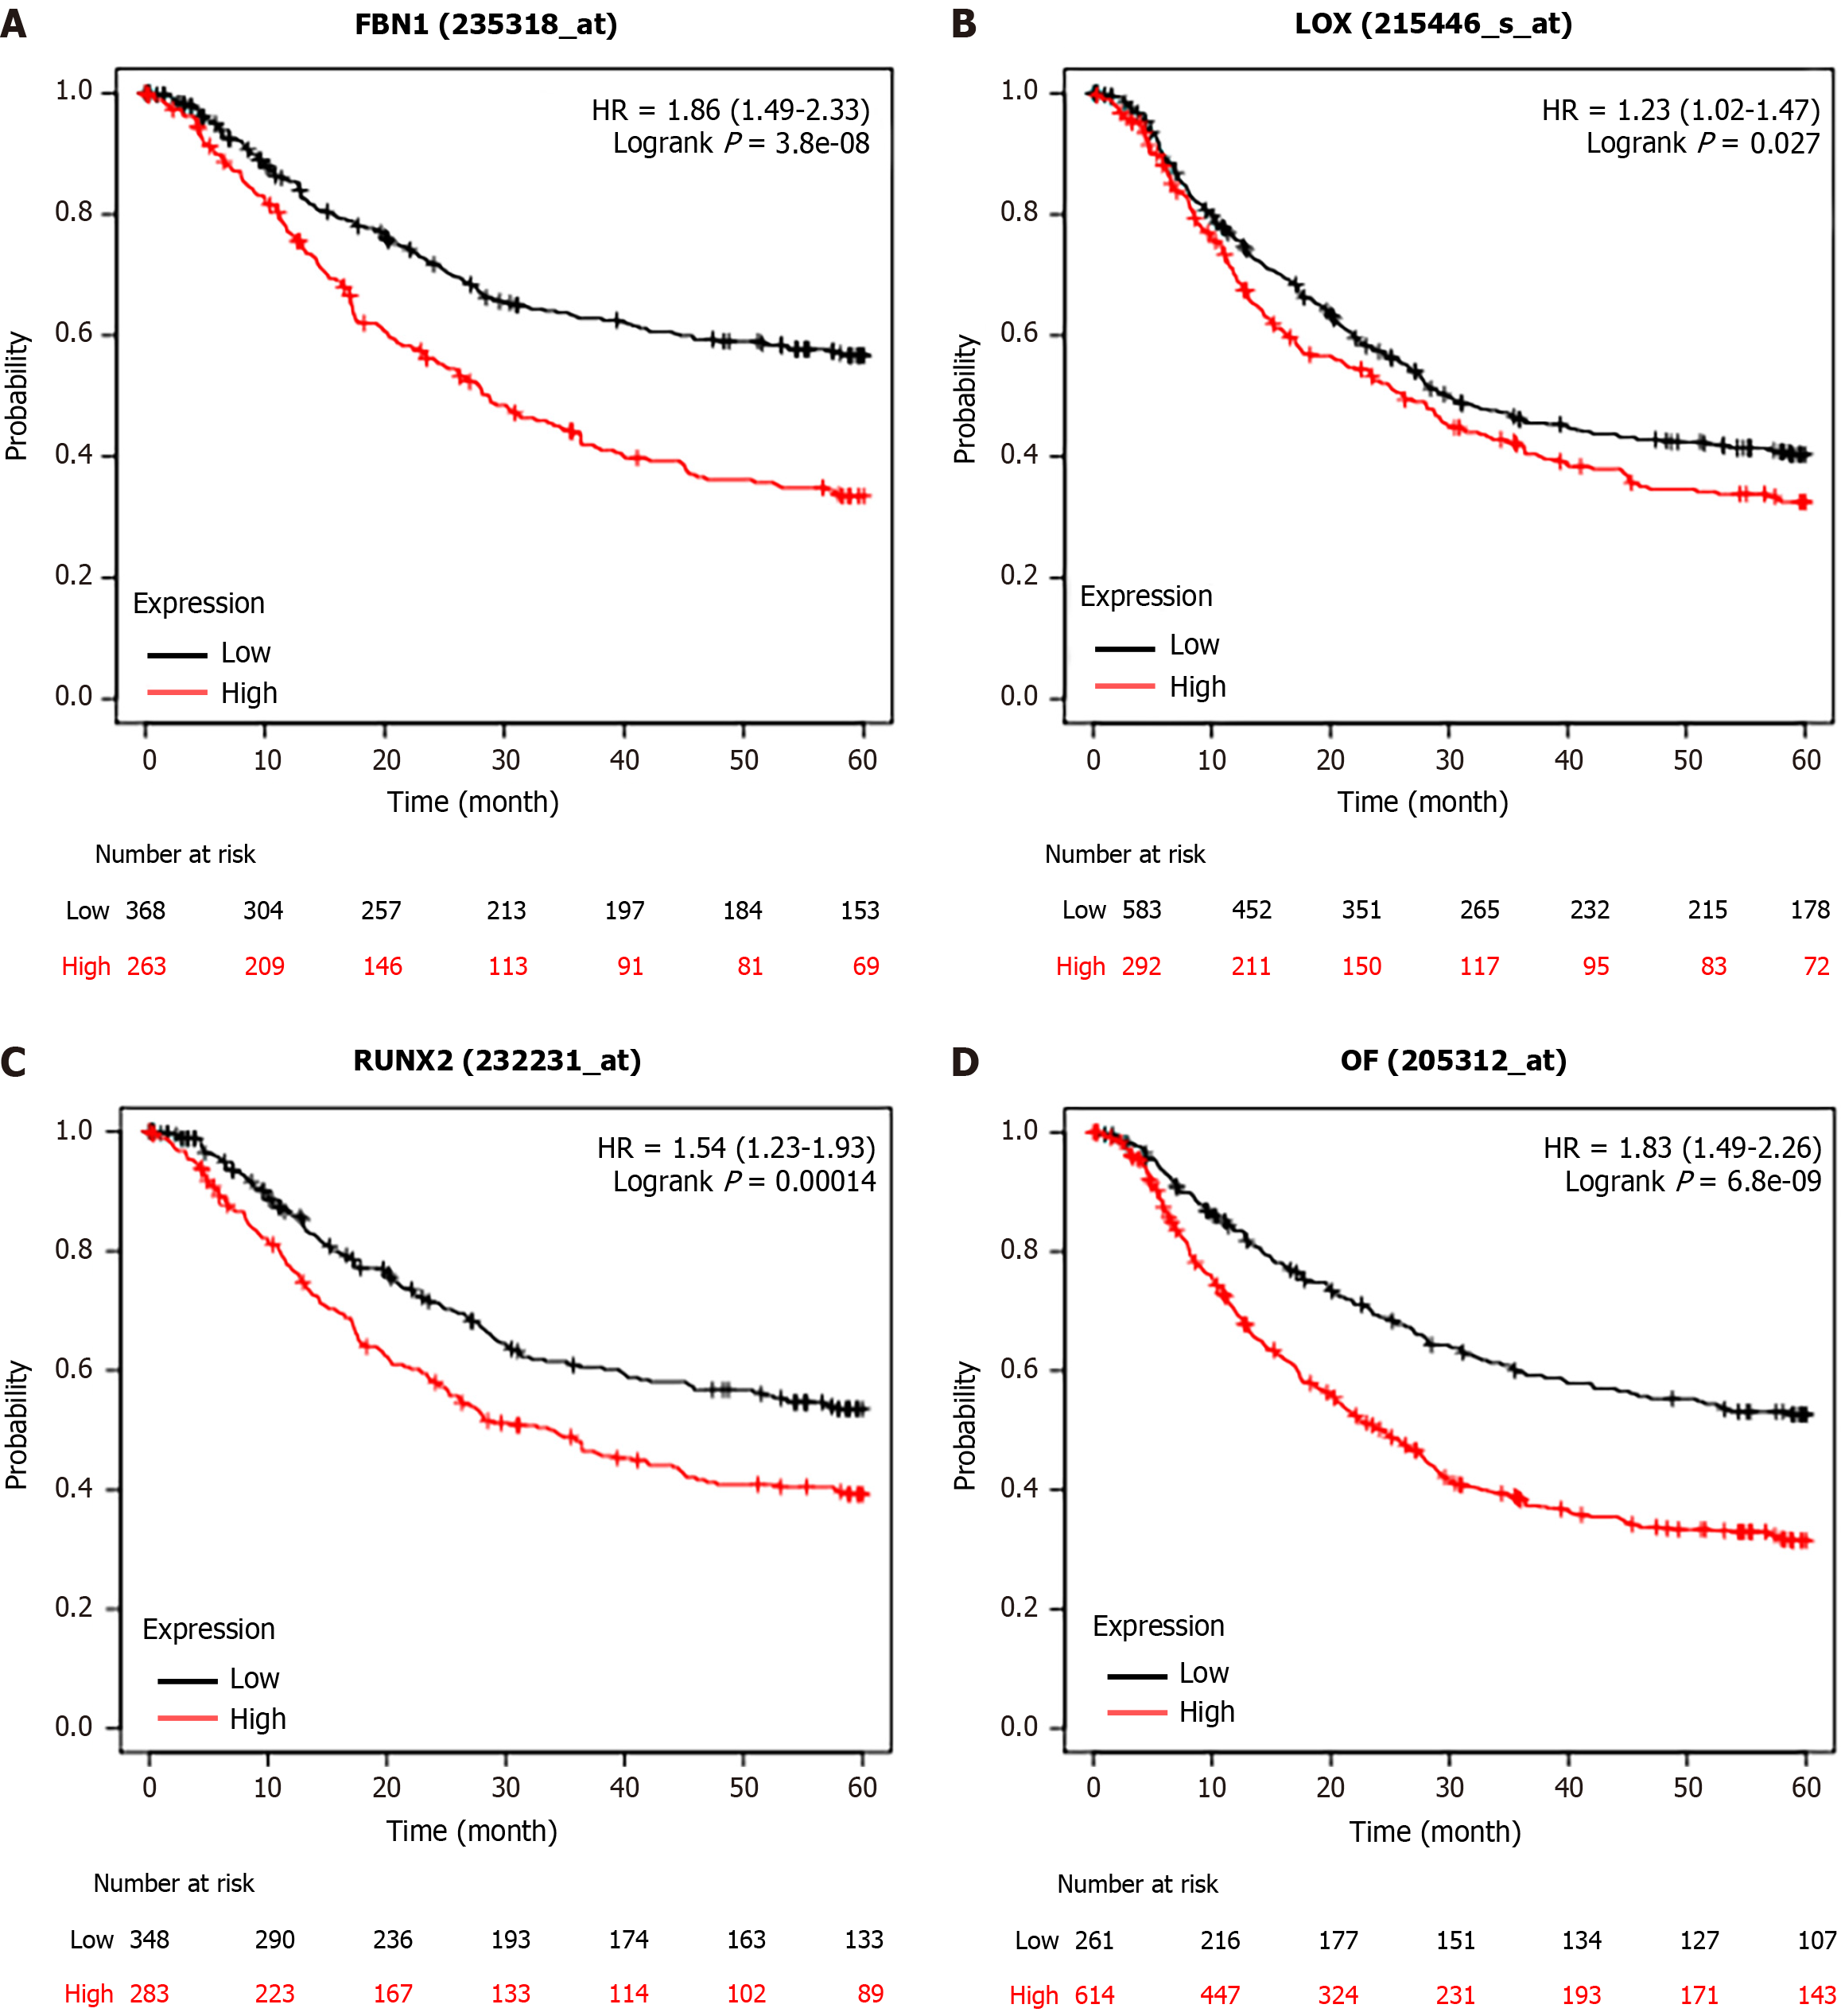
We observed that six upregulated genes, including ACAN. RUNX2, SPI1, LOX, FBN1, and IL2RA, as well as the two downregulated genes, including GC vitamin D binding protein and GPT, could serve as the potential biomarkers for GC diagnosis and prognosis. Subsequently, based on the GEPIA database, the levels of ACAN. RUNX2, SPI1, LOX, FBN1, and IL2RA were found to be significantly higher in STAD samples in comparison to those in the non-tumor samples (Figure 7). The expression levels of RUNX2, SPI1, LOX, and FBN1 were positively correlated with the various clinical stages (Figure 8). As depicted by Kaplan-Meier curves, high expression levels of FBN1, LOX, RUNX2, and SPI1 were positively correlated with the poor overall survival (Figure 9). The expression levels of GC vitamin D binding protein and GPT were noted to be downregulated in STAD samples compared to those in the non-tumor samples (Figure 10A and B). Moreover, high expression of GPT predicted better overall survival (Figure 10C).
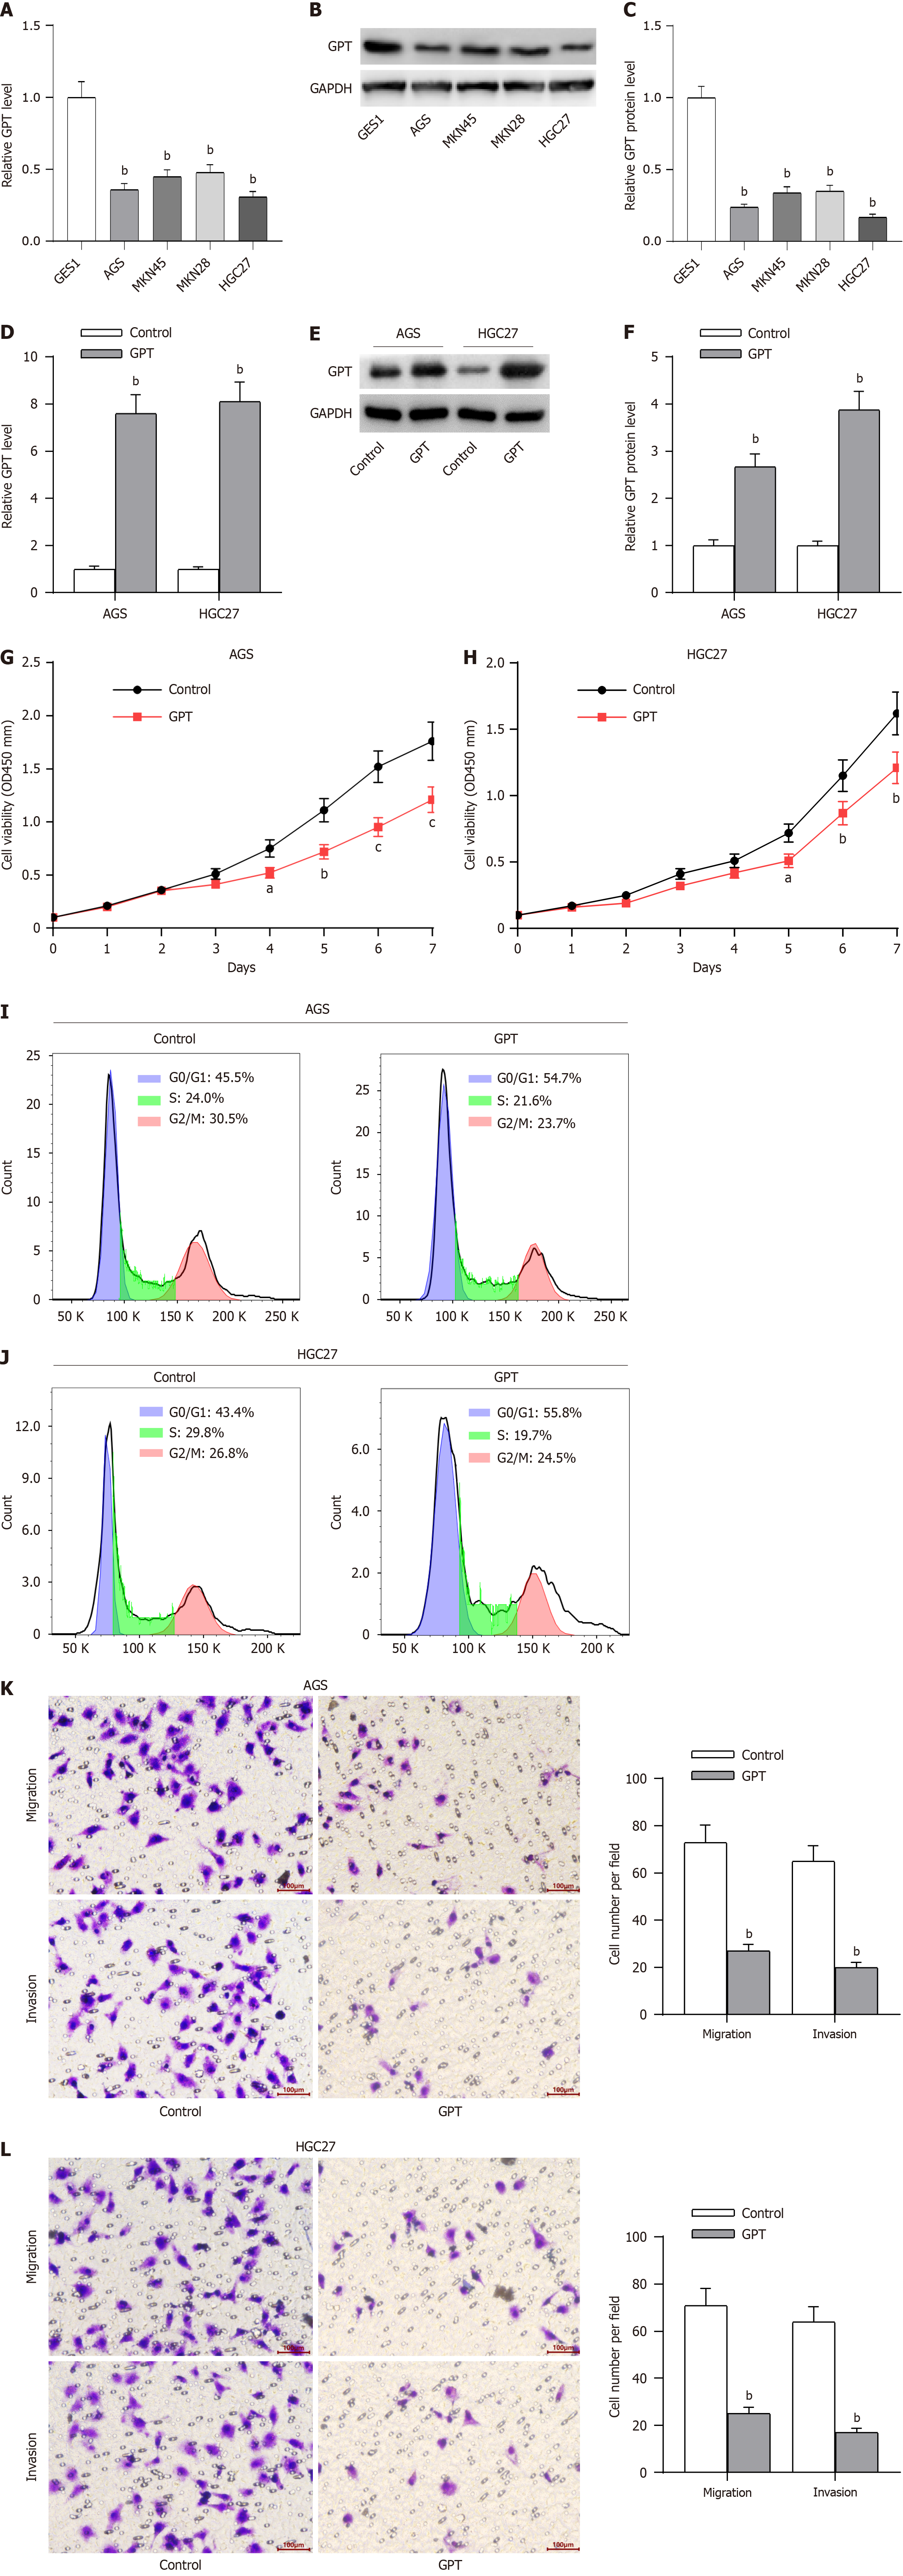
The oncogenic role of all these hub genes (RUNX2, SPI1, LOX and FBN1), except GPT, have been previously reported in GC progression[21-24]. As displayed in Table 1, GPT expression was significantly associated with age, lymph node metastasis, pathological staging and distant metastasis in GC patients. Thereafter, we detected the potential effect of GPT on the various malignant phenotypes of GC cells. RT-qPCR and western blotting assays were conducted to determine the mRNA and protein levels of GPT in GC cells (AGS, MKN45, MKN28 and HGC27) and the normal gastric mucosal cells (GES1). The results revealed that the expression of GPT was significantly downregulated in GC cells in comparison to that in the normal gastric mucosal cells. Interestingly, AGS and HGC27 cells exhibited lower expression of GPT than both MKN45 and MKN28 cells; hence, we used AGS and HGC27 cells for the subsequent experiments (Figure 11A-C). Considering the downregulation of GPT in GC cells, we significantly overexpressed GPT expression in AGS and HGC27 cells by transient transfection. The overexpression efficiency was verified by RT-qPCR and western blotting assays (Figure 11D-F). Thereafter, we investigated the biological functions of GPT overexpression. As demonstrated by CCK-8 assay, GPT upregulation caused a significant inhibition in GC cell viability (Figure 11G-H). The results of flow cytometry also suggested that GPT upregulation exhibited substantial adverse effects on GC cell cycle progression (Figure 11I-J). Finally, transwell assays were performed to evaluate the cell migration and invasion potential of GC cells, and the results revealed that GPT upregulation suppressed both the migrative and invasive abilities of GC cells (Figure 11K-L). Collectively, GPT upregulation could significantly inhibit GC cell proliferation, migration and invasion.
GC is a malignant tumor characterized by high mortality. The progression of GC has been found to be complicated due to the involvement of various genetic and epigenetic modifications[25]. The delayed diagnosis could be attributed to asymptomatic GC at an early stage, and the diagnosis made at an advanced stage (tumor, node, and metastasis) often contributes to its high mortality[26]. Despite efforts to molecularly classify GC, treatment options for this malignancy remain limited[27]. Therefore, identification of the novel therapeutic targets for better clinical applications is critical for both GC diagnosis and treatment. We have analyzed 19214 genes from the GSE183136 dataset, among which there were 250 downregulated genes and 401 upregulated genes with P-value < 0.05. Moreover, the DEGs were divided into BP, CC, and MF groups using the GO functional annotation. In addition, the various enriched pathways of DEGs were detected through the KEGG pathway analysis. Furthermore, PPI networks were constructed based on the various upregulated and downregulated genes, and in total 15 upregulated hub genes and 10 downregulated were found among all the hub genes screened. Finally, a differential expression profile was obtained from the GEPIA database, and a Venn diagram was created to identify the common genes in the hub genes and the differential expression profile. After a comprehensive analysis, five hub genes, including RUNX2, SPI1, LOX, FBN1 and GPT, were found to display prognostic values.
It has been demonstrated that RUNX2 plays an oncogenic role in GC by increasing colony and sphere formation as well as tumorigenesis in GC cells[28]. GC cell invasion and migration are facilitated in vitro by RUNX2 overexpression[29]. Accumulating evidences have suggested a critical role of RUNX2 in GC progression[30-32]. SPI1 is a key factor in regulating the prognosis for GC patients and has been suggested as a possible target for immunotherapy[33]. SPI1 is involved in several pathways associated with proliferation, apoptosis, and angiogenesis in GC[34]. LOX is associated with poor prognosis in GC patients[35-37]. Furthermore, inhibition of FBN1 can suppress proliferation and mobility of in GC cells[24]. In addition, several studies have identified FBN1 as a candidate gene in GC[38,39]. However, the biological functions of GPT in GC progression have not been revealed yet. In the current study, we found that GPT expression was significantly associated with age, lymph node metastasis, pathological staging as well as distant metastasis in GC patients, and GPT upregulation could significantly inhibit the proliferative, migrative and invasive capabilities of GC cells.
In conclusion, this study was able to integrate the gene expression profile of GSE183136 dataset. Five distinct hub genes (RUNX2, SPI1, LOX, FBN1 and GPT) displayed significant prognostic values, and GPT expression was negatively associated with age, lymph node metastasis, pathological staging and distant metastasis of GC patients. in addition, GPT upregulation inhibited the malignant phenotypes of GC cells. However, there are several limitations associated with this study. First, this is a pilot study, and further studies are required to validate the potential biological role of DEGs and hub genes in GC development. Second, in vivo experiments were not conducted in this study, and the possible role of GPT overexpression in GC xenograft models needs to be investigated. Furthermore, for clinical significance and prognosis, protein expression of the hub genes in larger clinical samples should be analyzed. Despite these limitations, this study has discovered several potential biomarkers for GC diagnosis and treatment.
Being one of the most prevalent and lethal cancers globally, gastric cancer (GC) contributes significantly to the overall cancer burden. Due to chemoresistance and metastasis, only 5%–20% of patients with advanced GC survive for five years after diagnosis, and most patients are not able to receive an early diagnosis. The findings of this study shed light on the fundamental mechanisms of GC pathogenesis and has identified new mRNA biomarkers and targets for GC.
The current study was designed to explore the molecular mechanisms involved in GC progression using the bioinformatics methods. We have identified five distinct hub genes that were associated with the development of GC. This study has provided several potential targets regarding GC, which could form the basis of novel strategy to diagnose and treat GC.
The main objectives of this study were to identify the key candidate genes linked with development of GC and to determine the potential pathogenic mechanisms by using integrated bioinformatics analysis. Five distinct hub genes (RUNX2, SPI1, LOX, FBN1 and GPT) were identified as novel biomarkers and targets for GC diagnosis and treatment. The possible effect of GPT on the malignant phenotypes of GC cells and the possible correlation between GPT expression as well as the clinical and pathological features of GC patients were also analyzed. Our results provide a sound theoretical basis for the pathogenesis, clinical diagnosis and therapeutic targets of GC.
The GSE183136 dataset that contains 135 GC samples was downloaded from the Gene Expression Omnibus database, and differentially expressed genes (DEGs) were then identified using the limma package in R software. Thereafter, gene ontology (GO) terms and Kyoto Encyclopedia of Genes and Genomes analyses were performed for enrichment analyses using the clusterProfile package in R software. Subsequently, the protein-protein interaction networks of DEGs were established by STRING and visualized by Cytoscape software. The key hub genes were identified as the overlapping genes that appeared in the cohort of above mentioned DEGs as well the cohort of the DEGs obtained from the GEPIA database Following that, the expression levels of these hub genes and their association with prognosis in GC patients were obtained from the GEPIA database and Kaplan-Meier curves. In addition, cell counting kit-8 assays, flow cytometry as well as transwell assays and a retrospective analysis on 70 GC patients were performed to detect the potential effect of GPT on cell viability, cell cycle, migration and invasion. The association between the expression level of GPT and the clinical and pathological features of GC patients was also examined.
We have identified 250 downregulated and 401 upregulated DEGs. After a comprehensive analysis, five different hub genes (RUNX2, SPI1, LOX, FBN1 and GPT) were selected. In this study, we have mainly focused on GPT, and observed that GPT expression was significantly associated with age, lymph node metastasis, pathological staging and distant metastasis in GC patients. Moreover, based on in vitro analysis, GPT upregulation was able to suppress the proliferative, migrative and invasive capabilities of GC cells. Our results might provide potential targets for GC diagnosis and treatment. The problems that remain to be solved include: (1) Additional studies are required to examine the potential effect of DEGs and hub genes on GC development; (2) in vivo experiments were not performed in this study, and the impact of GPT overexpression in GC xenograft models needs further investigation; and (3) the expression of the hub genes in larger clinical samples to establish the clinical relevance and prognosis are required.
This study has identified several hub genes related to GC development. The methods used in this study have been previously described.
Further investigation is required to detect the effect of GPT on GC development.
Provenance and peer review: Unsolicited article; Externally peer reviewed.
Peer-review model: Single blind
Specialty type: Oncology
Country/Territory of origin: China
Peer-review report’s scientific quality classification
Grade A (Excellent): 0
Grade B (Very good): 0
Grade C (Good): C
Grade D (Fair): 0
Grade E (Poor): 0
P-Reviewer: Mahfuz AMUB, Bangladesh S-Editor: Gong ZM L-Editor: A P-Editor: Zheng XM
| 1. | Torre LA, Bray F, Siegel RL, Ferlay J, Lortet-Tieulent J, Jemal A. Global cancer statistics, 2012. CA Cancer J Clin. 2015;65:87-108. [RCA] [PubMed] [DOI] [Full Text] [Cited by in Crossref: 18694] [Cited by in RCA: 21357] [Article Influence: 2135.7] [Reference Citation Analysis (3)] |
| 2. | Bray F, Ferlay J, Soerjomataram I, Siegel RL, Torre LA, Jemal A. Global cancer statistics 2018: GLOBOCAN estimates of incidence and mortality worldwide for 36 cancers in 185 countries. CA Cancer J Clin. 2018;68:394-424. [RCA] [PubMed] [DOI] [Full Text] [Cited by in Crossref: 53206] [Cited by in RCA: 55721] [Article Influence: 7960.1] [Reference Citation Analysis (132)] |
| 3. | Hou Y, Li C. Stem/Progenitor Cells and Their Therapeutic Application in Cardiovascular Disease. Front Cell Dev Biol. 2018;6:139. [RCA] [PubMed] [DOI] [Full Text] [Full Text (PDF)] [Cited by in Crossref: 12] [Cited by in RCA: 12] [Article Influence: 1.7] [Reference Citation Analysis (0)] |
| 4. | IARC Working Group on the Evaluation of Carcinogenic Risks to Humans. Personal habits and indoor combustions. IARC Monogr Eval Carcinog Risks Hum. 2012;100:1-538. [PubMed] |
| 5. | Siegel R, Ma J, Zou Z, Jemal A. Cancer statistics, 2014. CA Cancer J Clin. 2014;64:9-29. [RCA] [PubMed] [DOI] [Full Text] [Cited by in Crossref: 8789] [Cited by in RCA: 9564] [Article Influence: 869.5] [Reference Citation Analysis (0)] |
| 6. | Camargo MC, Kim WH, Chiaravalli AM, Kim KM, Corvalan AH, Matsuo K, Yu J, Sung JJ, Herrera-Goepfert R, Meneses-Gonzalez F, Kijima Y, Natsugoe S, Liao LM, Lissowska J, Kim S, Hu N, Gonzalez CA, Yatabe Y, Koriyama C, Hewitt SM, Akiba S, Gulley ML, Taylor PR, Rabkin CS. Improved survival of gastric cancer with tumour Epstein-Barr virus positivity: an international pooled analysis. Gut. 2014;63:236-243. [RCA] [PubMed] [DOI] [Full Text] [Cited by in Crossref: 279] [Cited by in RCA: 292] [Article Influence: 26.5] [Reference Citation Analysis (0)] |
| 7. | Deng JY, Liang H. Clinical significance of lymph node metastasis in gastric cancer. World J Gastroenterol. 2014;20:3967-3975. [RCA] [PubMed] [DOI] [Full Text] [Full Text (PDF)] [Cited by in CrossRef: 142] [Cited by in RCA: 152] [Article Influence: 13.8] [Reference Citation Analysis (0)] |
| 8. | Akama Y, Yasui W, Yokozaki H, Kuniyasu H, Kitahara K, Ishikawa T, Tahara E. Frequent amplification of the cyclin E gene in human gastric carcinomas. Jpn J Cancer Res. 1995;86:617-621. [RCA] [PubMed] [DOI] [Full Text] [Full Text (PDF)] [Cited by in Crossref: 114] [Cited by in RCA: 117] [Article Influence: 3.9] [Reference Citation Analysis (0)] |
| 9. | Graziano F, Mandolesi A, Ruzzo A, Bearzi I, Testa E, Arduini F, Silva R, Muretto P, Mari D, Berardi R, Scartozzi M, Lai V, Cascinu S, Magnani M. Predictive and prognostic role of E-cadherin protein expression in patients with advanced gastric carcinomas treated with palliative chemotherapy. Tumour Biol. 2004;25:106-110. [RCA] [PubMed] [DOI] [Full Text] [Cited by in Crossref: 14] [Cited by in RCA: 16] [Article Influence: 0.8] [Reference Citation Analysis (0)] |
| 10. | Tanigawa N, Amaya H, Matsumura M, Shimomatsuya T. Correlation between expression of vascular endothelial growth factor and tumor vascularity, and patient outcome in human gastric carcinoma. J Clin Oncol. 1997;15:826-832. [RCA] [PubMed] [DOI] [Full Text] [Cited by in Crossref: 124] [Cited by in RCA: 134] [Article Influence: 4.8] [Reference Citation Analysis (0)] |
| 11. | Sanz-Ortega J, Steinberg SM, Moro E, Saez M, Lopez JA, Sierra E, Sanz-Esponera J, Merino MJ. Comparative study of tumor angiogenesis and immunohistochemistry for p53, c-ErbB2, c-myc and EGFr as prognostic factors in gastric cancer. Histol Histopathol. 2000;15:455-462. [RCA] [PubMed] [DOI] [Full Text] [Cited by in RCA: 25] [Reference Citation Analysis (0)] |
| 12. | Cho JY, Lim JY, Cheong JH, Park YY, Yoon SL, Kim SM, Kim SB, Kim H, Hong SW, Park YN, Noh SH, Park ES, Chu IS, Hong WK, Ajani JA, Lee JS. Gene expression signature-based prognostic risk score in gastric cancer. Clin Cancer Res. 2011;17:1850-1857. [RCA] [PubMed] [DOI] [Full Text] [Full Text (PDF)] [Cited by in Crossref: 257] [Cited by in RCA: 280] [Article Influence: 20.0] [Reference Citation Analysis (0)] |
| 13. | Chen CN, Lin JJ, Chen JJ, Lee PH, Yang CY, Kuo ML, Chang KJ, Hsieh FJ. Gene expression profile predicts patient survival of gastric cancer after surgical resection. J Clin Oncol. 2005;23:7286-7295. [RCA] [PubMed] [DOI] [Full Text] [Cited by in Crossref: 93] [Cited by in RCA: 104] [Article Influence: 5.2] [Reference Citation Analysis (0)] |
| 14. | Wang X, Liu Y, Niu Z, Fu R, Jia Y, Zhang L, Shao D, Du H, Hu Y, Xing X, Cheng X, Li L, Guo T, Li Z, Ji Q, Ji J. Prognostic value of a 25-gene assay in patients with gastric cancer after curative resection. Sci Rep. 2017;7:7515. [RCA] [PubMed] [DOI] [Full Text] [Full Text (PDF)] [Cited by in Crossref: 7] [Cited by in RCA: 9] [Article Influence: 1.1] [Reference Citation Analysis (0)] |
| 15. | Ren J, Hu Z, Niu G, Xia J, Wang X, Hong R, Gu J, Wang D, Ke C. Annexin A1 induces oxaliplatin resistance of gastric cancer through autophagy by targeting PI3K/AKT/mTOR. FASEB J. 2023;37:e22790. [RCA] [PubMed] [DOI] [Full Text] [Cited by in RCA: 26] [Reference Citation Analysis (0)] |
| 16. | Livak KJ, Schmittgen TD. Analysis of relative gene expression data using real-time quantitative PCR and the 2(-Delta Delta C(T)) Method. Methods. 2001;25:402-408. [RCA] [PubMed] [DOI] [Full Text] [Cited by in Crossref: 149116] [Cited by in RCA: 133449] [Article Influence: 5560.4] [Reference Citation Analysis (1)] |
| 17. | Fan HN, Chen ZY, Chen XY, Chen M, Yi YC, Zhu JS, Zhang J. METTL14-mediated m(6)A modification of circORC5 suppresses gastric cancer progression by regulating miR-30c-2-3p/AKT1S1 axis. Mol Cancer. 2022;21:51. [RCA] [PubMed] [DOI] [Full Text] [Full Text (PDF)] [Cited by in Crossref: 14] [Cited by in RCA: 135] [Article Influence: 45.0] [Reference Citation Analysis (0)] |
| 18. | Chen T, Wang Y, Yang Y, Yu K, Cao X, Su F, Xu H, Peng Y, Hu Y, Qian F, Wang Z. Gramicidin inhibits human gastric cancer cell proliferation, cell cycle and induced apoptosis. Biol Res. 2019;52:57. [RCA] [PubMed] [DOI] [Full Text] [Full Text (PDF)] [Cited by in Crossref: 7] [Cited by in RCA: 11] [Article Influence: 1.8] [Reference Citation Analysis (0)] |
| 19. | Wu J, Tian B, Yang J, Huo H, Song Z, Yu J, Gu Y. Reduction of Hip2 suppresses gastric cancer cell proliferation, migration, invasion and tumorigenesis. Transl Cancer Res. 2020;9:774-785. [RCA] [PubMed] [DOI] [Full Text] [Full Text (PDF)] [Cited by in Crossref: 8] [Cited by in RCA: 3] [Article Influence: 0.6] [Reference Citation Analysis (0)] |
| 20. | Wang R, Sun Y, Yu W, Yan Y, Qiao M, Jiang R, Guan W, Wang L. Downregulation of miRNA-214 in cancer-associated fibroblasts contributes to migration and invasion of gastric cancer cells through targeting FGF9 and inducing EMT. J Exp Clin Cancer Res. 2019;38:20. [RCA] [PubMed] [DOI] [Full Text] [Full Text (PDF)] [Cited by in Crossref: 77] [Cited by in RCA: 126] [Article Influence: 21.0] [Reference Citation Analysis (0)] |
| 21. | Wang Y, Tan Z, Li X, Zhang L, Pei X. RUNX2 promotes gastric cancer progression through the transcriptional activation of MGAT5 and MMP13. Front Oncol. 2023;13:1133476. [RCA] [PubMed] [DOI] [Full Text] [Cited by in RCA: 3] [Reference Citation Analysis (0)] |
| 22. | Qiu P, Li X, Gong M, Wen P, Wen J, Xu L, Wang G. SPI1 Mediates N-Myristoyltransferase 1 to Advance Gastric Cancer Progression via PI3K/AKT/mTOR Pathway. Can J Gastroenterol Hepatol. 2023;2023:2021515. [RCA] [PubMed] [DOI] [Full Text] [Cited by in RCA: 2] [Reference Citation Analysis (0)] |
| 23. | Li Q, Zhu CC, Ni B, Zhang ZZ, Jiang SH, Hu LP, Wang X, Zhang XX, Huang PQ, Yang Q, Li J, Gu JR, Xu J, Luo KQ, Zhao G, Zhang ZG. Lysyl oxidase promotes liver metastasis of gastric cancer via facilitating the reciprocal interactions between tumor cells and cancer associated fibroblasts. EBioMedicine. 2019;49:157-171. [RCA] [PubMed] [DOI] [Full Text] [Full Text (PDF)] [Cited by in Crossref: 27] [Cited by in RCA: 72] [Article Influence: 12.0] [Reference Citation Analysis (0)] |
| 24. | Yang D, Zhao D, Chen X. MiR-133b inhibits proliferation and invasion of gastric cancer cells by up-regulating FBN1 expression. Cancer Biomark. 2017;19:425-436. [RCA] [PubMed] [DOI] [Full Text] [Cited by in Crossref: 22] [Cited by in RCA: 35] [Article Influence: 5.0] [Reference Citation Analysis (0)] |
| 25. | Song W, Liu YY, Peng JJ, Liang HH, Chen HY, Chen JH, He WL, Xu JB, Cai SR, He YL. Identification of differentially expressed signatures of long non-coding RNAs associated with different metastatic potentials in gastric cancer. J Gastroenterol. 2016;51:119-129. [RCA] [PubMed] [DOI] [Full Text] [Full Text (PDF)] [Cited by in Crossref: 26] [Cited by in RCA: 30] [Article Influence: 3.3] [Reference Citation Analysis (0)] |
| 26. | Patru CL, Surlin V, Georgescu I, Patru E. Current issues in gastric cancer epidemiology. Rev Med Chir Soc Med Nat Iasi. 2013;117:199-204. [PubMed] |
| 27. | Lee JW, Sung JS, Park YS, Chung S, Kim YH. Identification of different gene expressions between diffuse- and intestinal-type spheroid-forming gastric cancer cells. Gastric Cancer. 2019;22:967-979. [RCA] [PubMed] [DOI] [Full Text] [Cited by in Crossref: 4] [Cited by in RCA: 9] [Article Influence: 1.5] [Reference Citation Analysis (0)] |
| 28. | Guo Z, Zhou K, Wang Q, Huang Y, Ji J, Peng Y, Zhang X, Zheng T, Zhang Z, Chong D, Yang Z. The transcription factor RUNX2 fuels YAP1 signaling and gastric cancer tumorigenesis. Cancer Sci. 2021;112:3533-3544. [RCA] [PubMed] [DOI] [Full Text] [Full Text (PDF)] [Cited by in Crossref: 5] [Cited by in RCA: 30] [Article Influence: 7.5] [Reference Citation Analysis (0)] |
| 29. | Li Y, Sun R, Zhao X, Sun B. RUNX2 promotes malignant progression in gastric cancer by regulating COL1A1. Cancer Biomark. 2021;31:227-238. [RCA] [PubMed] [DOI] [Full Text] [Cited by in Crossref: 4] [Cited by in RCA: 22] [Article Influence: 5.5] [Reference Citation Analysis (0)] |
| 30. | Zhou S, Zhang S, Wang L, Huang S, Yuan Y, Yang J, Wang H, Li X, Wang P, Zhou L, Xu Y, Gao H, Zhang Y, Lv Y, Zou X. BET protein inhibitor JQ1 downregulates chromatin accessibility and suppresses metastasis of gastric cancer via inactivating RUNX2/NID1 signaling. Oncogenesis. 2020;9:33. [RCA] [PubMed] [DOI] [Full Text] [Full Text (PDF)] [Cited by in Crossref: 22] [Cited by in RCA: 66] [Article Influence: 13.2] [Reference Citation Analysis (0)] |
| 31. | Fu J, Zhao W, Guo D, Li Z. LncRNA E2F-Mediated Cell Proliferation Enhancing lncRNA Regulates Cancer Cell Behaviors and Affects Prognosis of Gastric Cancer. Dig Dis Sci. 2020;65:1348-1354. [RCA] [PubMed] [DOI] [Full Text] [Cited by in Crossref: 8] [Cited by in RCA: 11] [Article Influence: 2.2] [Reference Citation Analysis (0)] |
| 32. | Jin W, Han H, Liu D. Downregulation miR-539 is associated with poor prognosis of gastric cancer patients and aggressive progression of gastric cancer cells. Cancer Biomark. 2019;26:183-191. [RCA] [PubMed] [DOI] [Full Text] [Cited by in Crossref: 12] [Cited by in RCA: 14] [Article Influence: 2.3] [Reference Citation Analysis (0)] |
| 33. | Huang J, Chen W, Jie Z, Jiang M. Comprehensive Analysis of Immune Implications and Prognostic Value of SPI1 in Gastric Cancer. Front Oncol. 2022;12:820568. [RCA] [PubMed] [DOI] [Full Text] [Full Text (PDF)] [Cited by in Crossref: 6] [Cited by in RCA: 7] [Article Influence: 2.3] [Reference Citation Analysis (0)] |
| 34. | Bahramian S, Sahebi R, Roohinejad Z, Delshad E, Javid N, Amini A, Razavi AE, Shafiee M, Shamsabadi FT. Low expression of LncRNA-CAF attributed to the high expression of HIF1A in esophageal squamous cell carcinoma and gastric cancer patients. Mol Biol Rep. 2022;49:895-905. [RCA] [PubMed] [DOI] [Full Text] [Cited by in Crossref: 4] [Cited by in RCA: 11] [Article Influence: 3.7] [Reference Citation Analysis (0)] |
| 35. | Zhu J, Luo C, Zhao J, Zhu X, Lin K, Bu F, Yu Z, Zou F, Zhu Z. Expression of LOX Suggests Poor Prognosis in Gastric Cancer. Front Med (Lausanne). 2021;8:718986. [RCA] [PubMed] [DOI] [Full Text] [Full Text (PDF)] [Cited by in Crossref: 21] [Cited by in RCA: 19] [Article Influence: 4.8] [Reference Citation Analysis (0)] |
| 36. | Nai A, Zeng H, Wu Q, He Z, Zeng S, Bashir S, Ma F, He J, Wan W, Xu M. lncRNA/miR-29c-Mediated High Expression of LOX Can Influence the Immune Status and Chemosensitivity and Can Forecast the Poor Prognosis of Gastric Cancer. Front Cell Dev Biol. 2021;9:760470. [RCA] [PubMed] [DOI] [Full Text] [Full Text (PDF)] [Cited by in Crossref: 5] [Cited by in RCA: 12] [Article Influence: 4.0] [Reference Citation Analysis (0)] |
| 37. | Zhang Q, Jin XS, Yang ZY, Wei M, Zhu XC, Wang P, Liu BY, Gu QL. Upregulated expression of LOX is a novel independent prognostic marker of worse outcome in gastric cancer patients after curative surgery. Oncol Lett. 2013;5:896-902. [RCA] [PubMed] [DOI] [Full Text] [Full Text (PDF)] [Cited by in Crossref: 16] [Cited by in RCA: 18] [Article Influence: 1.4] [Reference Citation Analysis (0)] |
| 38. | Wang J, Gao P, Song Y, Sun J, Chen X, Yu H, Wang Y, Wang Z. Prognostic value of gastric cancer-associated gene signatures: Evidence based on a meta-analysis using integrated bioinformatics methods. J Cell Mol Med. 2018;22:5743-5747. [RCA] [PubMed] [DOI] [Full Text] [Full Text (PDF)] [Cited by in Crossref: 13] [Cited by in RCA: 20] [Article Influence: 2.9] [Reference Citation Analysis (0)] |
| 39. | Tian Y, Xing Y, Zhang Z, Peng R, Zhang L, Sun Y. Bioinformatics Analysis of Key Genes and circRNA-miRNA-mRNA Regulatory Network in Gastric Cancer. Biomed Res Int. 2020;2020:2862701. [RCA] [PubMed] [DOI] [Full Text] [Full Text (PDF)] [Cited by in Crossref: 9] [Cited by in RCA: 23] [Article Influence: 4.6] [Reference Citation Analysis (0)] |


