Copyright
©The Author(s) 2024.
World J Gastrointest Oncol. Feb 15, 2024; 16(2): 414-435
Published online Feb 15, 2024. doi: 10.4251/wjgo.v16.i2.414
Published online Feb 15, 2024. doi: 10.4251/wjgo.v16.i2.414
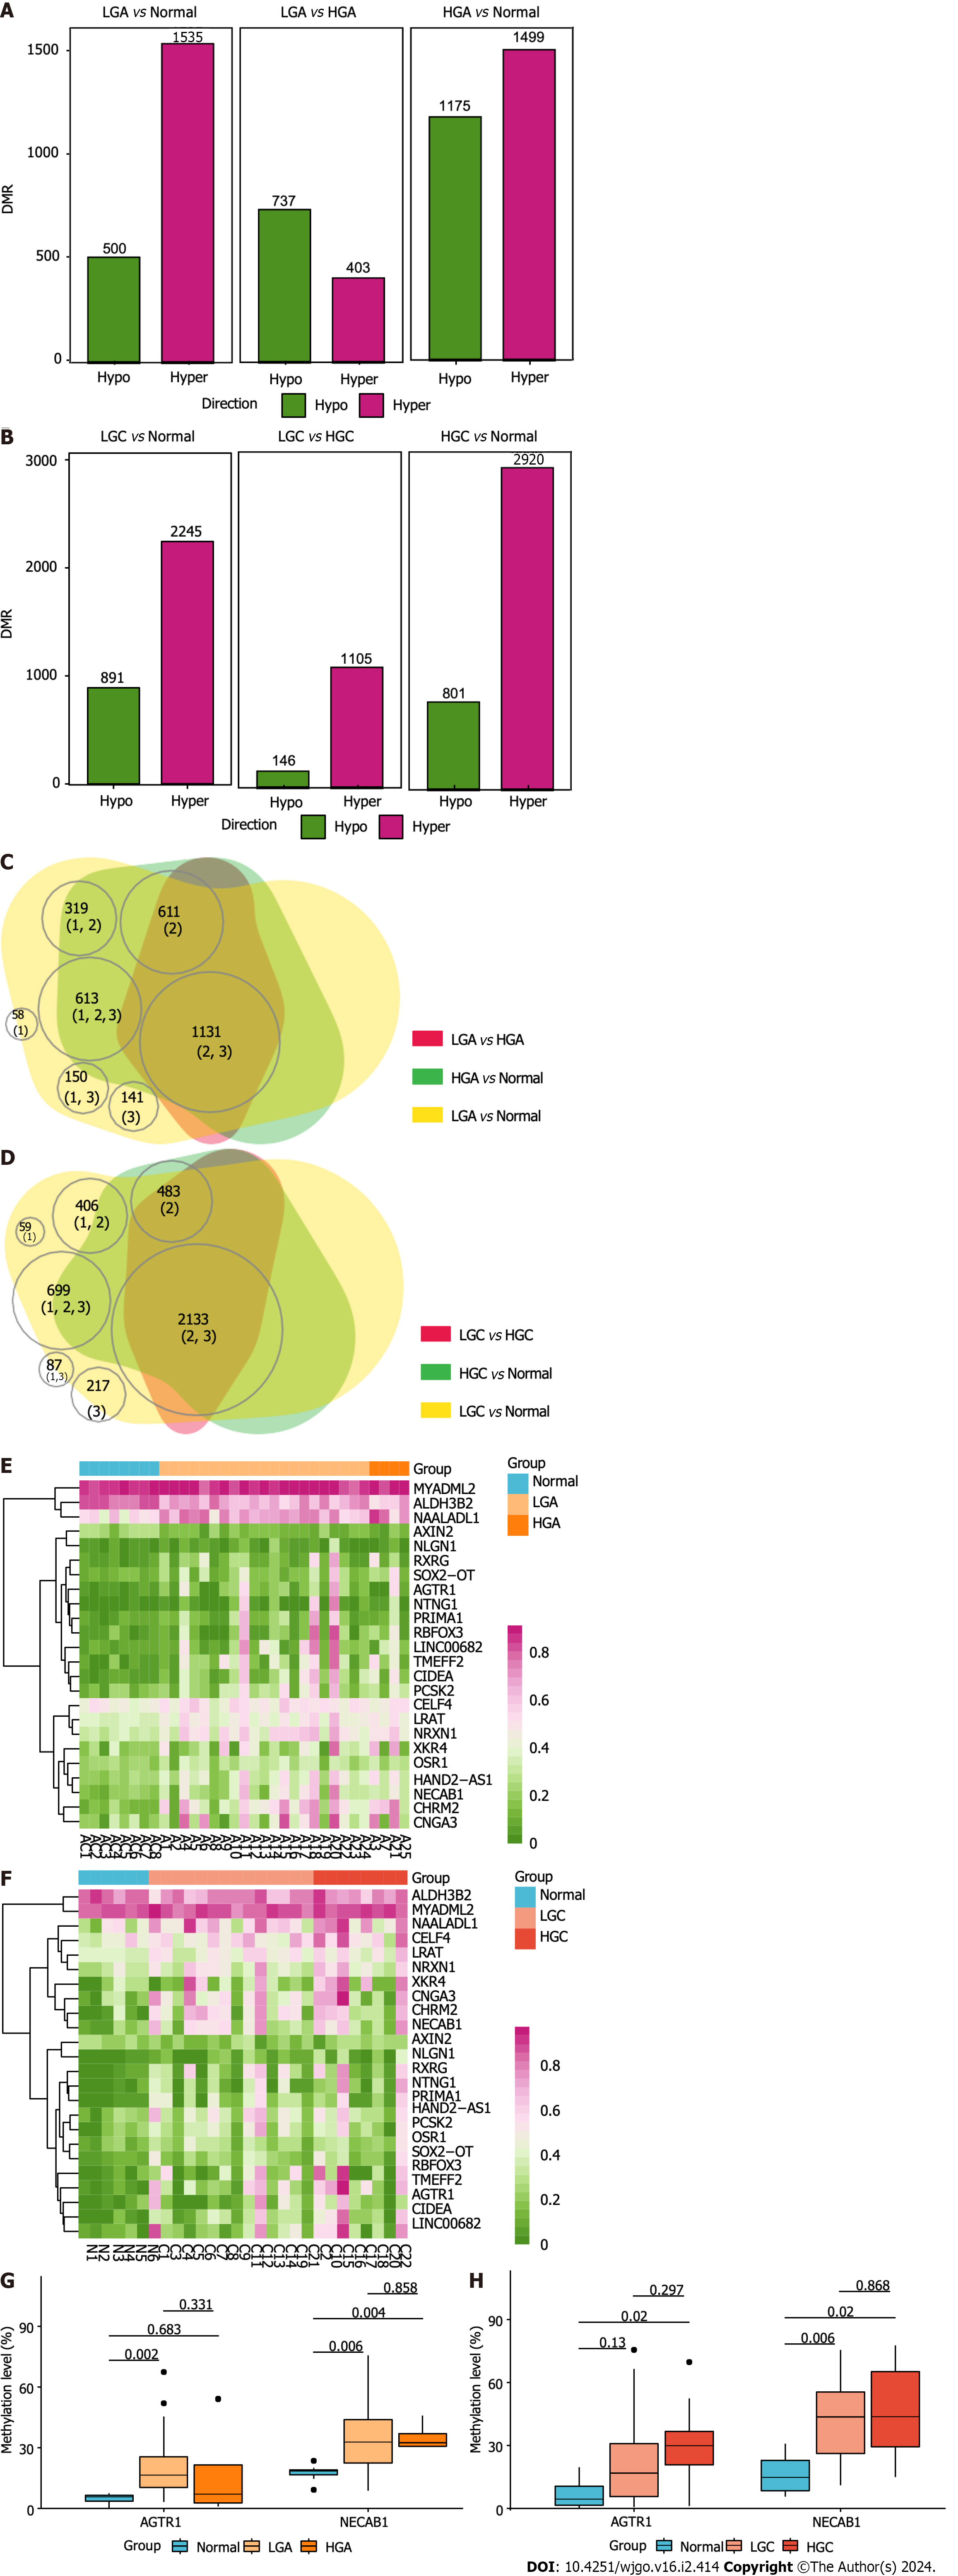
Figure 8 Genome-wide DNA methylation in colorectal cancer and adenoma of different grades.
A: Differentially methylated regions (DMRs) between low-grade adenoma (LGA) and normal tissues, high-grade adenoma (HGA) and normal tissue, and HGA and LGA; B: DMRs between low-grade cancer (LGC) and normal tissues, high-grade cancer (HGC) and normal tissue, and HGC and LGC; C: Venn plot highlighting the relationships among all DMRs in ADE of different grades; D: Venn plot highlighting the relationships among all DMRs in CRC of different grades; E: The methylation-regulated differentially expressed gene (meDEG) methylation pattern in ADE of different grades; F: The meDEG methylation pattern in CRC of different grades; G: Expression level differences in AGTR1 and NECAB1 between different grades of ADE; H: Expression level differences in AGTR1 and NECAB1 between different grades of CRC. DMRs: Differentially methylated regions; LGA: Low-grade adenoma; HGA: High-grade adenoma; LGC: Low-grade cancer; HGC: High-grade cancer.
- Citation: Lu YW, Ding ZL, Mao R, Zhao GG, He YQ, Li XL, Liu J. Early results of the integrative epigenomic-transcriptomic landscape of colorectal adenoma and cancer. World J Gastrointest Oncol 2024; 16(2): 414-435
- URL: https://www.wjgnet.com/1948-5204/full/v16/i2/414.htm
- DOI: https://dx.doi.org/10.4251/wjgo.v16.i2.414


