Published online Feb 15, 2024. doi: 10.4251/wjgo.v16.i2.414
Peer-review started: August 17, 2023
First decision: November 6, 2023
Revised: November 24, 2023
Accepted: December 22, 2023
Article in press: December 22, 2023
Published online: February 15, 2024
Processing time: 169 Days and 7.3 Hours
Aberrant methylation is common during the initiation and progression of colorectal cancer (CRC), and detecting these changes that occur during early adenoma (ADE) formation and CRC progression has clinical value.
To identify potential DNA methylation markers specific to ADE and CRC.
Here, we performed SeqCap targeted bisulfite sequencing and RNA-seq analysis of colorectal ADE and CRC samples to profile the epigenomic-transcriptomic landscape.
Comparing 22 CRC and 25 ADE samples, global methylation was higher in the former, but both showed similar methylation patterns regarding differentially methylated gene positions, chromatin signatures, and repeated elements. High-grade CRC tended to exhibit elevated methylation levels in gene promoter regions compared to those in low-grade CRC. Combined with RNA-seq gene expression data, we identified 14 methylation-regulated differentially expressed genes, of which only AGTR1 and NECAB1 methylation had prognostic significance.
Our results suggest that genome-wide alterations in DNA methylation occur during the early stages of CRC and demonstrate the methylation signatures associated with colorectal ADEs and CRC, suggesting prognostic biomarkers for CRC.
Core Tip: Despite enhanced global methylation in colorectal cancer (CRC), both adenoma and CRC share similar methylation patterns. High-grade CRC tends to exhibit elevated methylation levels in gene promoter regions compared to those in low-grade CRC. The integration of gene expression data identified 14 methylation-regulated differentially expressed genes, with AGTR1 and NECAB1 methylation being prognostically significant.
- Citation: Lu YW, Ding ZL, Mao R, Zhao GG, He YQ, Li XL, Liu J. Early results of the integrative epigenomic-transcriptomic landscape of colorectal adenoma and cancer. World J Gastrointest Oncol 2024; 16(2): 414-435
- URL: https://www.wjgnet.com/1948-5204/full/v16/i2/414.htm
- DOI: https://dx.doi.org/10.4251/wjgo.v16.i2.414
Mortality due to colorectal cancer (CRC) has increased worldwide[1]. In China, this disease is the third most common malignancy and the fourth leading cause of cancer-related deaths[2]. CRC is caused by the accumulation of genetic and epigenetic modifications, and the adenoma (ADE)-carcinoma progression pathway accounts for 65%-70% of CRC cases[3]. Many epigenetic alterations have been identified using next-generation sequencing; however, only a few have been translated into clinical settings.
Increasing evidence suggests that epigenetic factors play important roles in CRC initiation and progression. Among the various epigenetic modifications, methylation has been the most extensively studied in this disease. Several studies have employed genome-wide methylation analyses to identify methylation biomarkers in CRC[4-9]. ADEs are precursors of CRC, and Luo et al[10] found that methylation modifications are early events during the progression from tubular ADEs to CRC. Moreover, ADEs share certain methylation modifications with CRC[11]. As such, the detection of methylation modifications occurring in ADE is crucial for identifying novel markers, which could improve CRC detection and prognosis. However, comprehensive studies on colorectal ADE and CRC with respect to DNA methylation and gene expression profiles are still lacking.
In this study, we used SeqCap targeted bisulfite sequencing to identify common epigenetic patterns in ADE and CRC. Compared to the widely used Illumina HumanMethylation EPIC BeadChip, this technology covers more CpG sites, thus achieving higher coverage[12]. Moreover, we used RNA-seq to detect the methylation signatures that orchestrate transcriptional dysregulation. Finally, we explored the clinical significance of these methylation markers using The Cancer Genome Atlas Colon Adenocarcinoma (TCGA-COAD) database.
Twenty-six colorectal tumors, 29 colorectal ADEs, and 18 adjacent normal tissues were collected from patients at the First Affiliated Hospital of Kunming Medical University (Kunming, China). Written informed consent was obtained from all patients for genomic analysis. This study was approved by the Ethics Committee of the First Affiliated Hospital of Kunming Medical University. Adjacent normal tissue samples (at least 5 cm away from the tumor) were obtained through surgical resection of the intestine. The clinical characteristics of the patients are shown in Supplementary Table 1. All samples used in this study were obtained at the time of diagnosis, before treatment.
The genomic DNA of these tissues was extracted using the TIANamp Genomic DNA Kit (TIANGEN, China), and total RNA was extracted from the tissue samples using the RNA Easy Fast Tissue/Cell Kit (TIANGEN, China), according to the manufacturer’s instructions. The concentration and quality of DNA and RNA were assessed using a Qubit fluorometer (Thermo Fisher Scientific).
An EZ Methylation-Direct Kit (Zymo Research, CA, United States) was used to perform bisulfite conversion. To construct the target bisulfite sequencing library, we used the NimbleGen SeqCap Epi Enrichment System to capture the target genomic regions according to the manufacturer’s protocols. Paired-end sequencing (100 bp) was performed on an Illumina HiSeq 2500 platform (Illumina, San Diego, CA, United States) according to the manufacturer’s protocol.
FastQC (v0.11.3) was used to assess sequence quality and generate quality reports. Bisulfite sequencing reads were pre-processed using Trimmomatic (v0.39). Both 6 bp Illumina adapters and low-quality sequences (base quality < 20) were filtered out prior to the analysis. The remaining reads were aligned against the human genome (GRCh38) using Bismark (v0.23.1)[13] with the following parameter settings: -bowtie2 -parallel 4 -N 0 -L 20 -quiet -un. The methylation status of each CpG was determined using the Bismark methylation extractor function, and only methylation within the CpG context was retained for further analysis (Supplementary Table 2).
The R package methylKit (v1.20.0)[14] was used for the differential methylation analysis. CpG sites with low (< 5’) or extremely high (> 99th percentile) coverage were excluded. CpG sites mapped to X and Y chromosomes or mitochondria were removed, and those shared by all samples were retained for further analysis. We merged the CpG site methylation profiles of the 61 samples based on CpG coordinates, yielding 822353 CpG sites covered by all samples. CpG sites that overlapped with an SNP from dbSNP build 151 were removed, and 811441 CpG sites were retained for further analysis.
For the analysis of differentially methylated positions (DMPs), an absolute methylation difference > 20% and a false discovery rate (FDR) < 0.05 were used. For the analysis of differentially methylated regions (DMRs), the genome was tiled based on a window size of 200 bp with a step size of 200 bp, and the CpG methylation rates were averaged across multiple sites within the region. Next, the differences between the two groups were tested using the calculated DiffMeth function provided by methylKit. The DMRs were determined using the following thresholds: > 5 CpGs in the DMRs, absolute methylation difference > 10%, and FDR < 0.05.
Chromatin state annotations were generated using ChromHMM (v1.18)[15]. We generated an 18-state model with 11 healthy human tissues and one cell line using the LearnModel function to predict the chromatin state[15].
The LOLA package (v1.24.0)[16] was used to annotate the methylation data using histone marks, chromatin states, and repetitive DNA element databases. Genomic enrichment analyses were performed as previously described[17]. Histone and chromatin states were derived from 11 healthy human tissues and one cell line from the NIH Roadmap Epigenomics region data[18]. Repetitive DNA element databases were obtained using the UCSC table browser.
DMPs and DMRs were annotated to hg38 CpG and gene features using the annotatr package (v1.20.0). TCGA COAD-derived DMPs were annotated in the IlluminaHumanMethylation450kanno.ilmn12.hg19 package (v1.40.0).
RNA-sequencing libraries were constructed using a TruSeq RNA Sample Preparation Kit (Illumina). Transcriptome data were mapped using hisat2 (v2.2.1). The read counts were quantified using featureCounts (v2.0.0). Finally, differentially expressed genes (DEGs) were identified using DESeq2 (v1.36.0) with an FDR < 0.05.
TCGA data were obtained using the TCGA biolinks package (beta values at the CpG sites were obtained). HM450K DNA data were processed using the ChAMP package[19].
TCGA mRNA expression data for colon cancer were also obtained using the TCGAbiolink package. The expression matrix was normalized using DESeq2 (v1.36.0). Finally, the DEGs were screened using DESeq2.
First, we identified differentially methylated genes (DMGs) located in the gene promoter. We then overlapped the DMGs with the DEGs, and the remaining genes were candidate methylation-regulated DEGs (meDEGs). Candidate meDEG expression and methylation analyses were performed using TCGA HM450 microarray and RNA-seq data from COAD. Hypermethylated genes and those for which expression was downregulated were selected for further analysis. Spearman rank correlation analysis was performed on the beta values and gene expression levels for these gene-probe pairs using the psych package. The threshold was set at rho values < -0.2 and an FDR < 0.05.
Survival analysis was performed using survminer and survivor packages. Kaplan-Meier curves were used to compare the survival between the high- and low-methylation groups. The median methylation level of the selected gene was used as the cutoff point.
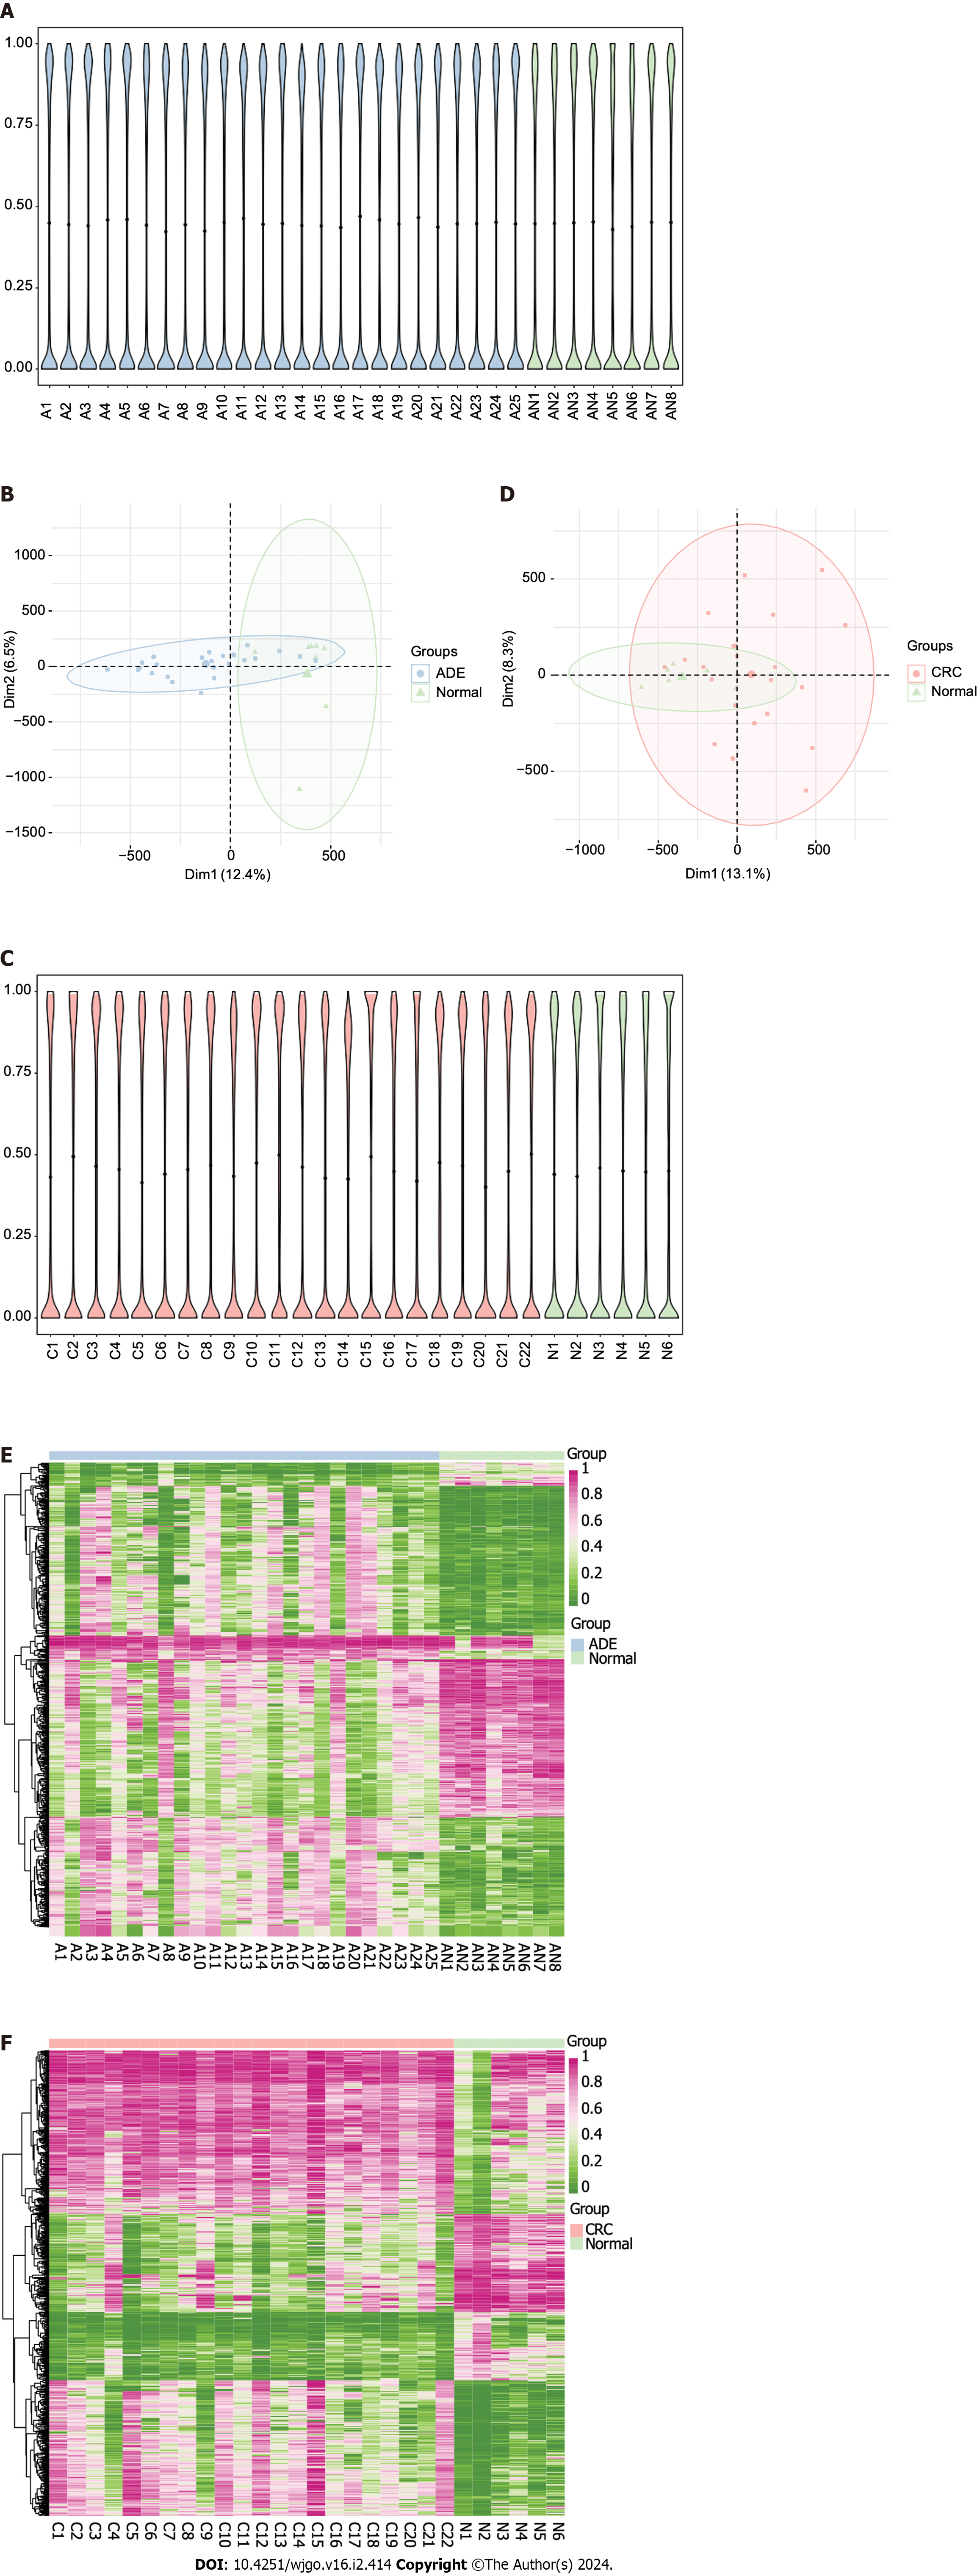
To investigate the methylation changes associated with ADE and CRC, we compared the methylation patterns in these tissues with those in normal samples. The average methylation values of ADE and normal samples were 0.42 and 0.41, respectively, and we found no significant differences in methylation at CpG sites between these groups (Wilcoxon rank-sum P = 0.75; Figure 1A). However, principal component analysis (PCA) clustering suggested differences between the ADE and control groups, as they were separated across the most meaningful dimensions (Figure 1B). The average methylation values of CRC and normal samples were 0.45 and 0.40, respectively, and CRC samples tended to have higher methylation values (Wilcoxon rank-sum test, P = 0.12; Figure 1C). Moreover, PCA clustering showed some overlap between the CRC and normal groups (Figure 1D).
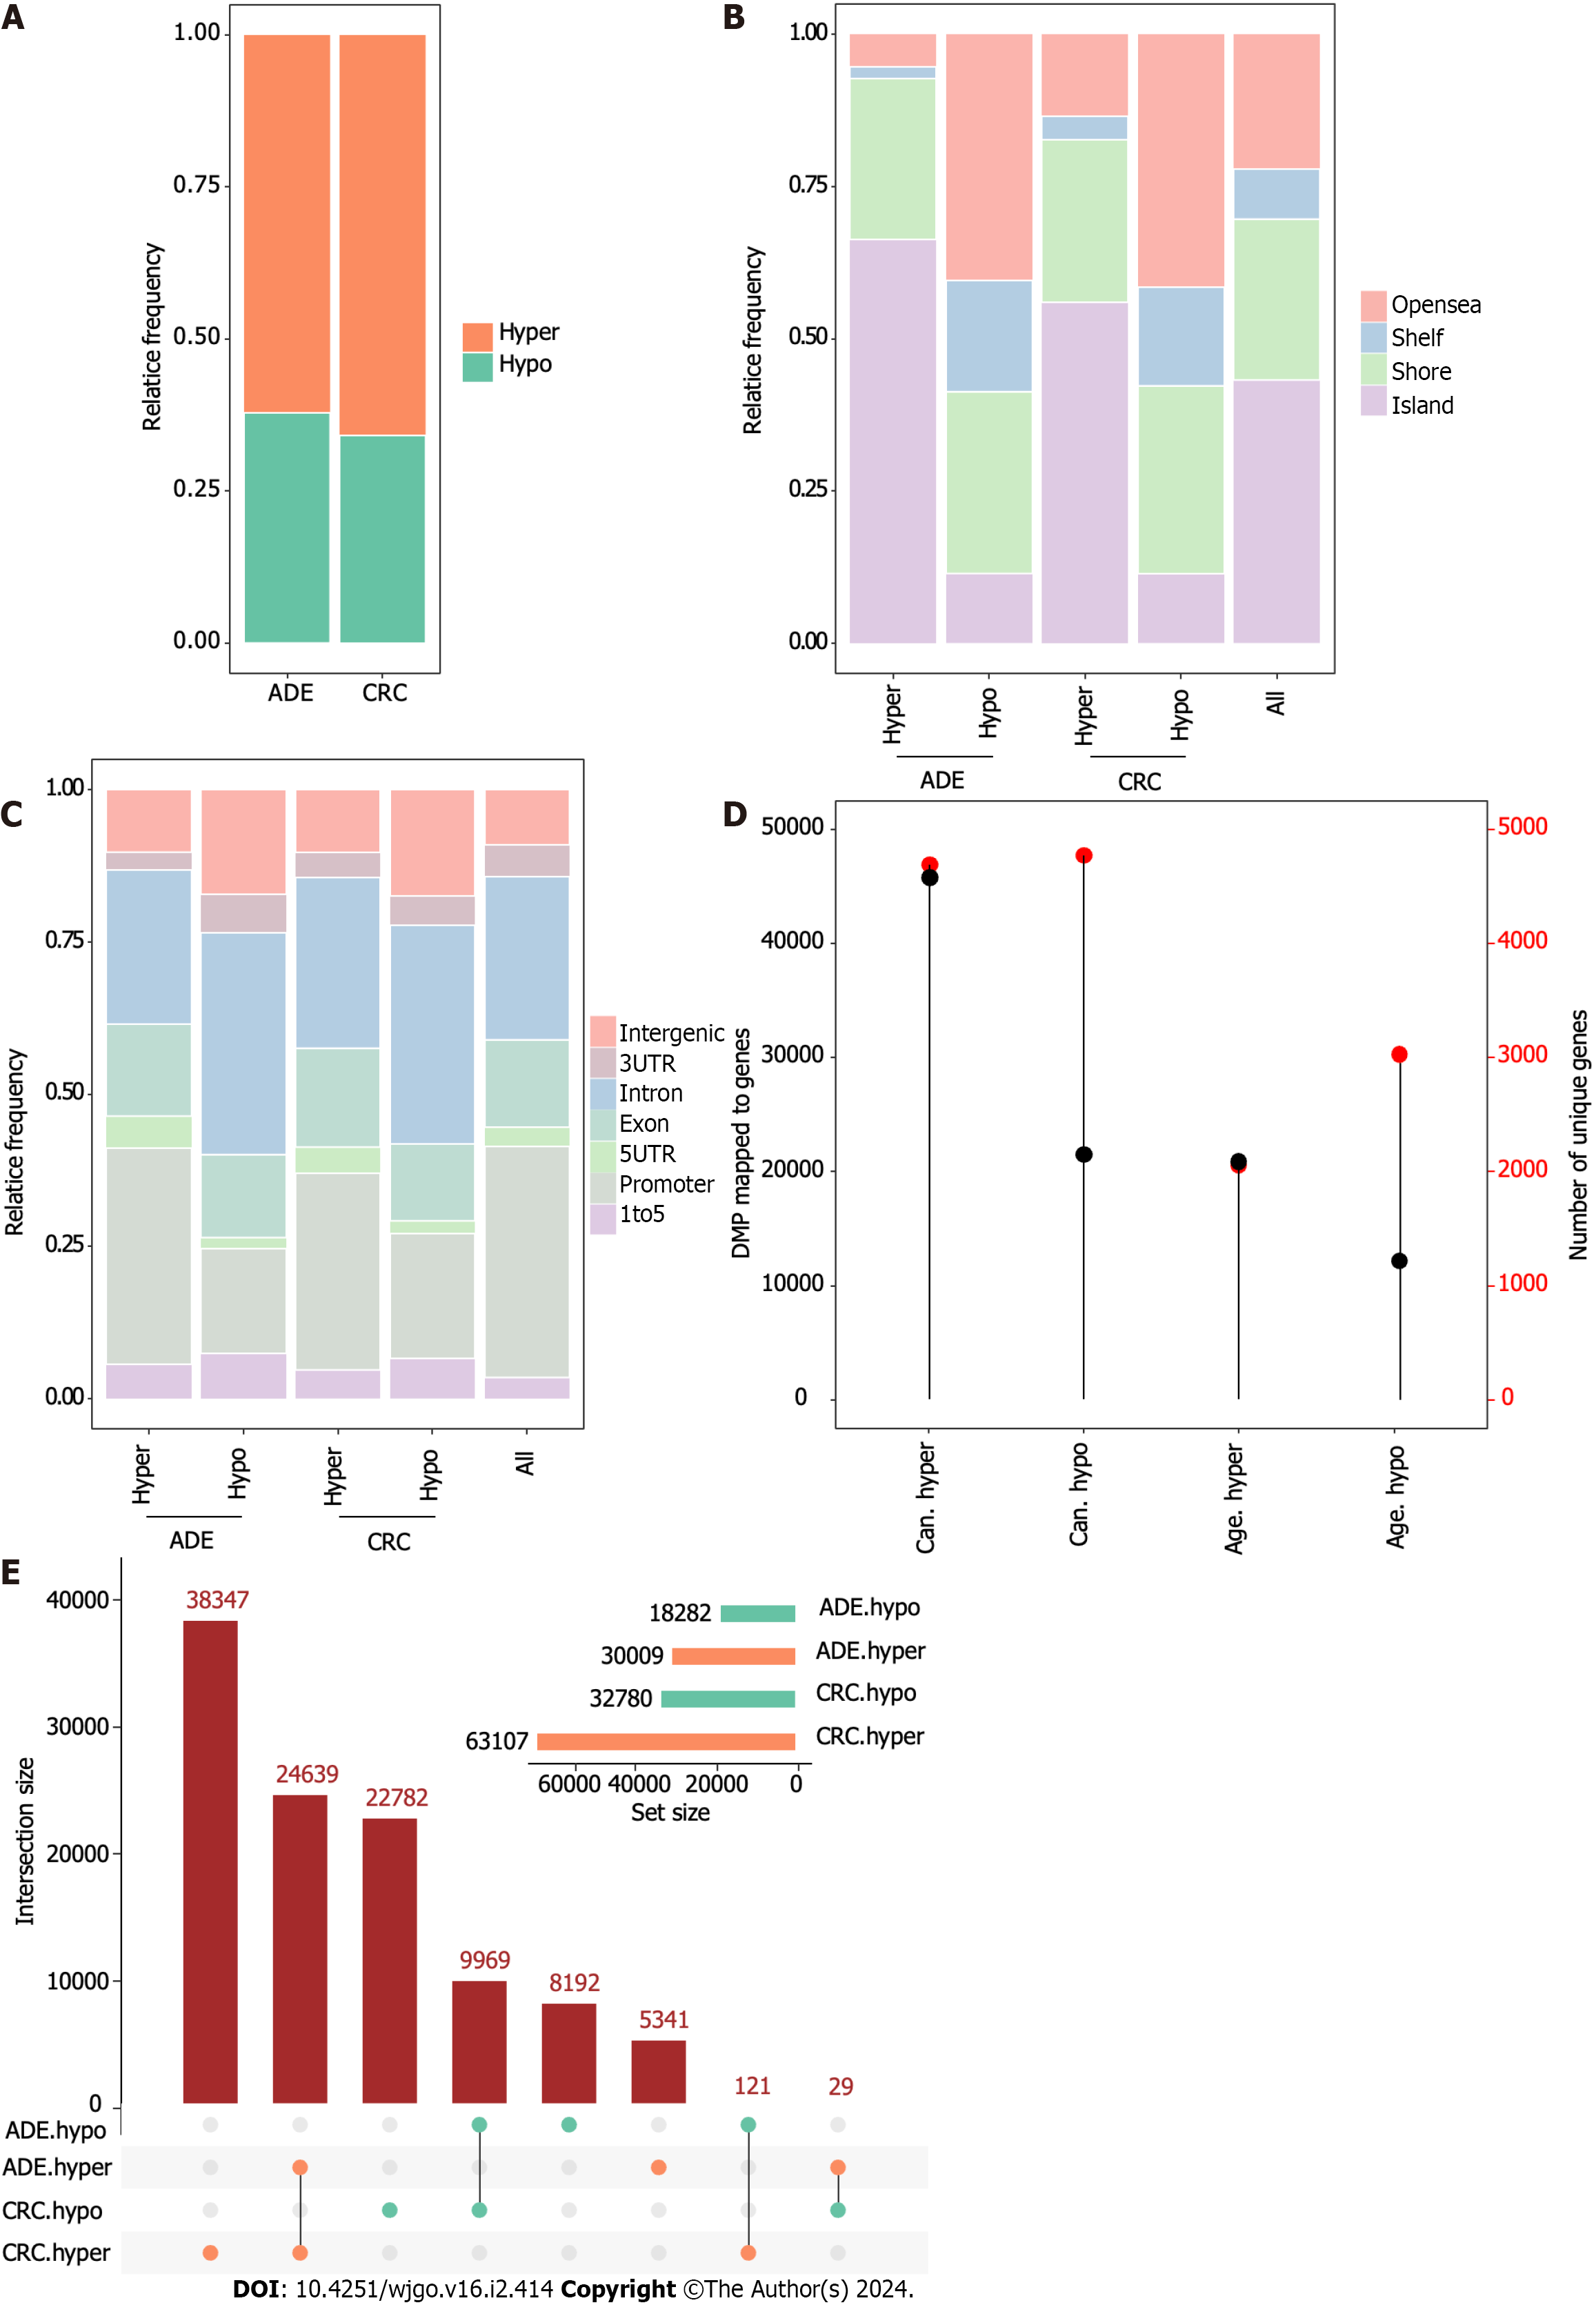
We then performed differential methylation analysis with a specific threshold (absolute methylation difference > 20% and FDR < 0.05) to define the DMPs between ADE and CRC. We identified substantial alterations in both conditions, identifying 48291 DMPs associated with ADE (30009 hypermethylation and 18282 hypomethylation; Figure 1E; a list of ADE DMPs is available in Supplementary Table 3) and 95887 associated with CRC (63107 hypermethylation and 32780 hypomethylation; Figure 1F; a list of CRC DMPs is available in Supplementary Table 4). Hypermethylation was more frequently observed at CpG sites in both ADE and CRC samples.
Hypermethylation was the predominant event in both ADE and CRC [accounting for 62% (30009/48291) and 66% (63107/95887) of the changes, respectively; Figure 2A]. To investigate the possible functional consequences of methylation alterations, we first annotated the DMPs with CpG island features. We observed that hypermethylation occurred more commonly at CpG islands in ADE and CRC, with Fisher’s P < 0.001 and odds ratios (ORs) = 2.7 and 5.3, respectively. In contrast, hypomethylation in ADE and CRC was more common at open sea and shelf locations, with Fisher’s P < 0.001 and ORs of 2.4 and 2.6 for open sea and ORs = 2.6 and 2.3 for shelf locations, respectively (Figure 2B).
Regarding gene locations, CRC and ADE displayed similar patterns. DMPs comprising hypermethylation occurred preferentially at 1-5k regions and 5’ untranslated regions (UTRs), with Fisher’s P < 0.001, ORs = 1.7 and 1.4 for 1-5k regions, and ORs = 1.8 and 1.4, respectively, for 5’UTRs. DMPs comprising hypomethylation were enriched at 1-5k and intergenic and intronic sequences, with Fisher’s P < 0.001, ORs = 2.3 and 2.0 for 1-5k regions, ORs = 2.1 and 2.2 for intergenic sequences, and ORs = 1.6 and 1.6 for intronic sequences, respectively (Figure 2C). Subsequently, we found that the hypermethylated DMP count was higher in both ADE and CRC, but the number of CpGs that mapped to genes was similar. These results suggest that hypomethylation is more widespread across different genes under both conditions (Figure 2D, P < 0.001).
Next, we performed an intersection analysis of DMPs in ADE and CRC. To this end, we applied the SuperExactTest[20] to compare the co-occurrence patterns of DMPs between these samples (Figure 2E and Supplementary Table 5). These intersections were all significantly over-enriched (all P < 0.001), with common CRC- and ADE hyper-DMPs and common CRC-hypo and ADE-hypo DMPs displaying the highest degree of overlap. Specifically, 82% (24639/30009) of the hypermethylated DMPs in ADE were shared with CRC.
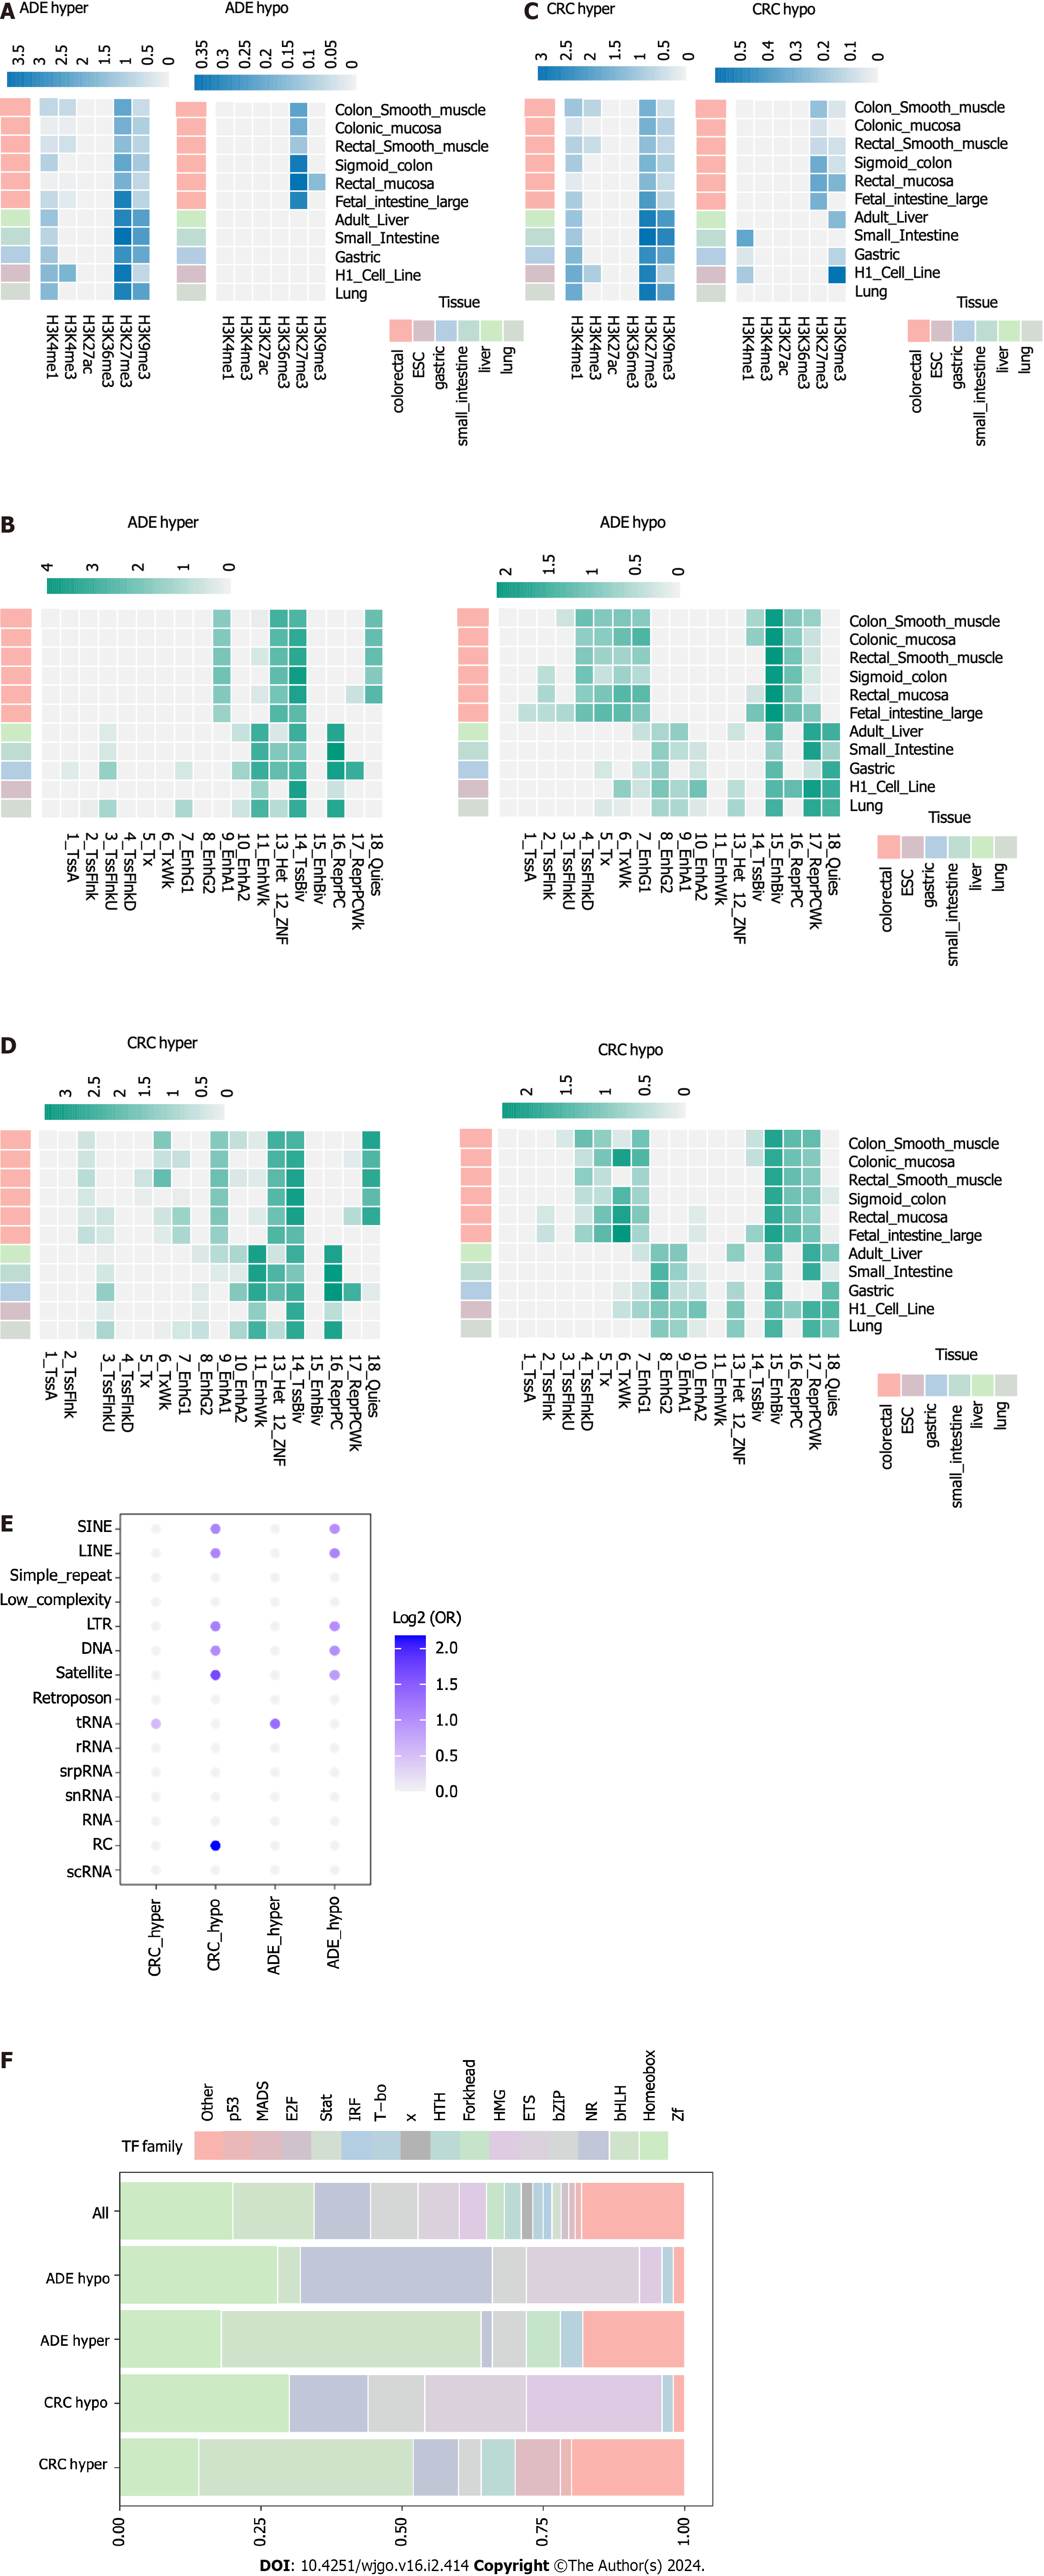
To assess the enrichment of regulatory regions, we first performed over-enrichment analyses using the LOLA package based on CRC and ADE-related DMPs with different histone modifications. Regarding ADE-associated methylation changes, we observed that hypermethylation sites were enriched in H3K27me3 modifications and active enhancer/promoter-associated H3K4me1 (Figure 3A). Furthermore, we assessed the over-enrichment of ADE DMPs in different chromatin states (Figure 3B). The ADE-associated hypermethylated DMPs preferentially occurred at bivalent transcription start sites (states 14) and zinc-finger (ZNF) and enhancer sites (states 10 and 11). In addition, ADE-associated hypermethylated sites were enriched in heterochromatic regions and ZNF genes/repeats (states 12 and 13). Regarding ADE-associated hypomethylation, the most enriched chromatin states (15-18) involved repressive functions, such as polycomb-associated sites. CRC exhibited similar methylated regulatory regions as those enriched in ADE (Figures 3C and D). Furthermore, hypomethylated DMPs were significantly enriched at H3K27me3 in normal colorectal tissues.
Next, we performed over-enrichment analyses of CRC- and ADE-related DMPs with repetitive DNA elements (Figure 3E). In ADE and CRC, hypomethylation preferentially occurred at short interspersed retrotransposable elements, long interspersed retrotransposable elements (LINEs), long terminal repeat elements (LTRs), DNA repeat elements, rolling circles, and satellite sites. Additionally, the hypomethylation of DMPs was associated with tRNA.
Finally, we performed HOMER analysis to identify the enrichment of DMPs in the transcription factor (TF) motifs. We observed both similarities and differences between the ADE and CRC groups (Figure 3F). The hypermethylation of DMPs in ADE was associated with homeobox TF motifs (Fisher’s P < 0.001, OR = 7.4) and T-box motifs (Fisher’s P = 0.001, OR = 2.7). The hypomethylation of DMPs in ADE was enriched in bHLH TF motifs (Fisher’s P < 0.001, OR = 6.9). In CRC, hypermethylation particularly affected MADS and homeobox TF motifs (Fisher’s P < 0.001, ORs = 33.2 and 4.8, respectively), whereas hypomethylation was involved in ETS and bZIP TF sites (Fisher’s P < 0.01, ORs = 13.2 and 3.5). These findings highlight the clear functional discrepancy between ADE and CRC in terms of TF-motif enrichment.
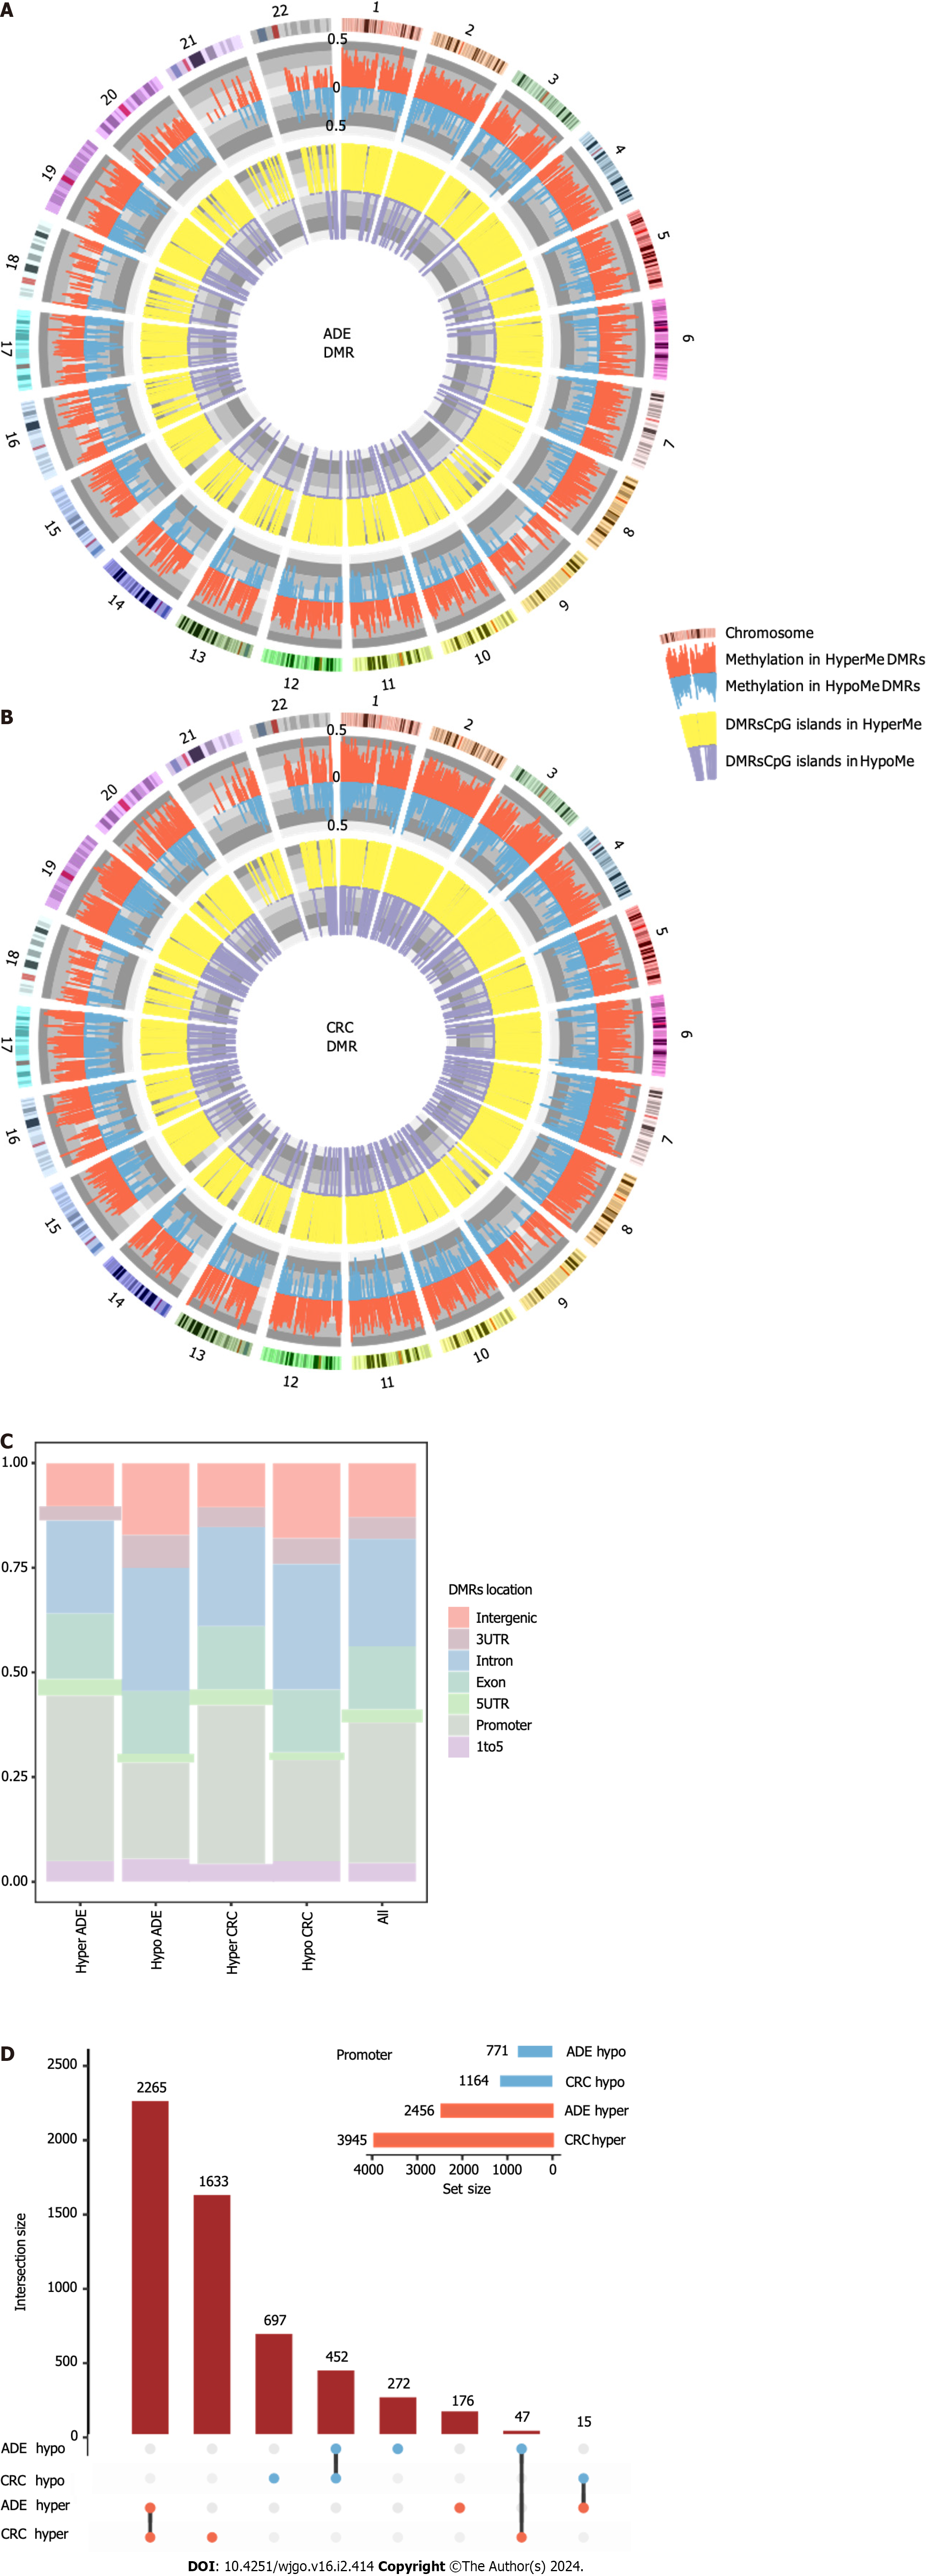
To identify DMRs in ADE and CRC, the WGBS dataset was analyzed using methylkit with a tile window size of 200 bp. We detected 6219 hypermethylated DMRs (hyperMe-DMRs) and 3365 hypoMe-DMRs in ADE (Supplementary Table 6) and 10424 hyperMe-DMRs and 4817 hypoMe-DMRs in CRC (Supplementary Table 7). We then used CIRCOS to visualize the data as a multilayer circular plot, shown in Figures 4A and B. The outer layer contained information including the chromosome, DMR position, and change in the methylation value (-1 to 1). The inner layer lists changes in CpG island methylation.
In this study, hypermethylation was the predominant event at the DMR level in both ADE and CRC. The majority (75.5%) of the hyperMe-DMRs were located in the promoter regions of the genes, whereas hypoMe-DMRs were more likely to be located in the intergenic and intron regions (Figure 4C). To identify convergent DMRs located in gene promoter regions, we applied UpSet plots to determine the overlap in hypoMe-DMRs and hyperMe-DMRs between ADE and CRC. We found 2265 hypoMe-DMRs and 452 hyperMe-DMRs that were shared between the two conditions (Figure 4D).
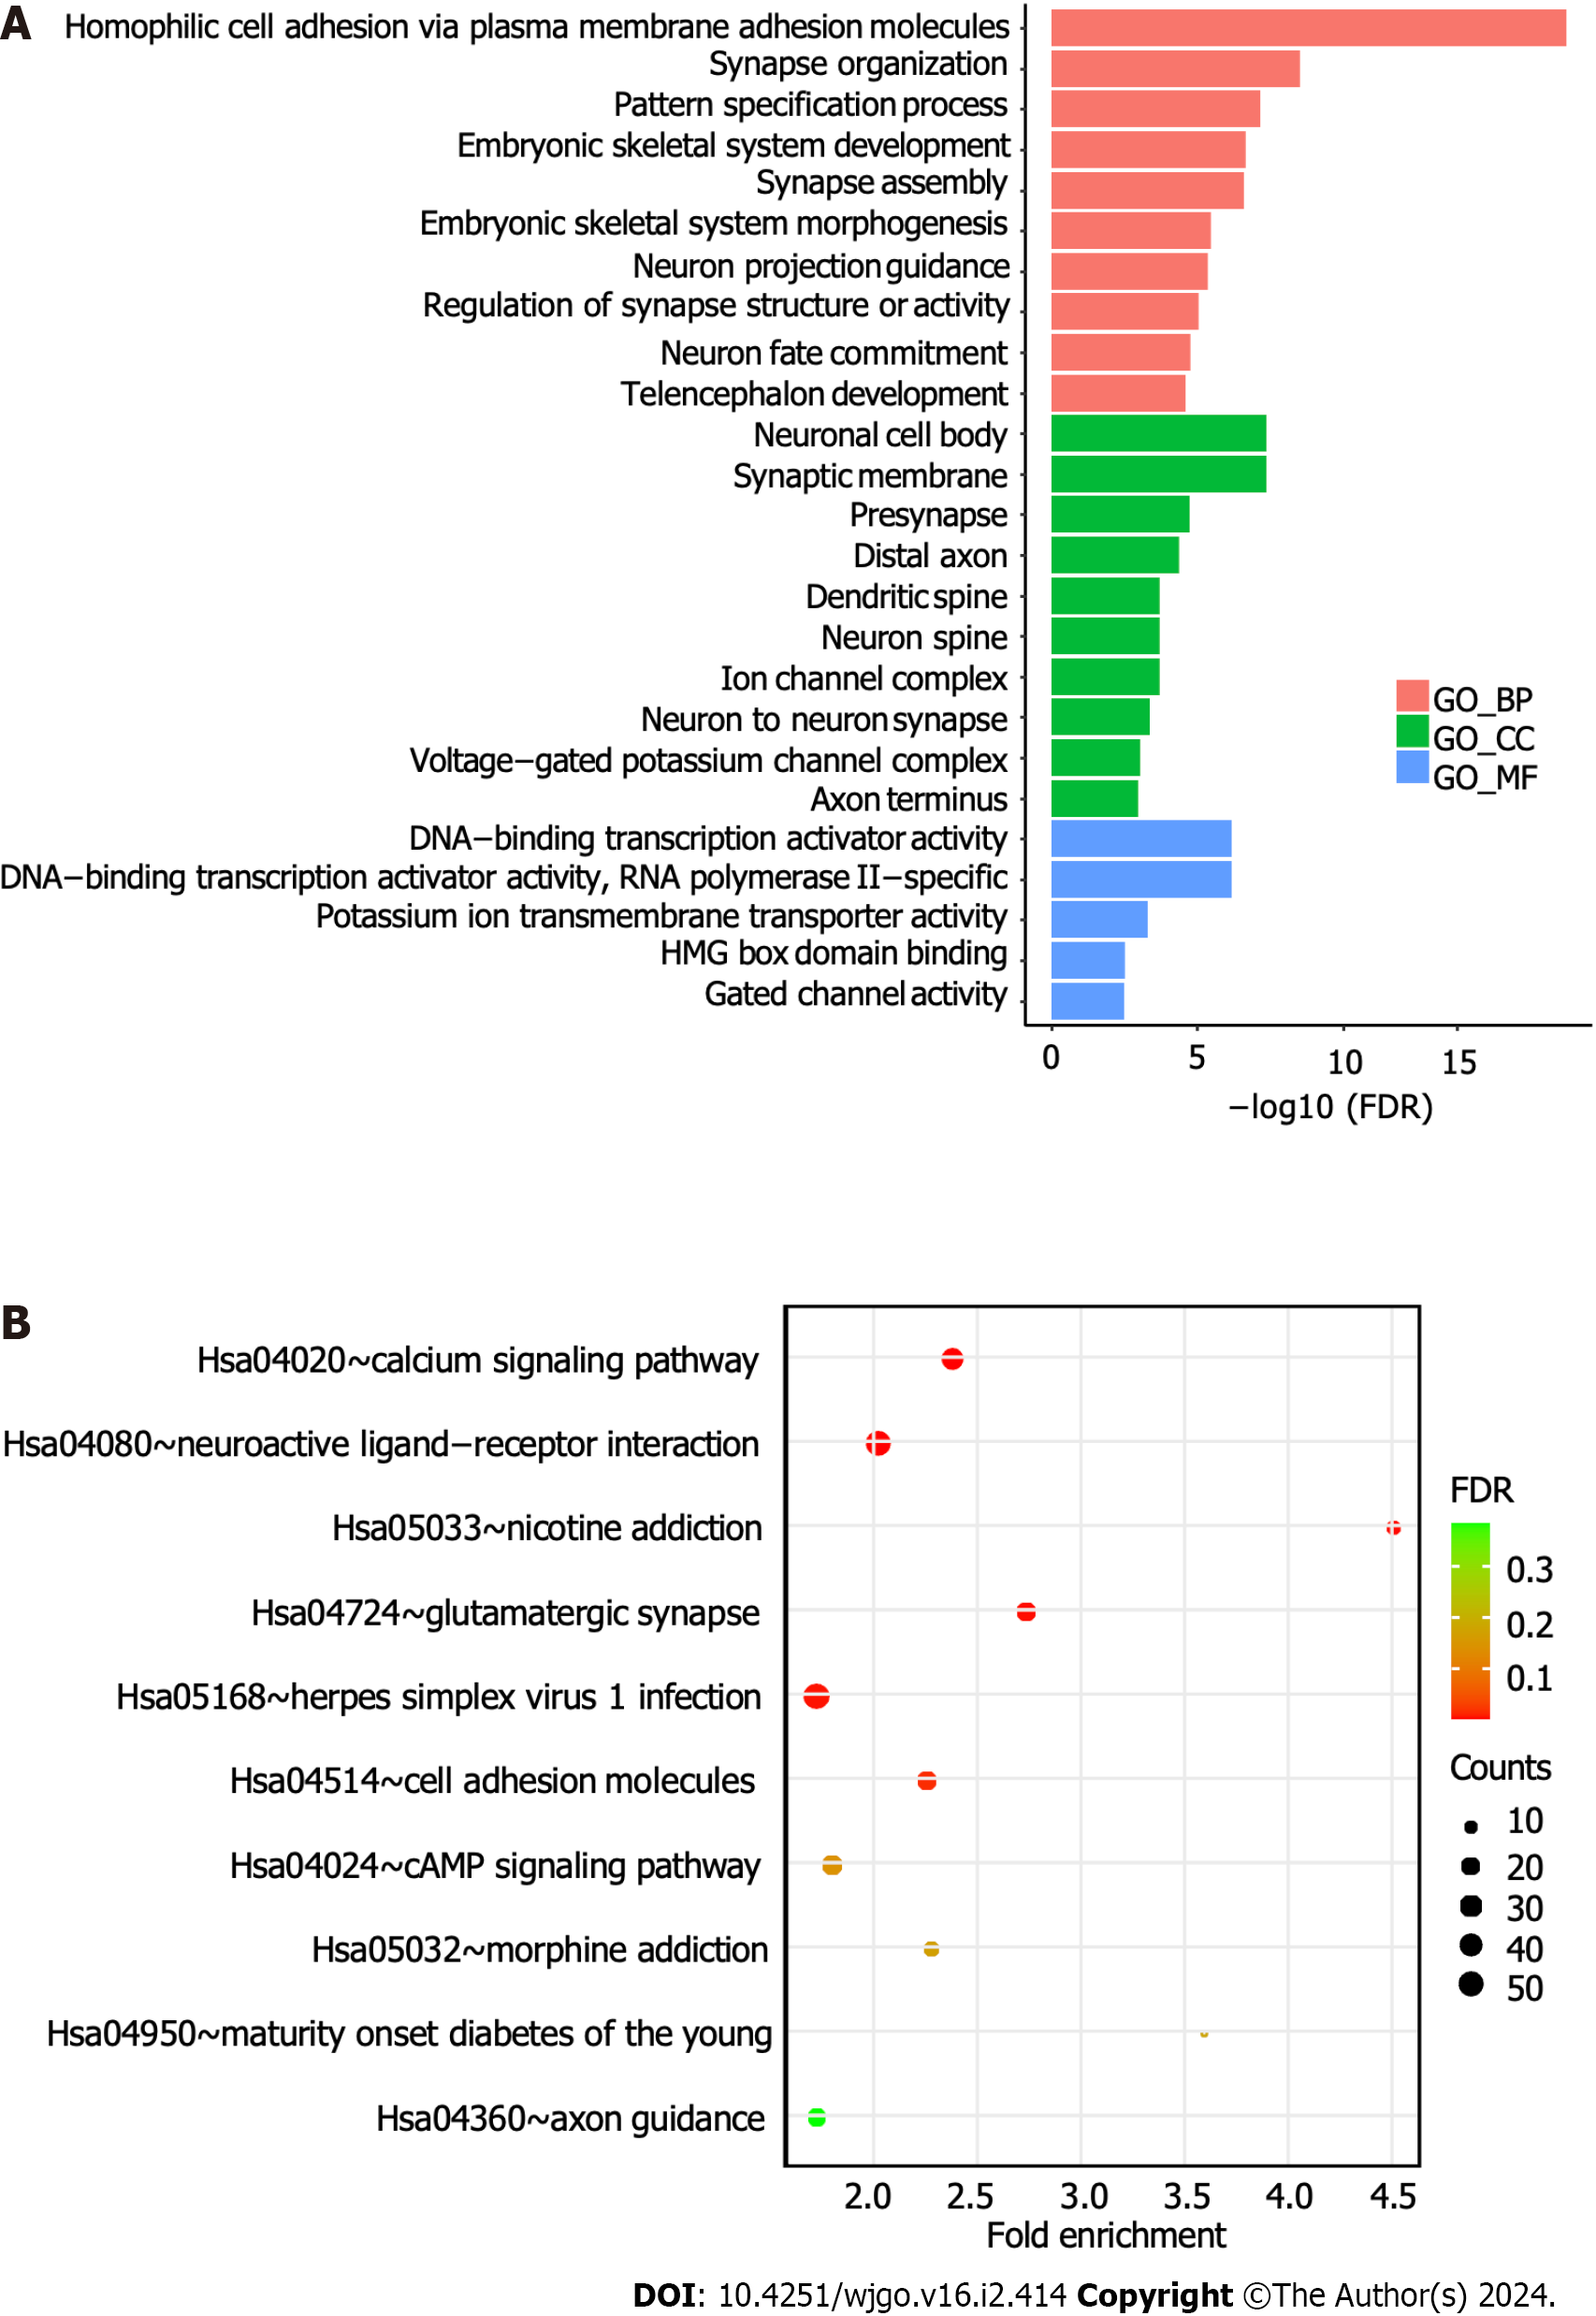
To reveal the biological functions of DMRs, we performed Kyoto Encyclopedia of Genes and Genomes (KEGG) and Gene Ontology (GO) analyses of the related genes. GO enrichment analysis revealed that these genes were mainly enriched in homophilic cell adhesion via plasma membrane adhesion molecules and the neuronal cell body and DNA-binding transcription activator activity (Figure 5A). The KEGG enrichment analysis results showed that these genes were mainly enriched in the calcium signaling pathway, neuroactive ligand-receptor interactions, and other pathways (Figure 5B).
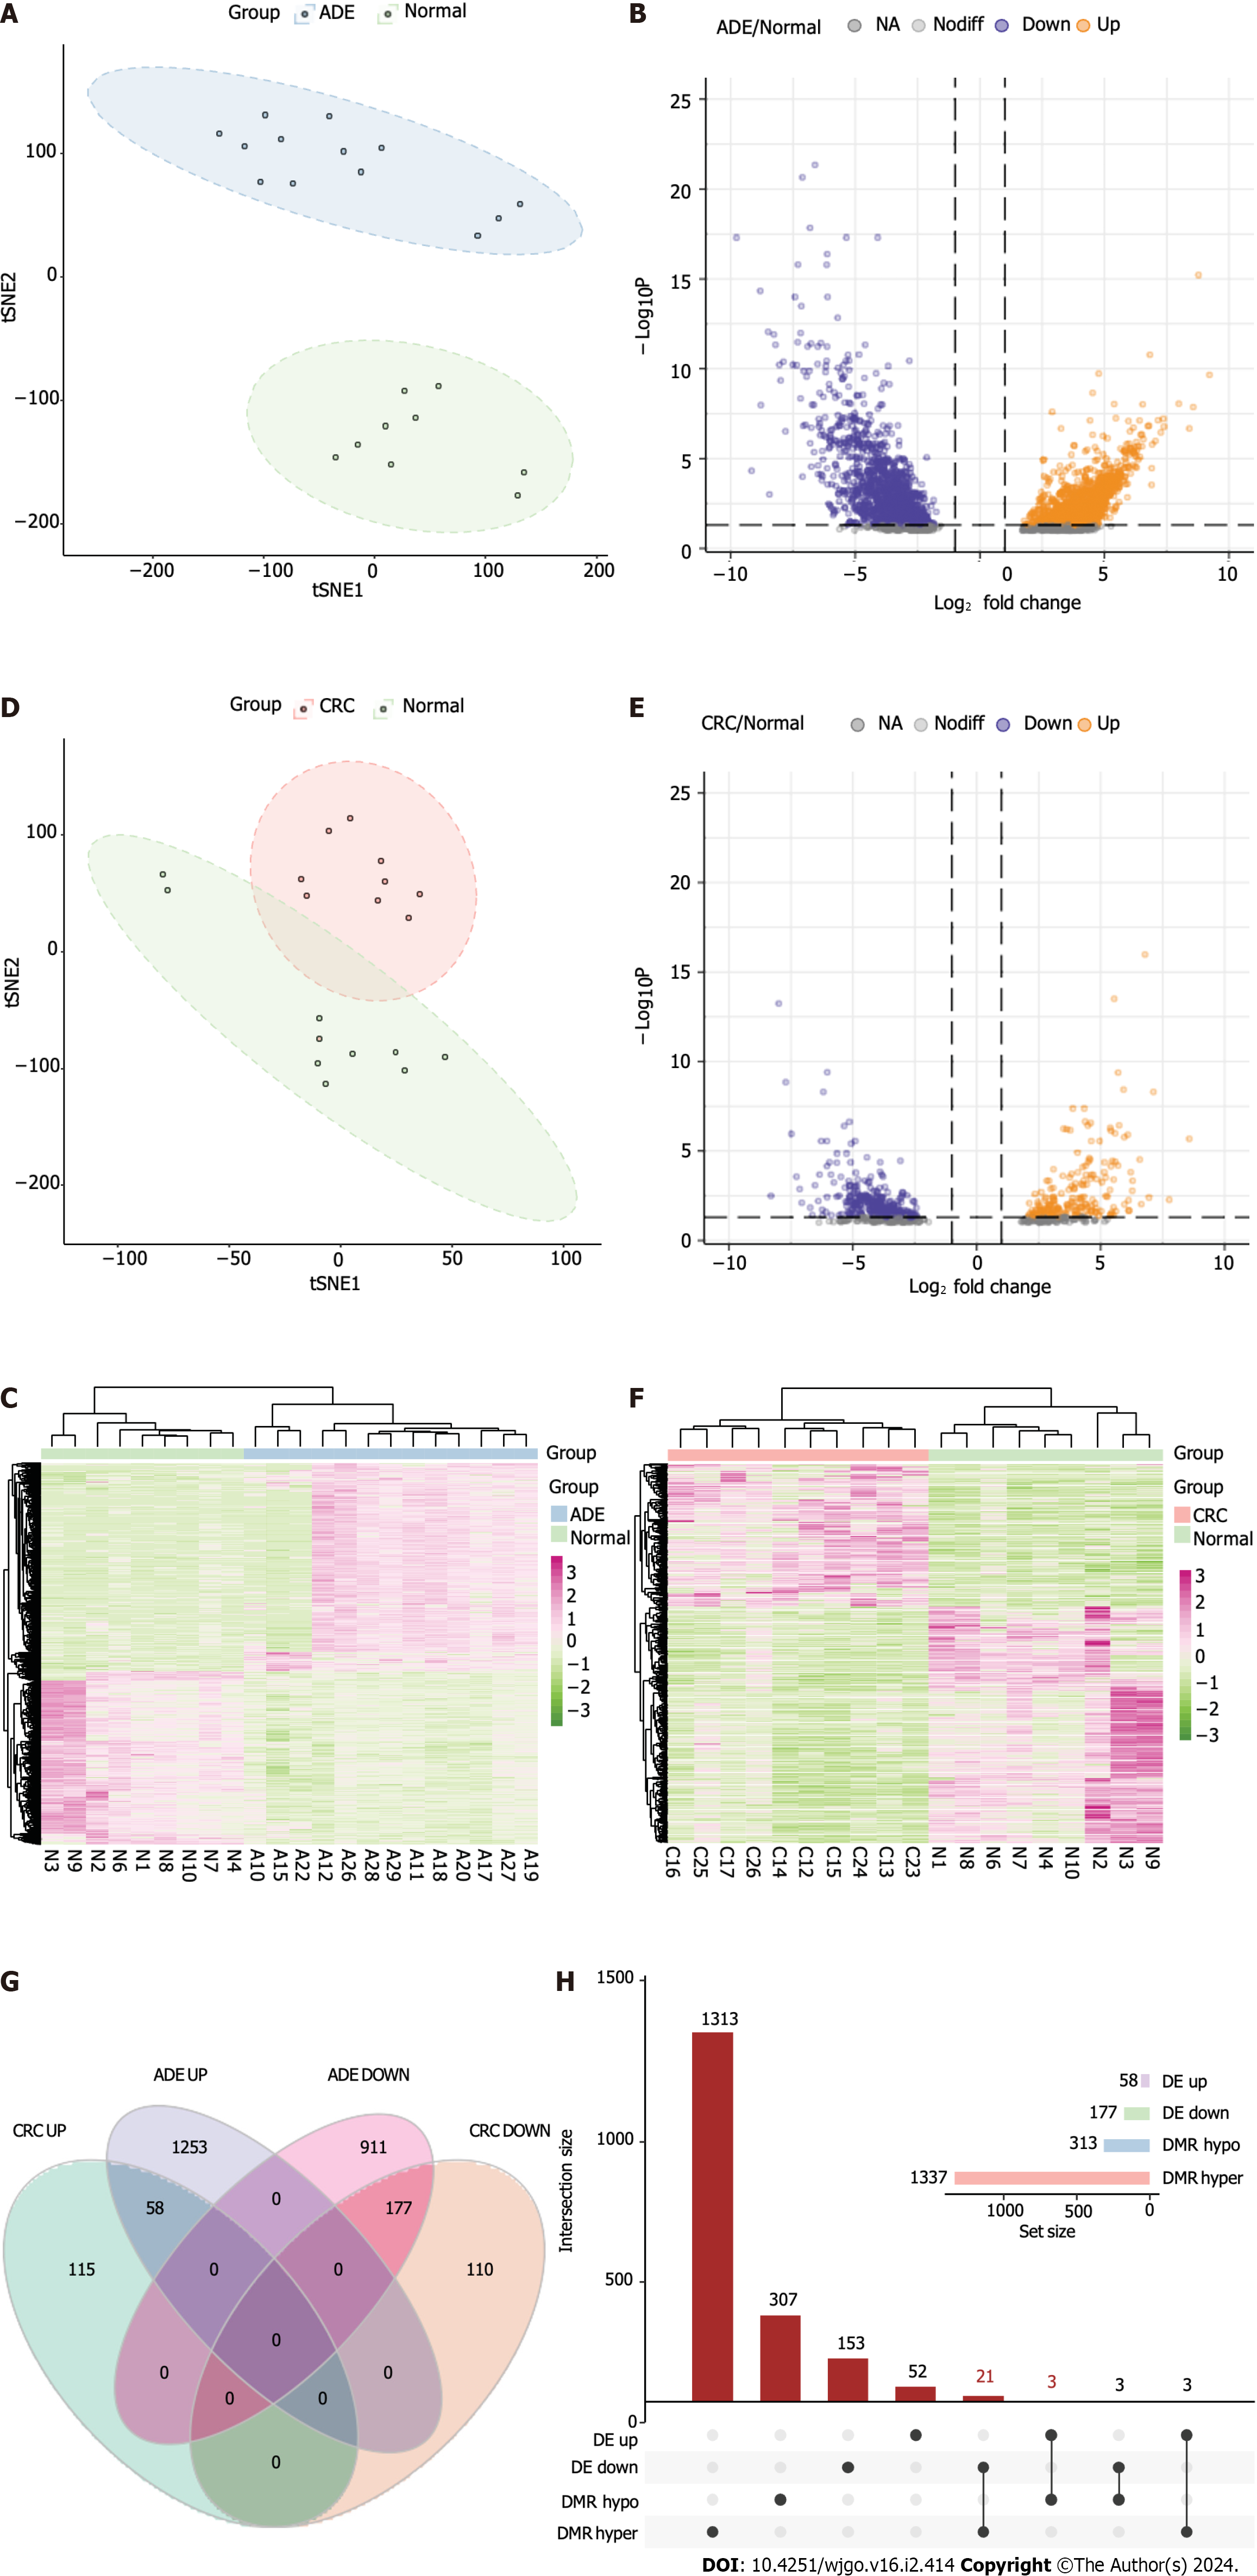
We next performed RNA-seq analysis of 13 ADE, 10 CRC, and nine normal samples to detect transcriptional differences. First, we analyzed the transcriptional differences between ADE and normal samples. By applying t-Distributed Stochastic Neighbor Embedding (t-SNE) analysis to the expression matrix of the top 2000 most variable genes, we classified the samples into two groups (Figure 6A). We used the “DESeq2” R package for differential expression analysis, with cut-off criteria of an adjusted P < 0.05 and |log2FC| > 1. We identified 2399 DEGs between the ADE and normal samples, of which the expression levels of 1311 were upregulated and those of 1088 were downregulated (Figures 6B and C).
We then analyzed the transcriptional differences between CRC and normal samples. t-SNE analysis of the expression matrix of the top 2000 most variable genes revealed mixed samples between the CRC and normal groups (Figure 6D). We identified 460 DEGs between CRC and normal samples, including 173 for which expression was upregulated and 287 for which expression was downregulated (Figures 6E and F).
By integrating the DEG analysis of ADE and CRC samples, we identified 235 genes (Figure 6G), including 177 for which expression was downregulated and 58 for which expression was upregulated in both CRC and ADE samples. To identify meDEGs, we applied UpSet plots to identify the overlap between hypoMe-DMRs and genes for which expression was upregulated, as well as hyperMe-DMRs and genes for which expression was downregulated. We finally identified 24 meDEGs, including 21 hypermethylated and three hypomethylated genes (Figure 6H).
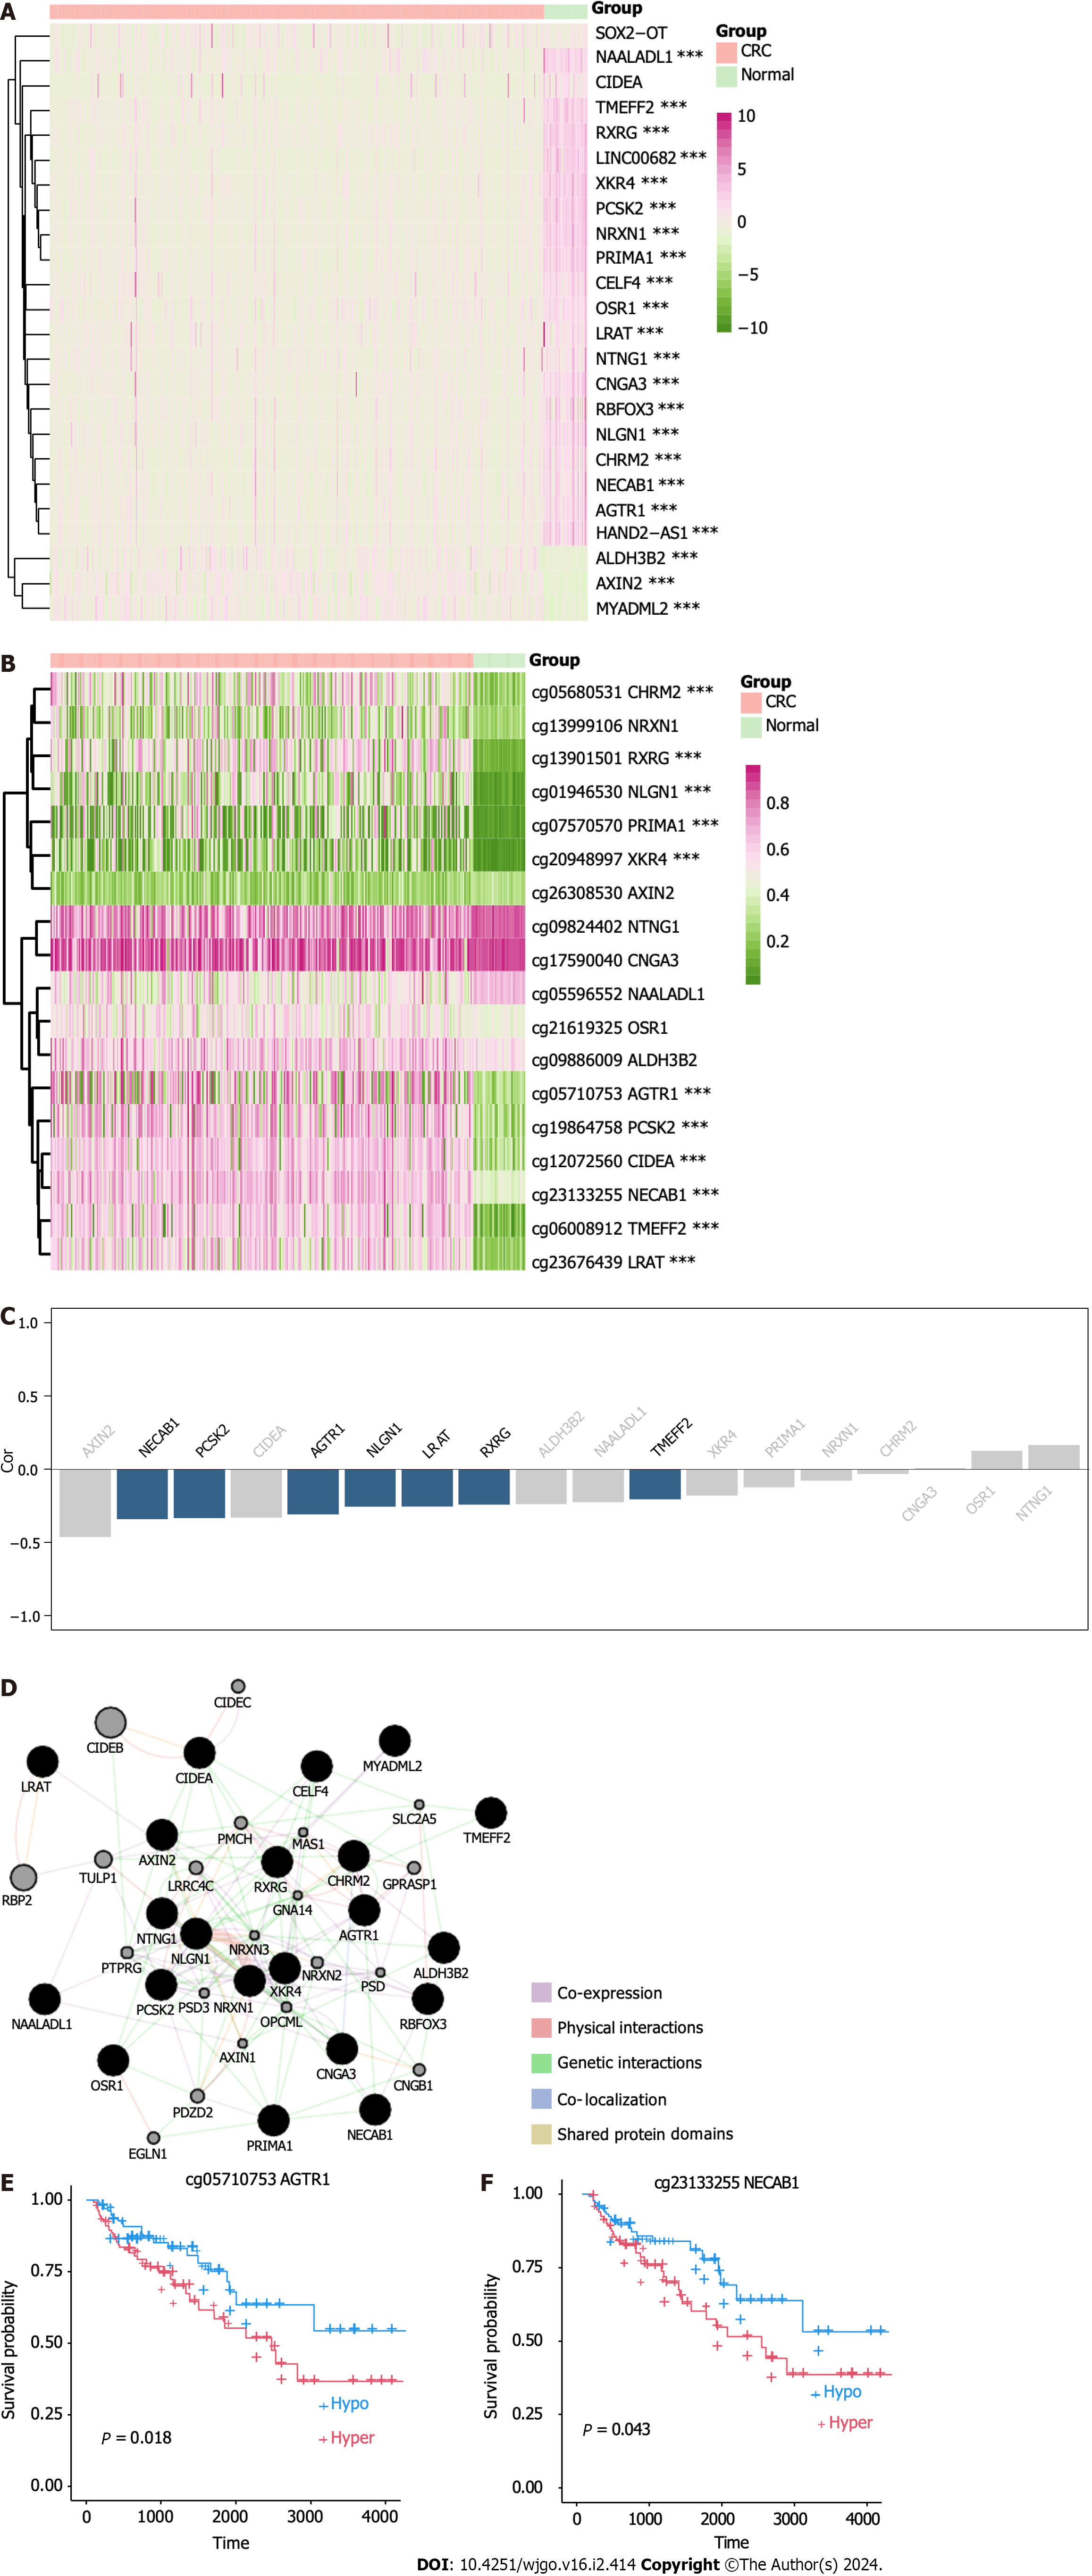
To validate the meDEGs, we analyzed their methylation and expression levels using the COAD dataset of TCGA. Of the 24 meDEGs, all 24 genes were found to be expressed in the COAD RNA-seq dataset, with expression levels of three genes being upregulated and those of 21 being downregulated in CRC (Figure 7A). All gene expression patterns were consistent with those in our dataset.
We further examined the methylation status of meDEGs in the COAD 450K dataset and found methylation data for 18 of the 24 genes. Among these, 11 genes were hypermethylated in CRC tissues (Figure 7B). All methylation patterns were consistent with those observed in our dataset. Methylation levels of the seven meDEGs showed a significant and highly negative correlation with their expression (FDR < 0.05, Spearman’s rho < -0.2; Figure 7C). Next, to explore the functional relationships among the meDEGs, we used Gene-MANIA to construct a protein-protein interaction)/network for the meDEGs, and the results are shown in Figure 7D.
To further explore the clinical significance of the meDEGs, we performed a survival analysis based on the seven meDEGs in the COAD dataset. Our results showed that the AGTR1-low-methylation group had a higher survival rate than the high-methylation group (Figure 7E). Similarly, the NECAB1-low-methylation group had a higher survival rate than the high-methylation group (Figure 7F).
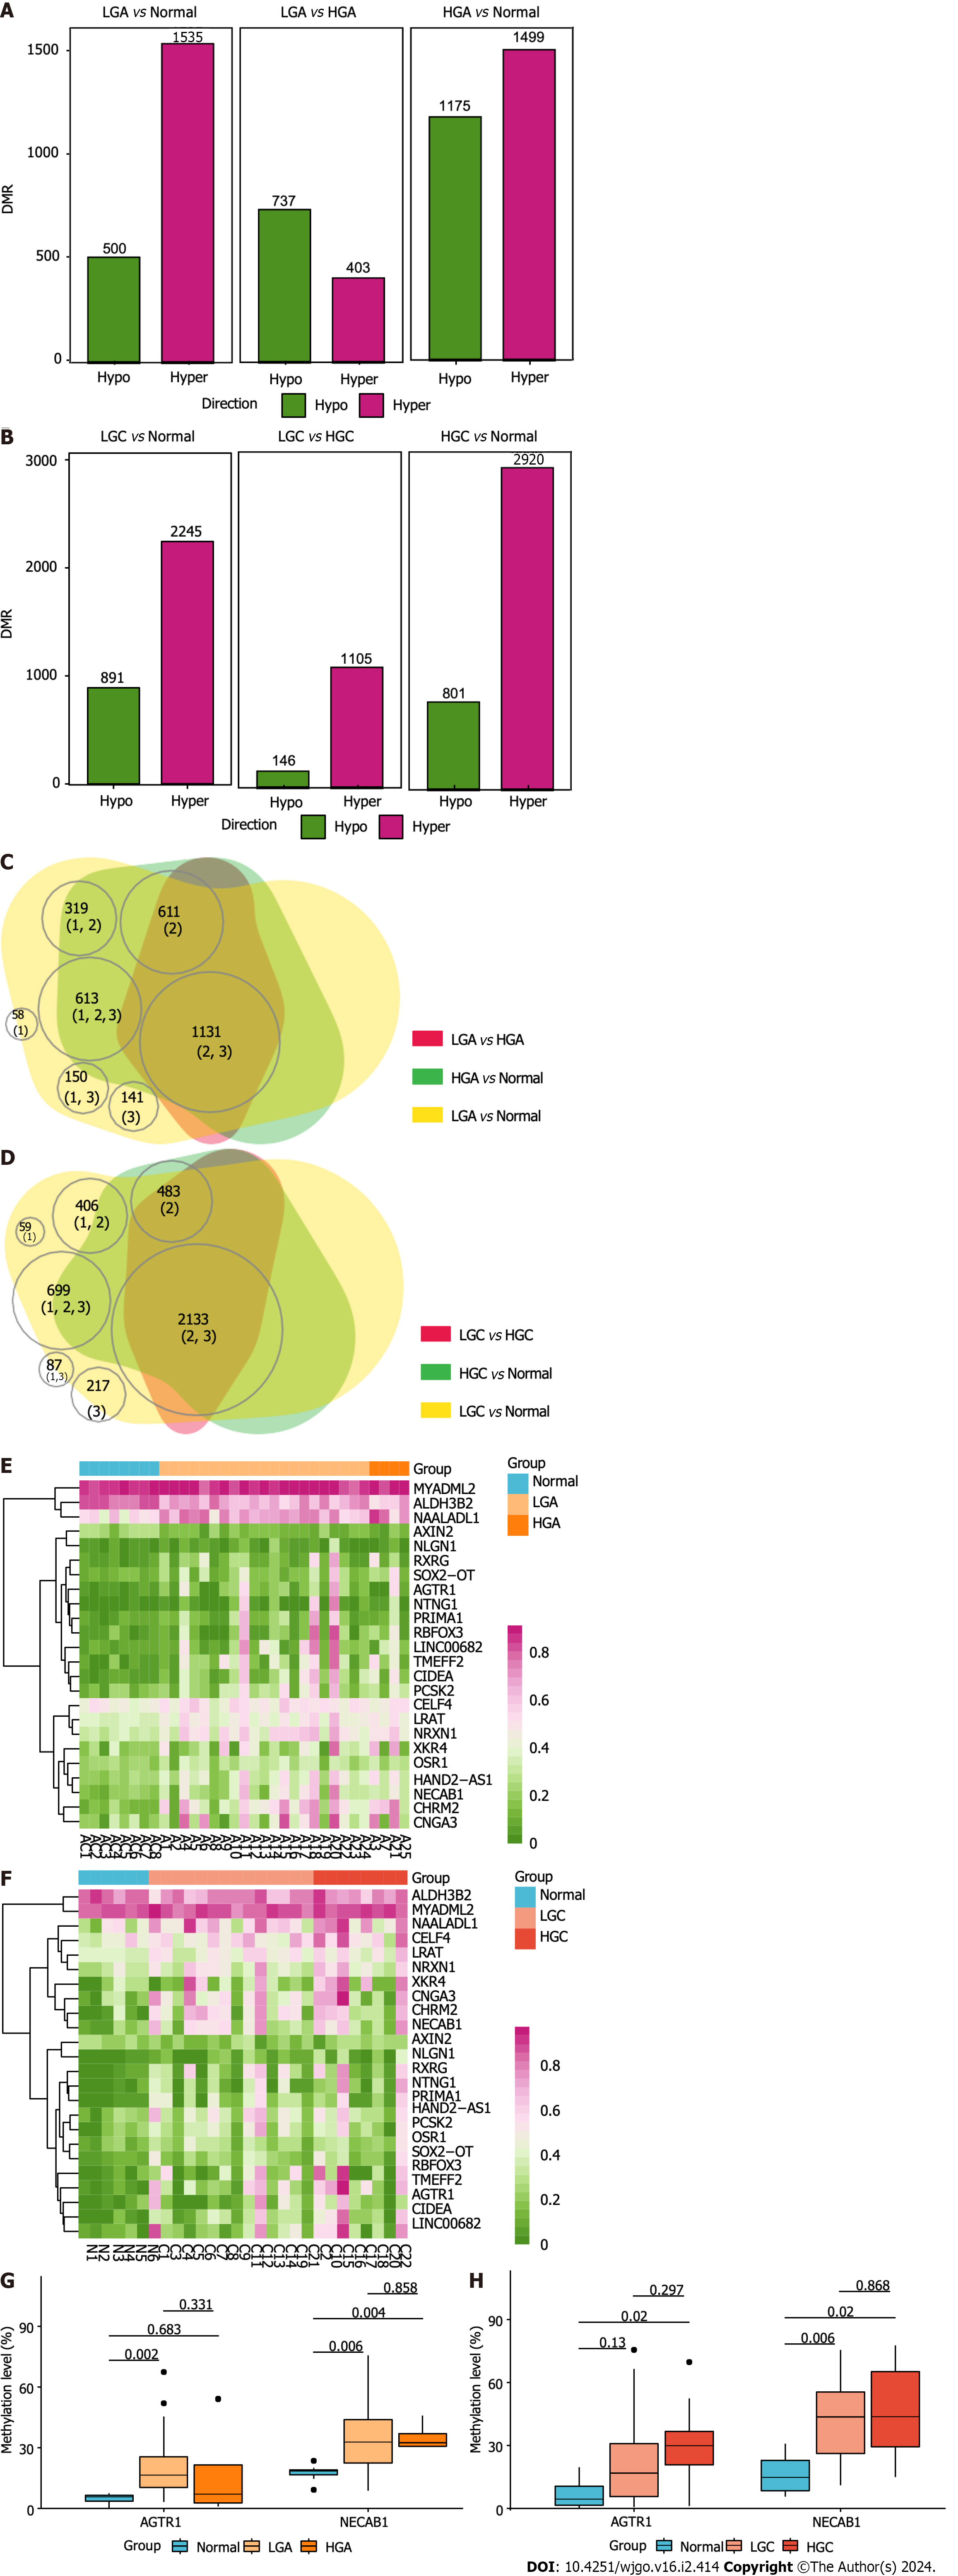
We divided ADE into high-grade adenoma (HGA) and low-grade adenoma (LGA) groups base on the criterion provided by Lieberman et al[21]. We divided CRC into high-grade cancer (HGC) at stage ≥ IIB and low-grade cancer (LGC) at stage < IIB. More than 60% of DMRs that were observed in both LGA (75.4%, 1535/2035) and HGA (56.1%, 1499/2674) were hyper-methylated compared to the status in normal tissues (Figure 8A, Supplementary Tables 8 and 9). However, with LGA as the reference, most DMRs observed in HGA were hypo-methylated (64.6%, 737/1140; Figure 8A, Su
The meDEG methylation patterns between ADE of different grades (Figure 8E) and CRC (Figure 8F) of different grades were similar. NECAB1 was methylated in LGA and HGA compared to the status in normal tissues (Figure 8G). AGTR1 was hyper-methylated in LGA, but not in HGA, compared to the status in normal tissues (Figure 8G). In CRC, NECAB1 was methylated in LGC and HGC compared to the status in normal tissues (Figure 8H). AGTR1 was hyper-methylated in HGC, but not in LGC, compared to the status in normal tissues (Figure 8H).
To assess the reproducibility of our study, we evaluated the Ten-Gene Methylation Signature developed by Patai et al[22]. In ADE, 8/10 methylation signatures were hyper-methylated in LGA and HGA compared to the status in normal tissues (Supplementary Table 14). In CRC, 8/10 methylation signatures were hyper-methylated in LGC and HGC compared to the status in normal tissues (Supplementary Table 15). Our results were thus highly consistent with the findings previously reported[22].
Finally, we utilized the dataset GSE32323 to investigate the effects of restoring the methylation status on AGTR1 and NECAB1 expression, based on 5-aza-2’-deoxycytidine treatment. In the HT29 cell line, demethylation treatment partially restored the mRNA expression levels of AGTR1 and NECAB1, indicating that DNA hypermethylation seems to play a role in the regulation of these genes (Supplementary Figure 1). A similar tendency was also observed in the HCT116 cell line (Supplementary Figure 1).
We profiled the global methylation status of 22 CRC and 25 ADE samples and found that the methylation level in CRC was higher than that in ADE. Moreover, these sample types showed similar methylation patterns with respect to the DMP gene locations, chromatin signatures, and repeated elements. Combined with RNA-seq gene expression data, we identified 14 meDEGs, of which only AGTR1 and NECAB1 methylation patterns had prognostic significance.
In our study, we found that hypermethylation at CpG sites is more prevalent in CRC and ADE than in normal tissues, which is consistent with the results of previous studies[23,24]. McInnes et al[23] found that 73% of differentially methylated CpGs were hypermethylated in CRC at the CpG-dinucleotide level. Further, Kibriya et al[24] found that 600 of 875 autosomal loci were hypermethylated.
However, some other studies have reported contradictory results[4,6,10]. Gu et al[4] found that 87% of methylated CpG sites are hypomethylated at the CpG-dinucleotide level. These discrepancies could be attributed to differences in detection methods and sample sizes. The overall methylation level in ADE is lower than that in CRC, indicating that aberrant methylation occurs at the earliest stages of tumor initiation[6]. Luo et al[10] reported that nearly 40% DMPs were hypermethylated, and 60% of DMPs were hypomethylated in ADEs, compared to the status in the normal colon mucosa. Moreover, genome-wide hypermethylation appears to continuously increase during ADE-cancer sequencing[25].
The methylation patterns observed in the ADE and CRC samples were similar. Hypermethylated DMPs were mainly located at CpG islands, whereas hypomethylated DMPs were largely located in the open sea region. These findings were consistent with those reported by Naumov et al[7]. Both CRC and ADE showed hypermethylation enrichment in the bivalent enhancer state regions (dominant H3K27me3) and heterochromatin state regions (dominant H3K9me3). H3K27me3 is often associated with transcriptionally repressed chromatin[26], which often occurs during tumorigenesis[27]. Some methylation aberrations were enriched exclusively in the normal colorectum. Bormann et al[28] reported that ADEs retain cellular methylation signatures, which is consistent with our results. We also observed the hypomethylation of short interspersed retrotransposable, LIN, LTR, and satellite regions in both ADE and CRC. LINE-1 expression is a hallmark of several types of malignancy[29], and hypomethylation within repetitive elements has been implicated in CRC initiation[30]. Pathway enrichment analysis of the DMR in promoters showed that these genes were enriched in the neuroactive ligand-receptor interaction pathway, which is consistent with previous results[11]. Our study suggests that the methylation of molecules involved in the gut-brain axis could play a crucial role in the initiation and progression of CRC, even in the early stages of ADE.
Seven meDEGs were identified as follows: NECAB1, PCSK2, AGTR1, NLGN1, LRAT, RXRG, and TMEFF2. Among these genes, the methylation of PCSK2[31], AGTR1[32], LRAT[33], RXRG[34], and TMEFF2[35] has been previously reported in CRC. NECAB1 encodes a neuronal calcium-binding protein[36], and its methylation has been observed in acute myeloid leukemia[37]. NLGN1 is involved in the regulation of glutamatergic transmission[38], and studies have shown that upregulated NLGN1 expression predicts poor survival in CRC[39]. Moreover, Pergolizzi et al[40] found that NLGN1 promotes CRC progression. In addition, NLGN1 might act as a tumor suppressor gene during early CRC initiation but could promote CRC progression at later stages. Furthermore, we found that AGTR1 and NECAB1 methylation levels were associated with survival. Previous studies have shown that AGTR1 expression serves as a prognostic biomarker in various cancers[41-43], whereas the prognostic value of AGTR1 methylation has not been reported. There are still some limitations of our study: (1) The sample size of the present study was relatively limited hampering the statistical power of the study; and (2) Not all samples were subjected to both RNA-Seq and WGBS analysis due to the availability of RNA or DNA.
In summary, in this study, the global methylome patterns were characterized and genome-wide similarities in methylation patterns between ADE and CRC tissues were identified. Our results support the potential use of AGTR1 and NECAB1 methylation statuses as prognostic biomarkers for CRC.
Aberrant methylation is a common occurrence in colorectal cancer (CRC) initiation and progression, with clinical implications for early detection during CRC formation.
Addressing the critical need to identify specific DNA methylation markers for both adenoma (ADE) and CRC, the aim of this study was to unravel key molecular signatures associated with ADE and CRC.
Utilizing SeqCap targeted bisulfite sequencing and RNA-seq analysis, the goal of this study was to comprehensively profile the epigenomic-transcriptomic landscapes of colorectal ADE and CRC samples.
The research involved a detailed examination, through SeqCap targeted bisulfite sequencing and RNA-seq analysis, shedding light on the distinctive epigenomic and transcriptomic characteristics of colorectal ADE and CRC. Public The Cancer Genome Atlas datasets were mined to explored the clinical implications of those methylation makers.
The comparative analysis of 22 CRC and 25 ADE samples revealed higher global methylation in CRC, with both exhibiting similar methylation patterns in differentially methylated positions, gene locations, chromatin signatures, and repeated elements. Integration with RNA-seq data identified 14 methylation-regulated differentially expressed genes, highlighting the prognostic significance of AGTR1 and NECAB1 methylation.
This study revealed genome-wide alterations in DNA methylation during early CRC stages. It further identified distinctive methylation signatures associated with colorectal ADEs and CRC. Notably, AGTR1 and NECAB1 methylation emerged as potential prognostic biomarkers for CRC.
The findings provide a foundation for future investigations into the clinical utility of identified methylation markers and the development of new targets for CRC treatment.
Provenance and peer review: Unsolicited article; Externally peer reviewed.
Peer-review model: Single blind
Specialty type: Oncology
Country/Territory of origin: China
Peer-review report’s scientific quality classification
Grade A (Excellent): 0
Grade B (Very good): 0
Grade C (Good): C, C
Grade D (Fair): D
Grade E (Poor): 0
P-Reviewer: Batyrbekov K, Kazakhstan; Sipos F, Hungary; Tchilikidi KY, Russia S-Editor: Wang JJ L-Editor: A P-Editor: Zhang XD
| 1. | Sung H, Ferlay J, Siegel RL, Laversanne M, Soerjomataram I, Jemal A, Bray F. Global Cancer Statistics 2020: GLOBOCAN Estimates of Incidence and Mortality Worldwide for 36 Cancers in 185 Countries. CA Cancer J Clin. 2021;71:209-249. [RCA] [PubMed] [DOI] [Full Text] [Cited by in Crossref: 75126] [Cited by in RCA: 64673] [Article Influence: 16168.3] [Reference Citation Analysis (176)] |
| 2. | Chen W, Zheng R, Baade PD, Zhang S, Zeng H, Bray F, Jemal A, Yu XQ, He J. Cancer statistics in China, 2015. CA Cancer J Clin. 2016;66:115-132. [RCA] [PubMed] [DOI] [Full Text] [Cited by in Crossref: 11444] [Cited by in RCA: 13214] [Article Influence: 1468.2] [Reference Citation Analysis (3)] |
| 3. | Nguyen LH, Goel A, Chung DC. Pathways of Colorectal Carcinogenesis. Gastroenterology. 2020;158:291-302. [RCA] [PubMed] [DOI] [Full Text] [Cited by in Crossref: 344] [Cited by in RCA: 315] [Article Influence: 63.0] [Reference Citation Analysis (0)] |
| 4. | Gu S, Lin S, Ye D, Qian S, Jiang D, Zhang X, Li Q, Yang J, Ying X, Li Z, Tang M, Wang J, Jin M, Chen K. Genome-wide methylation profiling identified novel differentially hypermethylated biomarker MPPED2 in colorectal cancer. Clin Epigenetics. 2019;11:41. [RCA] [PubMed] [DOI] [Full Text] [Full Text (PDF)] [Cited by in Crossref: 26] [Cited by in RCA: 23] [Article Influence: 3.8] [Reference Citation Analysis (0)] |
| 5. | Beggs AD, Jones A, El-Bahrawy M, Abulafi M, Hodgson SV, Tomlinson IP. Whole-genome methylation analysis of benign and malignant colorectal tumours. J Pathol. 2013;229:697-704. [RCA] [PubMed] [DOI] [Full Text] [Full Text (PDF)] [Cited by in Crossref: 69] [Cited by in RCA: 65] [Article Influence: 5.4] [Reference Citation Analysis (0)] |
| 6. | Hanley MP, Hahn MA, Li AX, Wu X, Lin J, Wang J, Choi AH, Ouyang Z, Fong Y, Pfeifer GP, Devers TJ, Rosenberg DW. Genome-wide DNA methylation profiling reveals cancer-associated changes within early colonic neoplasia. Oncogene. 2017;36:5035-5044. [RCA] [PubMed] [DOI] [Full Text] [Full Text (PDF)] [Cited by in Crossref: 53] [Cited by in RCA: 76] [Article Influence: 9.5] [Reference Citation Analysis (0)] |
| 7. | Naumov VA, Generozov EV, Zaharjevskaya NB, Matushkina DS, Larin AK, Chernyshov SV, Alekseev MV, Shelygin YA, Govorun VM. Genome-scale analysis of DNA methylation in colorectal cancer using Infinium HumanMethylation450 BeadChips. Epigenetics. 2013;8:921-934. [RCA] [PubMed] [DOI] [Full Text] [Cited by in Crossref: 93] [Cited by in RCA: 115] [Article Influence: 9.6] [Reference Citation Analysis (0)] |
| 8. | Spisák S, Kalmár A, Galamb O, Wichmann B, Sipos F, Péterfia B, Csabai I, Kovalszky I, Semsey S, Tulassay Z, Molnár B. Genome-wide screening of genes regulated by DNA methylation in colon cancer development. PLoS One. 2012;7:e46215. [RCA] [PubMed] [DOI] [Full Text] [Full Text (PDF)] [Cited by in Crossref: 37] [Cited by in RCA: 40] [Article Influence: 3.1] [Reference Citation Analysis (0)] |
| 9. | Wang X, Wang D, Zhang H, Feng M, Wu X. Genome-wide analysis of DNA methylation identifies two CpG sites for the early screening of colorectal cancer. Epigenomics. 2020;12:37-52. [RCA] [PubMed] [DOI] [Full Text] [Cited by in Crossref: 8] [Cited by in RCA: 11] [Article Influence: 2.2] [Reference Citation Analysis (0)] |
| 10. | Luo Y, Wong CJ, Kaz AM, Dzieciatkowski S, Carter KT, Morris SM, Wang J, Willis JE, Makar KW, Ulrich CM, Lutterbaugh JD, Shrubsole MJ, Zheng W, Markowitz SD, Grady WM. Differences in DNA methylation signatures reveal multiple pathways of progression from adenoma to colorectal cancer. Gastroenterology. 2014;147:418-29.e8. [RCA] [PubMed] [DOI] [Full Text] [Cited by in Crossref: 161] [Cited by in RCA: 157] [Article Influence: 14.3] [Reference Citation Analysis (0)] |
| 11. | Fan J, Li J, Guo S, Tao C, Zhang H, Wang W, Zhang Y, Zhang D, Ding S, Zeng C. Genome-wide DNA methylation profiles of low- and high-grade adenoma reveals potential biomarkers for early detection of colorectal carcinoma. Clin Epigenetics. 2020;12:56. [RCA] [PubMed] [DOI] [Full Text] [Full Text (PDF)] [Cited by in Crossref: 17] [Cited by in RCA: 36] [Article Influence: 7.2] [Reference Citation Analysis (0)] |
| 12. | Khodasevich D, Smith AR, Huen K, Eskenazi B, Cardenas A, Holland N. Comparison of DNA methylation measurements from EPIC BeadChip and SeqCap targeted bisulphite sequencing in PON1 and nine additional candidate genes. Epigenetics. 2022;17:1944-1955. [RCA] [PubMed] [DOI] [Full Text] [Reference Citation Analysis (0)] |
| 13. | Krueger F, Andrews SR. Bismark: a flexible aligner and methylation caller for Bisulfite-Seq applications. Bioinformatics. 2011;27:1571-1572. [RCA] [PubMed] [DOI] [Full Text] [Full Text (PDF)] [Cited by in Crossref: 2871] [Cited by in RCA: 3570] [Article Influence: 255.0] [Reference Citation Analysis (0)] |
| 14. | Akalin A, Kormaksson M, Li S, Garrett-Bakelman FE, Figueroa ME, Melnick A, Mason CE. methylKit: a comprehensive R package for the analysis of genome-wide DNA methylation profiles. Genome Biol. 2012;13:R87. [RCA] [PubMed] [DOI] [Full Text] [Full Text (PDF)] [Cited by in Crossref: 1066] [Cited by in RCA: 1423] [Article Influence: 109.5] [Reference Citation Analysis (0)] |
| 15. | Ernst J, Kellis M. ChromHMM: automating chromatin-state discovery and characterization. Nat Methods. 2012;9:215-216. [RCA] [PubMed] [DOI] [Full Text] [Cited by in Crossref: 1700] [Cited by in RCA: 1688] [Article Influence: 129.8] [Reference Citation Analysis (0)] |
| 16. | Sheffield NC, Bock C. LOLA: enrichment analysis for genomic region sets and regulatory elements in R and Bioconductor. Bioinformatics. 2016;32:587-589. [RCA] [PubMed] [DOI] [Full Text] [Full Text (PDF)] [Cited by in Crossref: 374] [Cited by in RCA: 305] [Article Influence: 33.9] [Reference Citation Analysis (0)] |
| 17. | Pérez RF, Tejedor JR, Santamarina-Ojeda P, Martínez VL, Urdinguio RG, Villamañán L, Candiota AP, Sarró NMV, Barradas M, Fernandez-Marcos PJ, Serrano M, Fernández AF, Fraga MF. Conservation of Aging and Cancer Epigenetic Signatures across Human and Mouse. Mol Biol Evol. 2021;38:3415-3435. [RCA] [PubMed] [DOI] [Full Text] [Full Text (PDF)] [Cited by in Crossref: 2] [Cited by in RCA: 9] [Article Influence: 2.3] [Reference Citation Analysis (0)] |
| 18. | Roadmap Epigenomics Consortium; Kundaje A, Meuleman W, Ernst J, Bilenky M, Yen A, Heravi-Moussavi A, Kheradpour P, Zhang Z, Wang J, Ziller MJ, Amin V, Whitaker JW, Schultz MD, Ward LD, Sarkar A, Quon G, Sandstrom RS, Eaton ML, Wu YC, Pfenning AR, Wang X, Claussnitzer M, Liu Y, Coarfa C, Harris RA, Shoresh N, Epstein CB, Gjoneska E, Leung D, Xie W, Hawkins RD, Lister R, Hong C, Gascard P, Mungall AJ, Moore R, Chuah E, Tam A, Canfield TK, Hansen RS, Kaul R, Sabo PJ, Bansal MS, Carles A, Dixon JR, Farh KH, Feizi S, Karlic R, Kim AR, Kulkarni A, Li D, Lowdon R, Elliott G, Mercer TR, Neph SJ, Onuchic V, Polak P, Rajagopal N, Ray P, Sallari RC, Siebenthall KT, Sinnott-Armstrong NA, Stevens M, Thurman RE, Wu J, Zhang B, Zhou X, Beaudet AE, Boyer LA, De Jager PL, Farnham PJ, Fisher SJ, Haussler D, Jones SJ, Li W, Marra MA, McManus MT, Sunyaev S, Thomson JA, Tlsty TD, Tsai LH, Wang W, Waterland RA, Zhang MQ, Chadwick LH, Bernstein BE, Costello JF, Ecker JR, Hirst M, Meissner A, Milosavljevic A, Ren B, Stamatoyannopoulos JA, Wang T, Kellis M. Integrative analysis of 111 reference human epigenomes. Nature. 2015;518:317-330. [RCA] [PubMed] [DOI] [Full Text] [Full Text (PDF)] [Cited by in Crossref: 5261] [Cited by in RCA: 4462] [Article Influence: 446.2] [Reference Citation Analysis (0)] |
| 19. | Morris TJ, Butcher LM, Feber A, Teschendorff AE, Chakravarthy AR, Wojdacz TK, Beck S. ChAMP: 450k Chip Analysis Methylation Pipeline. Bioinformatics. 2014;30:428-430. [RCA] [PubMed] [DOI] [Full Text] [Cited by in Crossref: 690] [Cited by in RCA: 699] [Article Influence: 63.5] [Reference Citation Analysis (0)] |
| 20. | Wang M, Zhao Y, Zhang B. Efficient Test and Visualization of Multi-Set Intersections. Sci Rep. 2015;5:16923. [RCA] [PubMed] [DOI] [Full Text] [Full Text (PDF)] [Cited by in Crossref: 224] [Cited by in RCA: 252] [Article Influence: 25.2] [Reference Citation Analysis (0)] |
| 21. | Lieberman DA, Prindiville S, Weiss DG, Willett W; VA Cooperative Study Group 380. Risk factors for advanced colonic neoplasia and hyperplastic polyps in asymptomatic individuals. JAMA. 2003;290:2959-2967. [RCA] [PubMed] [DOI] [Full Text] [Cited by in Crossref: 342] [Cited by in RCA: 350] [Article Influence: 15.9] [Reference Citation Analysis (0)] |
| 22. | Patai ÁV, Valcz G, Hollósi P, Kalmár A, Péterfia B, Patai Á, Wichmann B, Spisák S, Barták BK, Leiszter K, Tóth K, Sipos F, Kovalszky I, Péter Z, Miheller P, Tulassay Z, Molnár B. Comprehensive DNA Methylation Analysis Reveals a Common Ten-Gene Methylation Signature in Colorectal Adenomas and Carcinomas. PLoS One. 2015;10:e0133836. [RCA] [PubMed] [DOI] [Full Text] [Full Text (PDF)] [Cited by in Crossref: 39] [Cited by in RCA: 40] [Article Influence: 4.0] [Reference Citation Analysis (0)] |
| 23. | McInnes T, Zou D, Rao DS, Munro FM, Phillips VL, McCall JL, Black MA, Reeve AE, Guilford PJ. Genome-wide methylation analysis identifies a core set of hypermethylated genes in CIMP-H colorectal cancer. BMC Cancer. 2017;17:228. [RCA] [PubMed] [DOI] [Full Text] [Full Text (PDF)] [Cited by in Crossref: 21] [Cited by in RCA: 38] [Article Influence: 4.8] [Reference Citation Analysis (0)] |
| 24. | Kibriya MG, Raza M, Jasmine F, Roy S, Paul-Brutus R, Rahaman R, Dodsworth C, Rakibuz-Zaman M, Kamal M, Ahsan H. A genome-wide DNA methylation study in colorectal carcinoma. BMC Med Genomics. 2011;4:50. [RCA] [PubMed] [DOI] [Full Text] [Full Text (PDF)] [Cited by in Crossref: 47] [Cited by in RCA: 56] [Article Influence: 4.0] [Reference Citation Analysis (0)] |
| 25. | Sakai E, Nakajima A, Kaneda A. Accumulation of aberrant DNA methylation during colorectal cancer development. World J Gastroenterol. 2014;20:978-987. [RCA] [PubMed] [DOI] [Full Text] [Full Text (PDF)] [Cited by in CrossRef: 44] [Cited by in RCA: 50] [Article Influence: 4.5] [Reference Citation Analysis (0)] |
| 26. | Chen Y, Ren B, Yang J, Wang H, Yang G, Xu R, You L, Zhao Y. The role of histone methylation in the development of digestive cancers: a potential direction for cancer management. Signal Transduct Target Ther. 2020;5:143. [RCA] [PubMed] [DOI] [Full Text] [Full Text (PDF)] [Cited by in Crossref: 27] [Cited by in RCA: 88] [Article Influence: 17.6] [Reference Citation Analysis (0)] |
| 27. | Piunti A, Shilatifard A. The roles of Polycomb repressive complexes in mammalian development and cancer. Nat Rev Mol Cell Biol. 2021;22:326-345. [RCA] [PubMed] [DOI] [Full Text] [Cited by in Crossref: 88] [Cited by in RCA: 246] [Article Influence: 61.5] [Reference Citation Analysis (0)] |
| 28. | Bormann F, Rodríguez-Paredes M, Lasitschka F, Edelmann D, Musch T, Benner A, Bergman Y, Dieter SM, Ball CR, Glimm H, Linhart HG, Lyko F. Cell-of-Origin DNA Methylation Signatures Are Maintained during Colorectal Carcinogenesis. Cell Rep. 2018;23:3407-3418. [RCA] [PubMed] [DOI] [Full Text] [Cited by in Crossref: 51] [Cited by in RCA: 57] [Article Influence: 9.5] [Reference Citation Analysis (0)] |
| 29. | Ardeljan D, Taylor MS, Ting DT, Burns KH. The Human Long Interspersed Element-1 Retrotransposon: An Emerging Biomarker of Neoplasia. Clin Chem. 2017;63:816-822. [RCA] [PubMed] [DOI] [Full Text] [Cited by in Crossref: 70] [Cited by in RCA: 100] [Article Influence: 12.5] [Reference Citation Analysis (0)] |
| 30. | Tse JWT, Jenkins LJ, Chionh F, Mariadason JM. Aberrant DNA Methylation in Colorectal Cancer: What Should We Target? Trends Cancer. 2017;3:698-712. [RCA] [PubMed] [DOI] [Full Text] [Cited by in Crossref: 64] [Cited by in RCA: 84] [Article Influence: 10.5] [Reference Citation Analysis (0)] |
| 31. | Wu J, Zhang L, Kuchi A, Otohinoyi D, Hicks C. CpG Site-Based Signature Predicts Survival of Colorectal Cancer. Biomedicines. 2022;10. [RCA] [PubMed] [DOI] [Full Text] [Cited by in RCA: 4] [Reference Citation Analysis (0)] |
| 32. | Carmona FJ, Azuara D, Berenguer-Llergo A, Fernández AF, Biondo S, de Oca J, Rodriguez-Moranta F, Salazar R, Villanueva A, Fraga MF, Guardiola J, Capellá G, Esteller M, Moreno V. DNA methylation biomarkers for noninvasive diagnosis of colorectal cancer. Cancer Prev Res (Phila). 2013;6:656-665. [RCA] [PubMed] [DOI] [Full Text] [Cited by in Crossref: 87] [Cited by in RCA: 102] [Article Influence: 8.5] [Reference Citation Analysis (0)] |
| 33. | Cheng YW, Pincas H, Huang J, Zachariah E, Zeng Z, Notterman DA, Paty P, Barany F. High incidence of LRAT promoter hypermethylation in colorectal cancer correlates with tumor stage. Med Oncol. 2014;31:254. [RCA] [PubMed] [DOI] [Full Text] [Cited by in Crossref: 7] [Cited by in RCA: 6] [Article Influence: 0.5] [Reference Citation Analysis (0)] |
| 34. | Evdokimov AA, Netesova NA, Smetannikova NA, Abdurashitov MA, Akishev AG, Malyshev BS, Davidovich ES, Fedotov VV, Kuznetsov VV, Ermolaev YD, Karpov AB, Sazonov AE, Tahauov RM, Degtyarev SK. GLAD-PCR assay of DNA methylation markers associated with colorectal cancer. Biol Med. 2016;8. [DOI] [Full Text] |
| 35. | He Q, Chen HY, Bai EQ, Luo YX, Fu RJ, He YS, Jiang J, Wang HQ. Development of a multiplex MethyLight assay for the detection of multigene methylation in human colorectal cancer. Cancer Genet Cytogenet. 2010;202:1-10. [RCA] [PubMed] [DOI] [Full Text] [Cited by in Crossref: 74] [Cited by in RCA: 91] [Article Influence: 6.1] [Reference Citation Analysis (0)] |
| 36. | Zhang MD, Tortoriello G, Hsueh B, Tomer R, Ye L, Mitsios N, Borgius L, Grant G, Kiehn O, Watanabe M, Uhlén M, Mulder J, Deisseroth K, Harkany T, Hökfelt TG. Neuronal calcium-binding proteins 1/2 localize to dorsal root ganglia and excitatory spinal neurons and are regulated by nerve injury. Proc Natl Acad Sci U S A. 2014;111:E1149-E1158. [RCA] [PubMed] [DOI] [Full Text] [Cited by in Crossref: 38] [Cited by in RCA: 43] [Article Influence: 3.9] [Reference Citation Analysis (0)] |
| 37. | Spencer DH, Russler-Germain DA, Ketkar S, Helton NM, Lamprecht TL, Fulton RS, Fronick CC, O'Laughlin M, Heath SE, Shinawi M, Westervelt P, Payton JE, Wartman LD, Welch JS, Wilson RK, Walter MJ, Link DC, DiPersio JF, Ley TJ. CpG Island Hypermethylation Mediated by DNMT3A Is a Consequence of AML Progression. Cell. 2017;168:801-816.e13. [RCA] [PubMed] [DOI] [Full Text] [Cited by in Crossref: 137] [Cited by in RCA: 165] [Article Influence: 20.6] [Reference Citation Analysis (0)] |
| 38. | Hannou L, Bélanger-Nelson E, O'Callaghan EK, Dufort-Gervais J, Ballester Roig MN, Roy PG, Beaulieu JM, Cermakian N, Mongrain V. Regulation of the Neuroligin-1 Gene by Clock Transcription Factors. J Biol Rhythms. 2018;33:166-178. [RCA] [PubMed] [DOI] [Full Text] [Cited by in Crossref: 3] [Cited by in RCA: 3] [Article Influence: 0.5] [Reference Citation Analysis (0)] |
| 39. | Yu Q, Wang X, Yang Y, Chi P, Huang J, Qiu S, Zheng X, Chen X. Upregulated NLGN1 predicts poor survival in colorectal cancer. BMC Cancer. 2021;21:884. [RCA] [PubMed] [DOI] [Full Text] [Full Text (PDF)] [Cited by in RCA: 11] [Reference Citation Analysis (0)] |
| 40. | Pergolizzi M, Bizzozero L, Maione F, Maldi E, Isella C, Macagno M, Mariella E, Bardelli A, Medico E, Marchiò C, Serini G, Di Nicolantonio F, Bussolino F, Arese M. The neuronal protein Neuroligin 1 promotes colorectal cancer progression by modulating the APC/β-catenin pathway. J Exp Clin Cancer Res. 2022;41:266. [RCA] [PubMed] [DOI] [Full Text] [Full Text (PDF)] [Cited by in RCA: 17] [Reference Citation Analysis (0)] |
| 41. | Cui Y, Chen F, Gao J, Lei M, Wang D, Jin X, Guo Y, Shan L, Chen X. Comprehensive landscape of the renin-angiotensin system in Pan-cancer: a potential downstream mediated mechanism of SARS-CoV-2. Int J Biol Sci. 2021;17:3795-3817. [RCA] [PubMed] [DOI] [Full Text] [Full Text (PDF)] [Cited by in RCA: 8] [Reference Citation Analysis (0)] |
| 42. | Cheng H, Wang Y, Liu C, Wu T, Chen S, Chen M. Development and Verification of a Prostate Cancer Prognostic Signature Based on an Immunogenomic Landscape Analysis. Front Oncol. 2021;11:711258. [RCA] [PubMed] [DOI] [Full Text] [Full Text (PDF)] [Cited by in Crossref: 1] [Cited by in RCA: 4] [Article Influence: 1.0] [Reference Citation Analysis (0)] |
| 43. | Lin P, Guo YN, Shi L, Li XJ, Yang H, He Y, Li Q, Dang YW, Wei KL, Chen G. Development of a prognostic index based on an immunogenomic landscape analysis of papillary thyroid cancer. Aging (Albany NY). 2019;11:480-500. [RCA] [PubMed] [DOI] [Full Text] [Cited by in Crossref: 84] [Cited by in RCA: 102] [Article Influence: 17.0] [Reference Citation Analysis (0)] |


