Copyright
©The Author(s) 2024.
World J Gastrointest Oncol. Feb 15, 2024; 16(2): 414-435
Published online Feb 15, 2024. doi: 10.4251/wjgo.v16.i2.414
Published online Feb 15, 2024. doi: 10.4251/wjgo.v16.i2.414
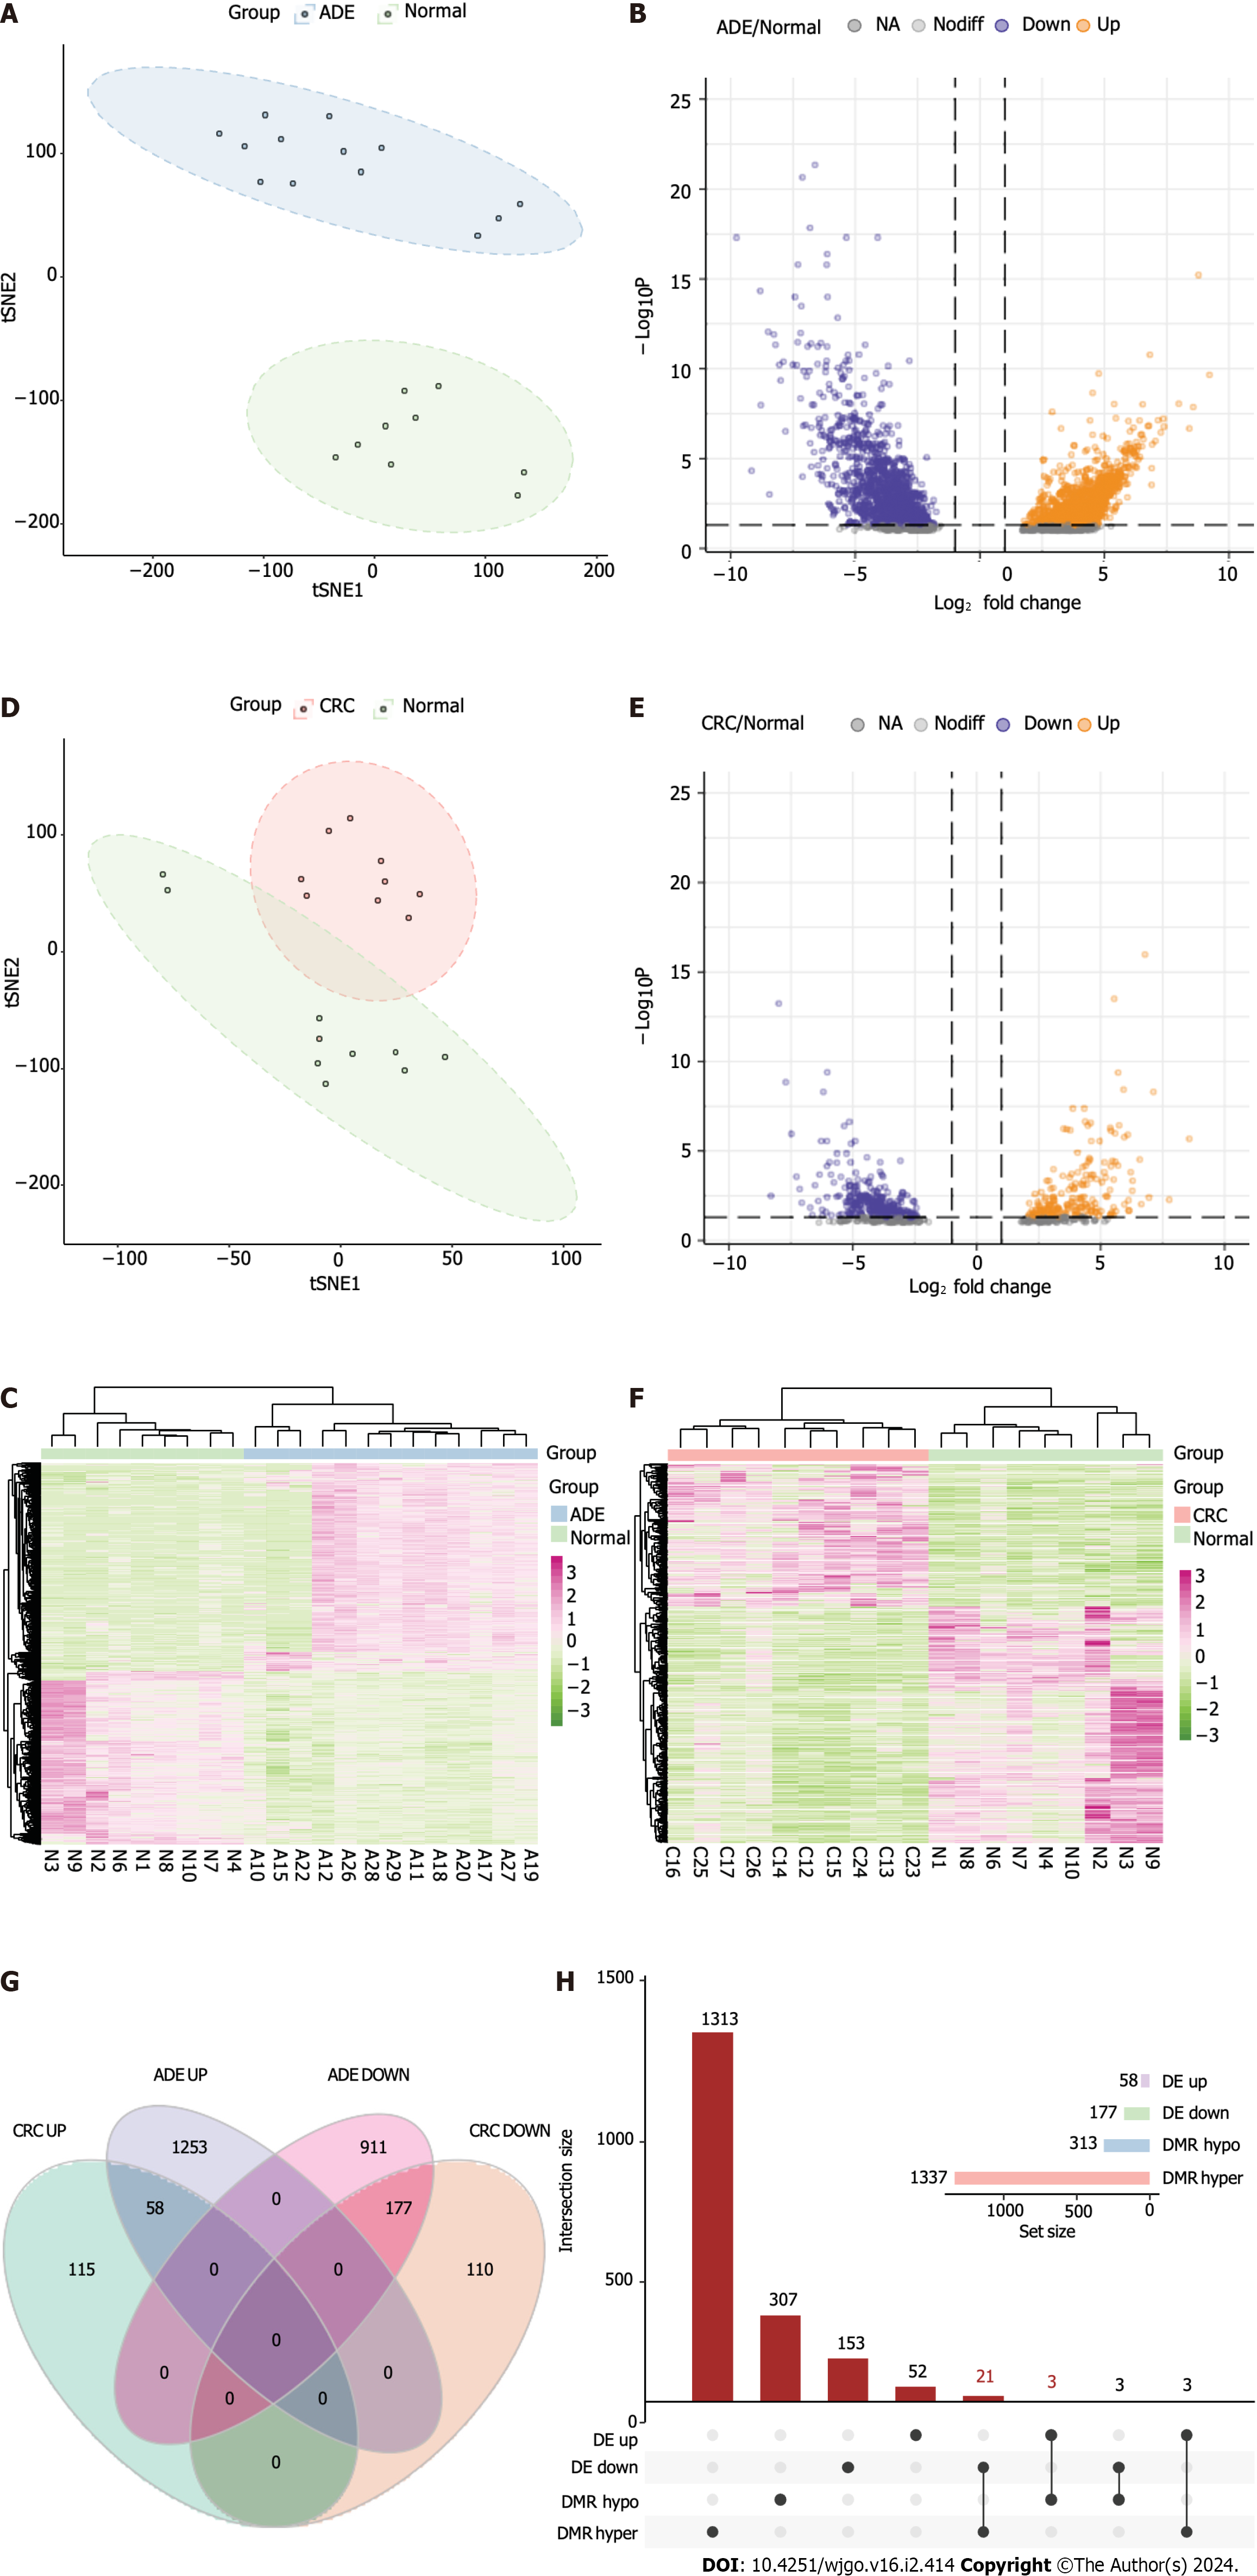
Figure 6 Methylation-regulated differentially expressed gene identification.
A: t-Distributed Stochastic Neighbor Embedding (t-SNE) plot of adenoma (ADE) and normal samples; B: Volcano plot of differentially expressed genes (DEGs) (log2FC > 1, adjusted P < 0.05) between ADE and normal samples; C: Heatmap of DEGs between ADE and normal samples; D: t-SNE plot of colorectal cancer (CRC) and normal samples; E: Volcano plot of DEGs (log2FC > 1, adjusted P < 0.05) between CRC and normal samples; F: Heatmap of the DEGs between ADE and normal samples. The lower horizontal axis shows the sample names, the left vertical axis shows the clusters of DEGs, and the right vertical axis represents gene names. Red represents genes for which expression was upregulated, and green represents those for which expression was downregulated; G: Venn plot of DEGs between ADE and CRC; H: UpSet plot of methylation-regulated DEGs. t-SNE: t-Distributed Stochastic Neighbor Embedding; ADE: Adenoma; CRC: Colorectal cancer; DMRs: Differentially methylated regions.
- Citation: Lu YW, Ding ZL, Mao R, Zhao GG, He YQ, Li XL, Liu J. Early results of the integrative epigenomic-transcriptomic landscape of colorectal adenoma and cancer. World J Gastrointest Oncol 2024; 16(2): 414-435
- URL: https://www.wjgnet.com/1948-5204/full/v16/i2/414.htm
- DOI: https://dx.doi.org/10.4251/wjgo.v16.i2.414


