Copyright
©The Author(s) 2024.
World J Gastrointest Oncol. Feb 15, 2024; 16(2): 414-435
Published online Feb 15, 2024. doi: 10.4251/wjgo.v16.i2.414
Published online Feb 15, 2024. doi: 10.4251/wjgo.v16.i2.414
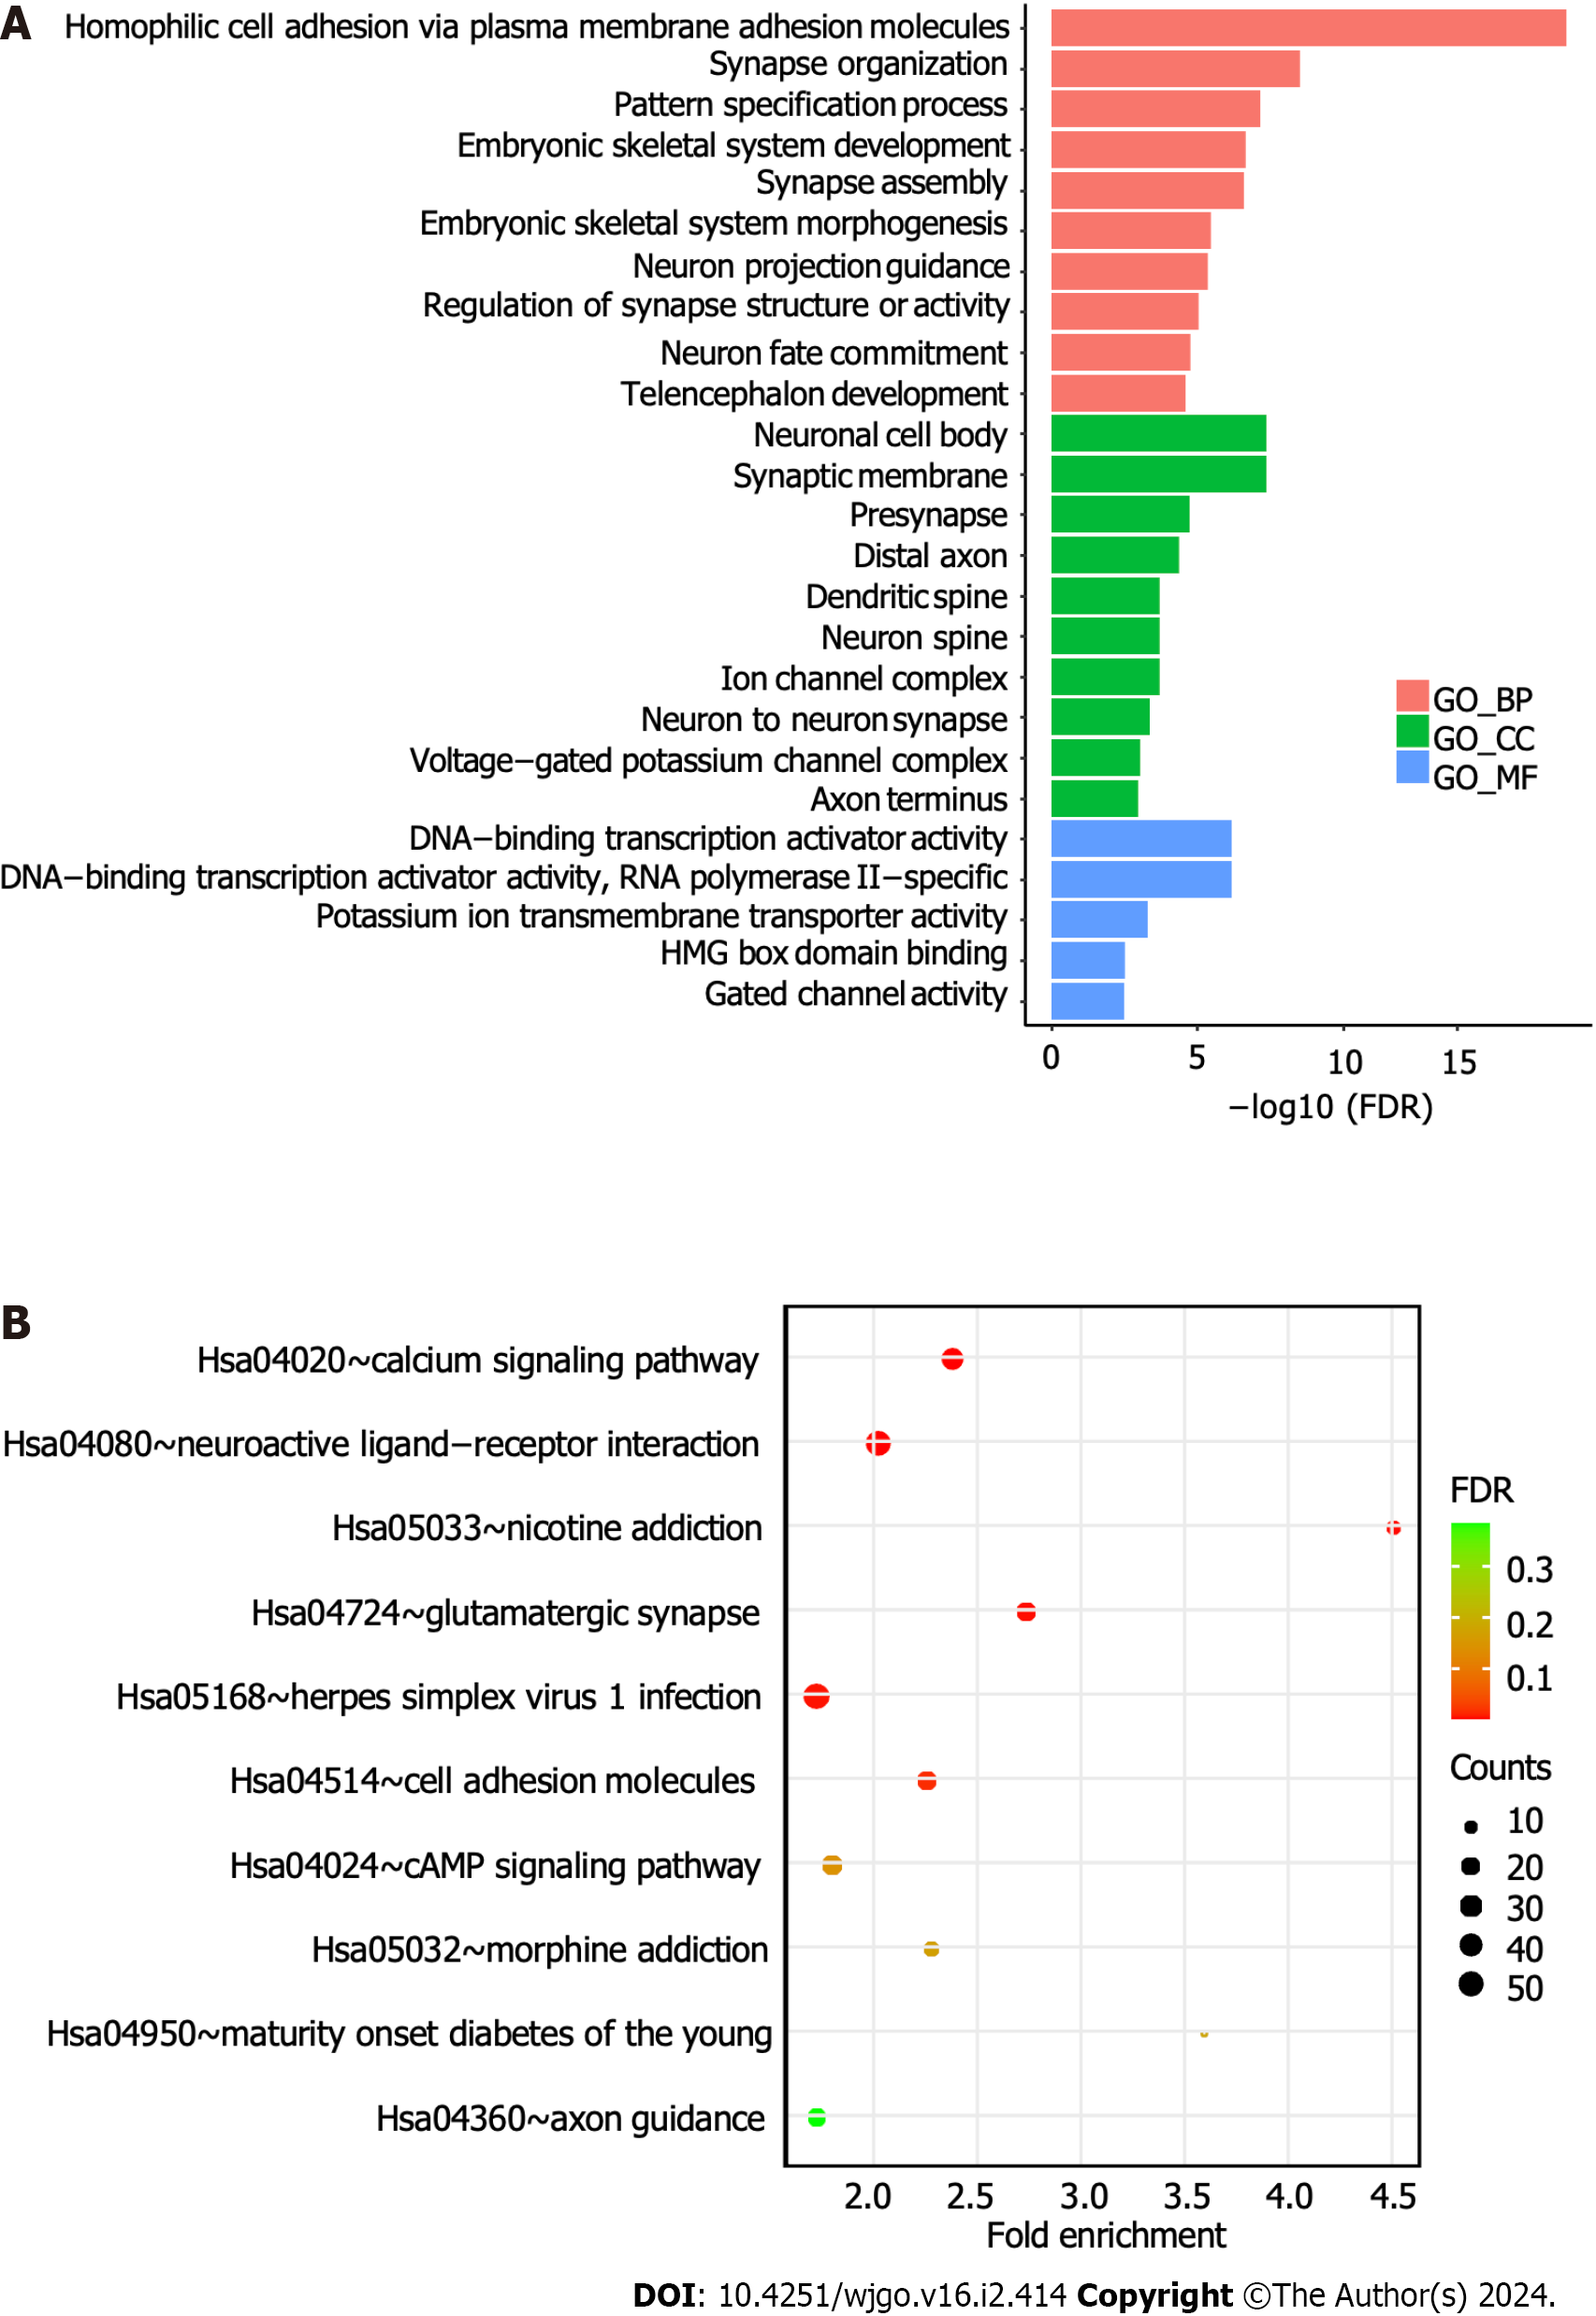
Figure 5 Gene Ontology and Kyoto Encyclopedia of Genes and Genomes pathway enrichment analyses.
A: The bar plot shows the Gene Ontology analysis of 1650 differentially methylated genes; B: Bubble plot showing the Kyoto Encyclopedia of Genes and Genomes analysis of differentially methylated genes. BP: Biological process; CC: Cellular component; MF: Molecular function; FDR: False discovery rate.
- Citation: Lu YW, Ding ZL, Mao R, Zhao GG, He YQ, Li XL, Liu J. Early results of the integrative epigenomic-transcriptomic landscape of colorectal adenoma and cancer. World J Gastrointest Oncol 2024; 16(2): 414-435
- URL: https://www.wjgnet.com/1948-5204/full/v16/i2/414.htm
- DOI: https://dx.doi.org/10.4251/wjgo.v16.i2.414


