Copyright
©The Author(s) 2024.
World J Gastrointest Oncol. Feb 15, 2024; 16(2): 414-435
Published online Feb 15, 2024. doi: 10.4251/wjgo.v16.i2.414
Published online Feb 15, 2024. doi: 10.4251/wjgo.v16.i2.414
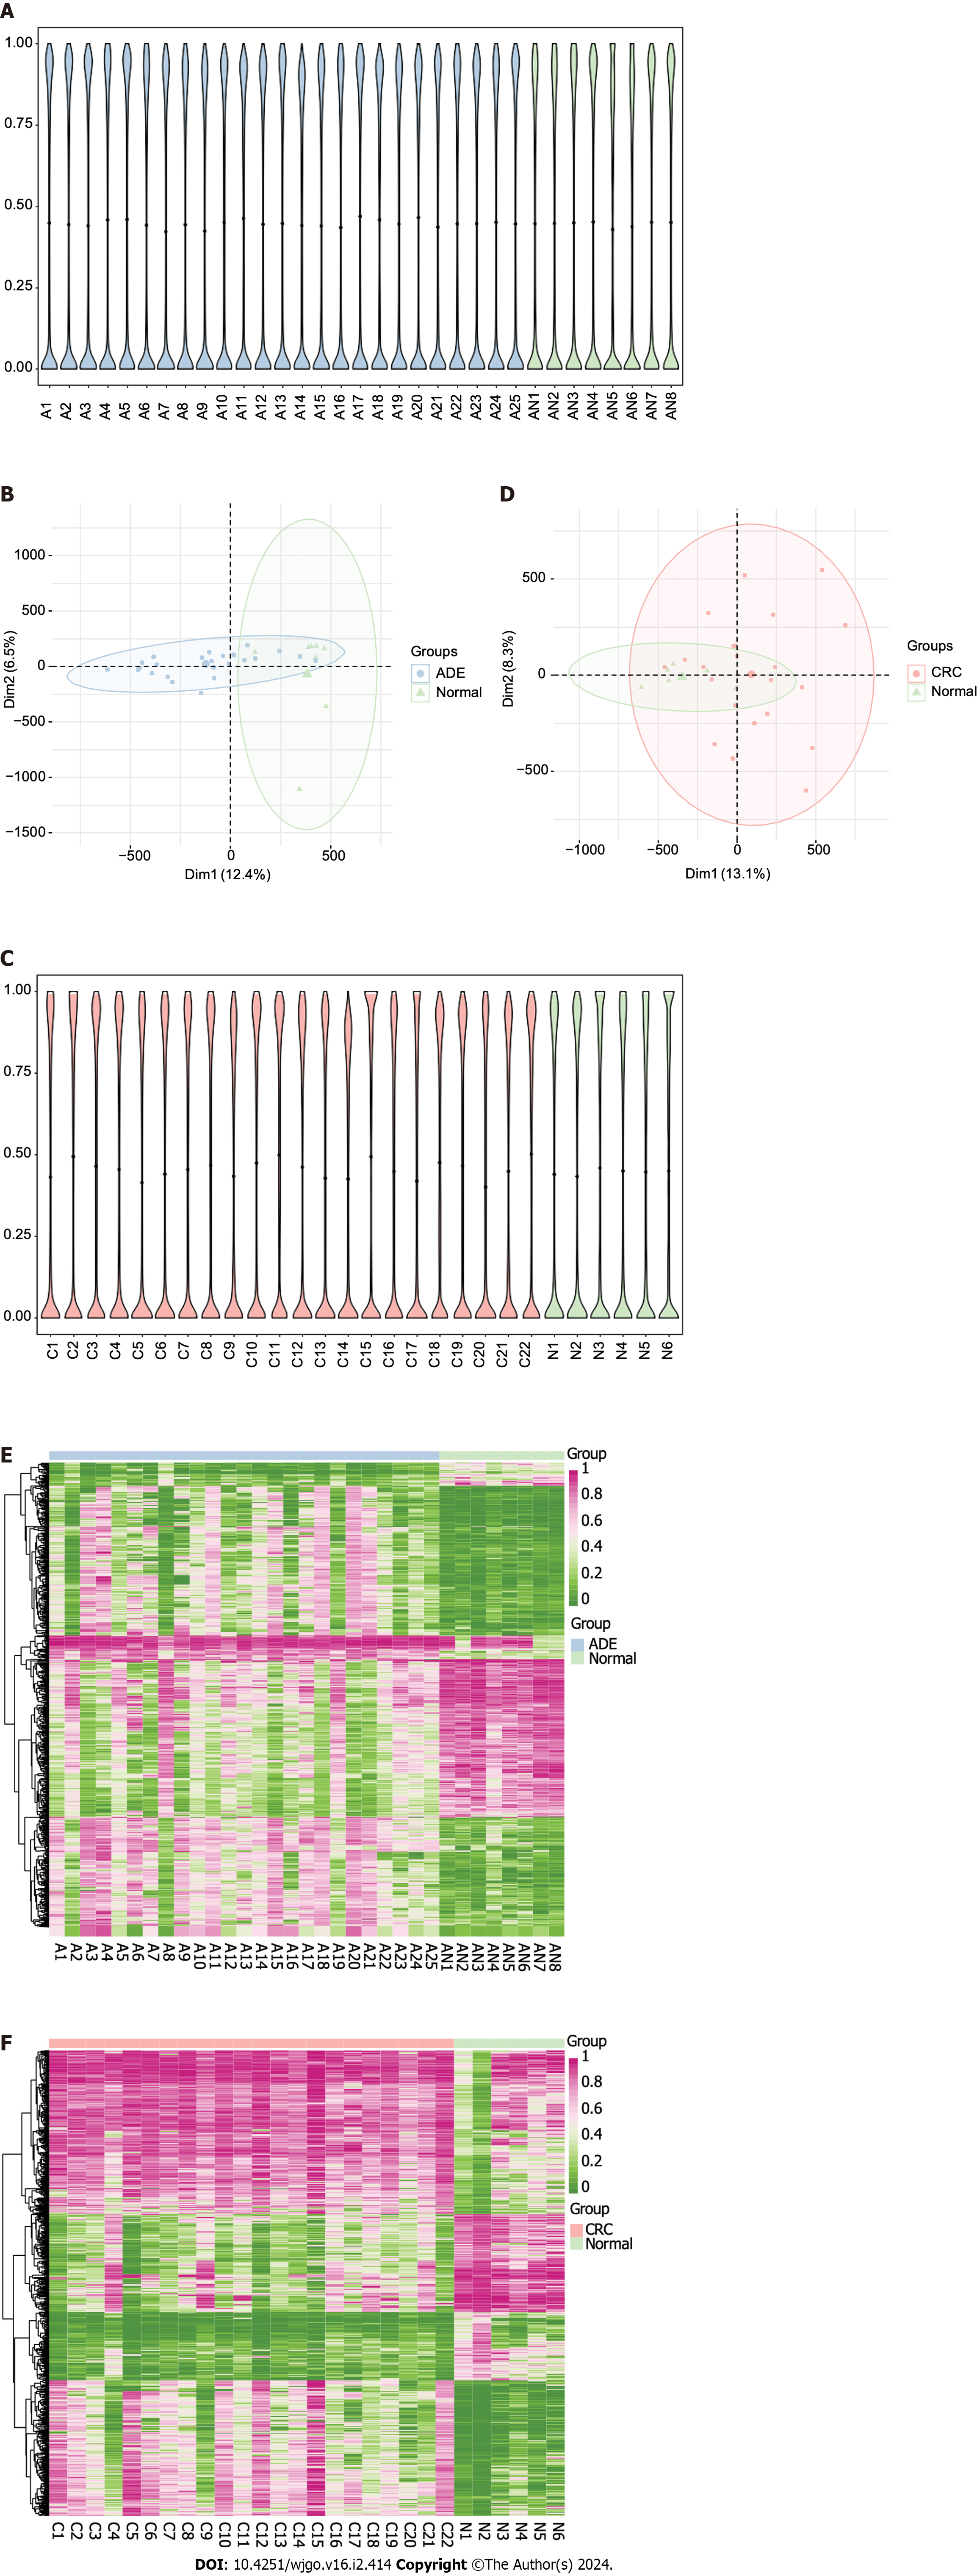
Figure 1 Adenoma and colorectal cancer methylation landscapes.
A: Violin plots of global methylation levels of all CpG sites across the adenoma (ADE) and normal samples (A, adenoma; AN, adjacent normal); B: Principal component analysis (PCA) plots of WGBS data showing the distribution of ADE and normal samples according to CpG site methylation levels; C: Violin plots of global levels of methylation of all CpG sites across colorectal cancer (CRC) and normal samples (C, colorectal cancer; N, normal); D: PCA plots of WGBS data showing the distribution of CRC and normal samples according to CpG site methylation levels; E: Heatmap of the methylation values of the top 1000 differentially methylated positions (DMPs) between the ADE and normal group; F: Heatmap of the methylation values of the top 1000 DMPs between the ADE and normal group. ADE: Adenoma; CRC: Colorectal cancer.
- Citation: Lu YW, Ding ZL, Mao R, Zhao GG, He YQ, Li XL, Liu J. Early results of the integrative epigenomic-transcriptomic landscape of colorectal adenoma and cancer. World J Gastrointest Oncol 2024; 16(2): 414-435
- URL: https://www.wjgnet.com/1948-5204/full/v16/i2/414.htm
- DOI: https://dx.doi.org/10.4251/wjgo.v16.i2.414


