Copyright
©2014 Baishideng Publishing Group Inc.
World J Gastrointest Oncol. Aug 15, 2014; 6(8): 289-300
Published online Aug 15, 2014. doi: 10.4251/wjgo.v6.i8.289
Published online Aug 15, 2014. doi: 10.4251/wjgo.v6.i8.289
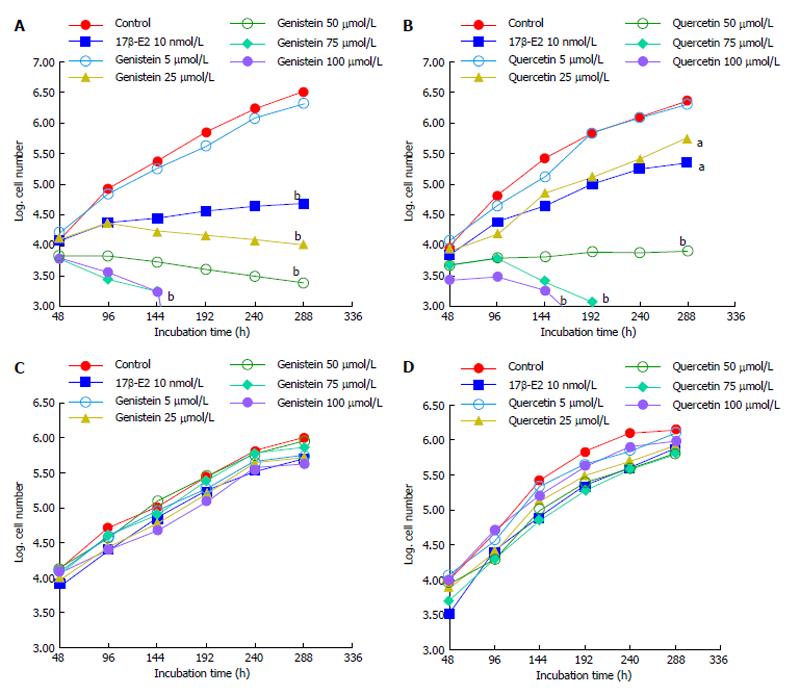
Figure 1 Effects of polyphenols on cell growth.
A: Growth of HCT8-â8-expressing cells in the presence of genistein and 17â-E2; B: Growth of HCT8-β8-expressing cells in the presence of quercetin and 17β-E2; C: Growth of HCT8-pSV2neo-expressing cells in the presence of genistein and 17β-E2; D: Growth of HCT8-pSV2neo-expressing cells in the presence of quercetin and 17β-E2. Values are the means of triplicates; aP < 0.05 vs control; bP < 0.01 vs control.
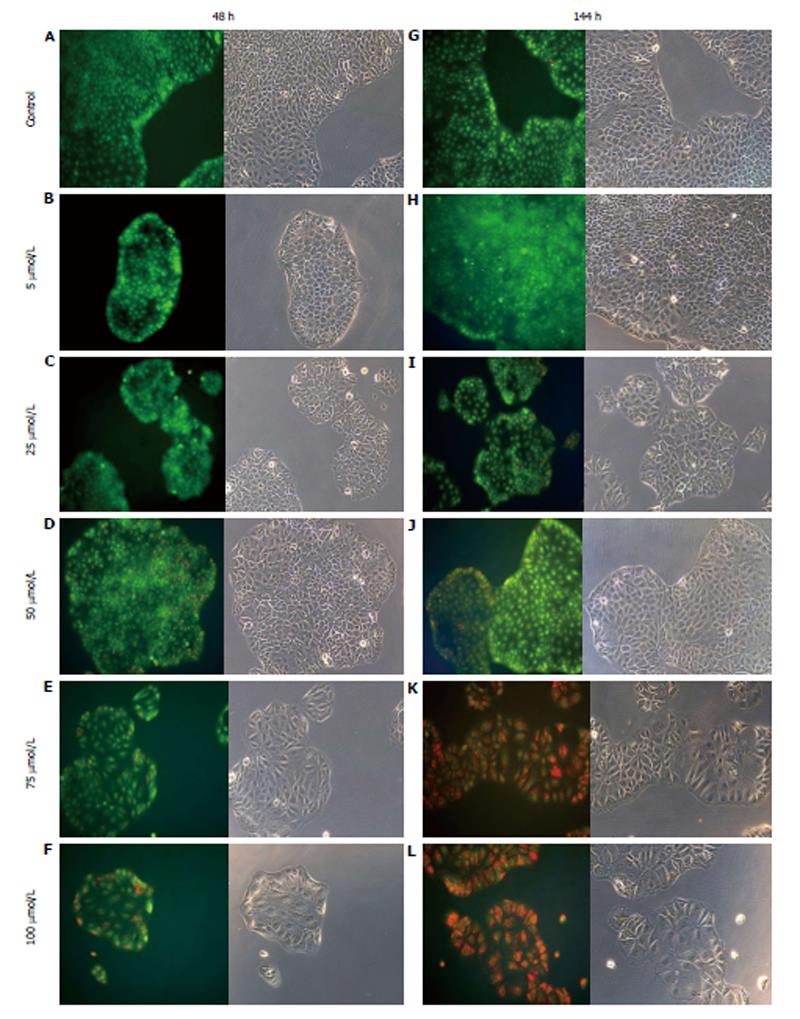
Figure 2 Treatment of HCT8-β8-expressing cells with genistein.
HCT8-β8-expressing cells were treated with various concentrations of genistein for 48 h (A-F) or 144 h (G-L) and stained with acridine orange. Nuclei and mitochondria appear green, whereas lysosomes appear red-orange under fluorescence, adjacent to corresponding phase contrast images (magnification × 20).
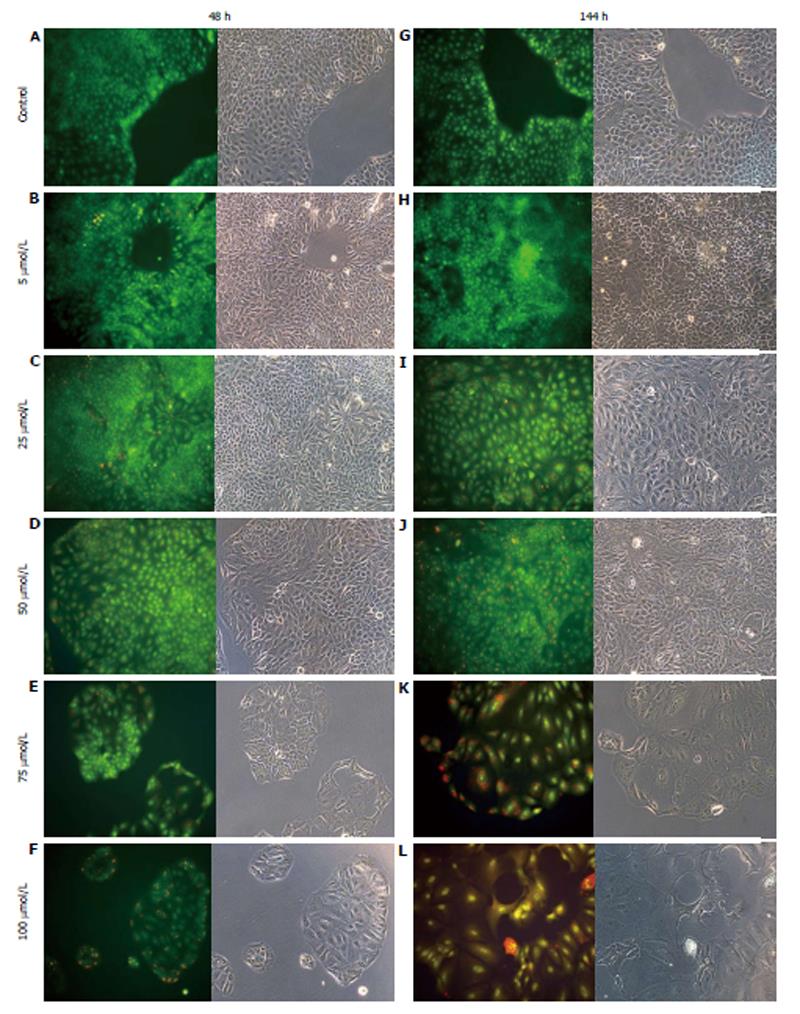
Figure 3 Treatment of HCT8-β8-expressing cells with quercetin.
HCT8- β8-expressing cells were treated with various concentrations of quercetin for 48 h (A-F) or 144 h (G-L) and stained with acridine orange. Nuclei and mitochondria appear green, whereas lysosomes appear red-orange under fluorescence, adjacent to corresponding phase contrast images (magnification, × 20).
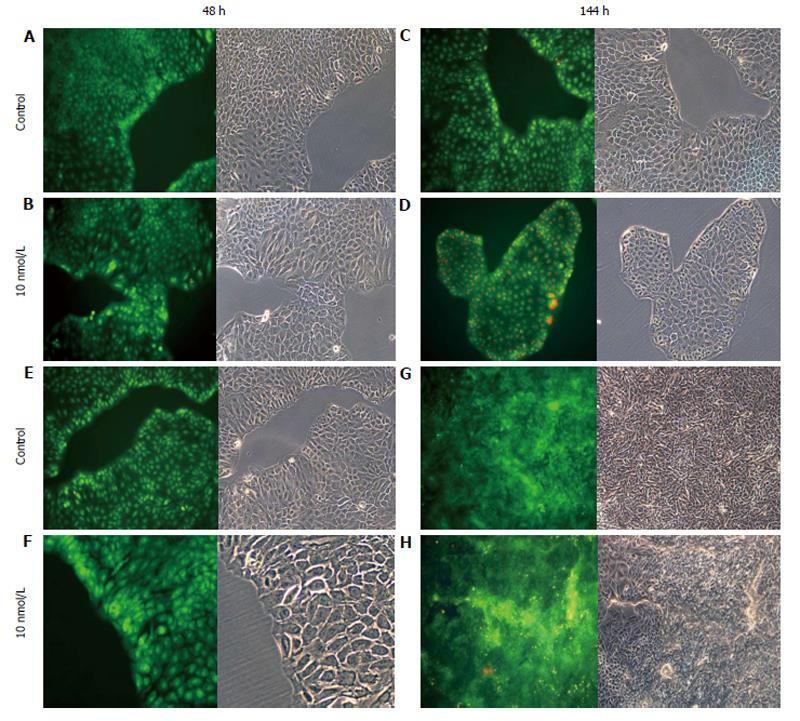
Figure 4 Treatment of cells with 17β-E2.
A-D: HCT8-β8-expressing cells; or E-H: HCT8-pSV2neo-expressing cells were treated with 10 nmol/L 17β-E2 for 48 h (A, B, E, F) or 144 h (C, D, G, H) and stained with acridine orange. Nuclei and mitochondria appear green, whereas lysosomes appear red-orange under fluorescence, adjacent to corresponding phase contrast images (magnification × 20).
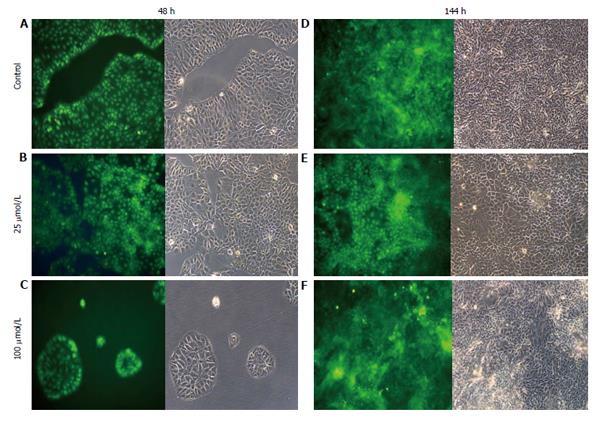
Figure 5 Treatment of HCT8-pSV2neo-expressing cells with genistein.
A-F: HCT8-pSV2neo-expressing cells were treated with 25 μmol/L (B and E) or 100 μmol/L (C and F) genistein for 48 h (A-C) or 144 h (D-F) and stained with acridine orange. Nuclei and mitochondria appear green, whereas lysosomes appear red-orange under fluorescence, adjacent to corresponding phase contrast images (magnification × 20).
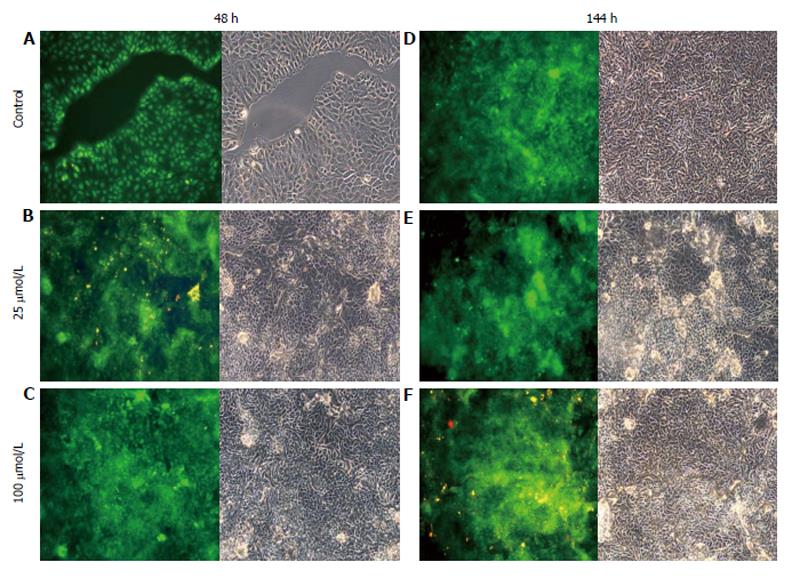
Figure 6 Treatment of HCT8-pSV2neo-expressing cells with quercetin.
A-F: HCT8-pSV2neo-expressing cells were treated with 25 μmol/L (B and E) or 100 μmol/L (C and F) quercetin for 48 h (A-C) or 144 h (D-F) and stained with acridine orange. Nuclei and mitochondria appear green, whereas lysosomes appear red-orange under fluorescence, adjacent to corresponding phase contrast images (magnification × 20).
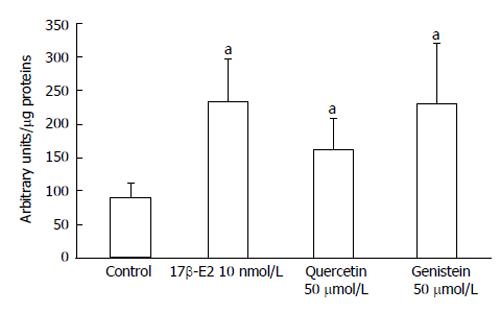
Figure 7 Induction of EREtkLUC reporter gene activity.
Treatment of HCT8-â8-expressing cells with 17â-E2, genistein and quercetin induces EREtk expression observed as relative luciferase activity. Values are the mean ± SD of triplicates; aP < 0.05 vs control.
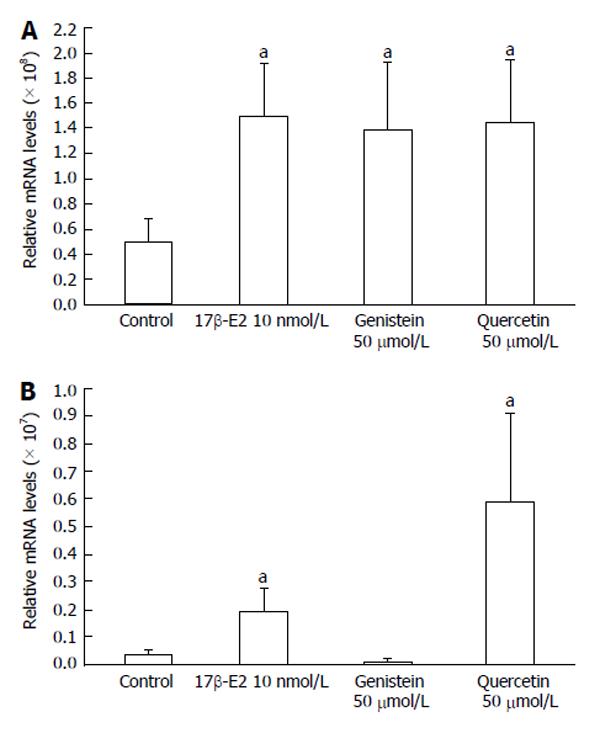
Figure 8 Expression of ERβ mRNA levels by quantitative real-time reverse transcription-polymerase chain reaction.
Induction of ERβ expression by 17β-E2, genistein and quercetin in A: HCT8-β8-expressing cells; B: HCT8-pSV2neo-expressing cells. The results are expressed relative to RPS18 mRNA levels. Values are the mean ± SD of quadruplicates; aP < 0.05 vs control.
-
Citation: Pampaloni B, Palmini G, Mavilia C, Zonefrati R, Tanini A, Brandi ML.
In vitro effects of polyphenols on colorectal cancer cells. World J Gastrointest Oncol 2014; 6(8): 289-300 - URL: https://www.wjgnet.com/1948-5204/full/v6/i8/289.htm
- DOI: https://dx.doi.org/10.4251/wjgo.v6.i8.289


