
















Copyright: ©Author(s) 2026.
World J Gastrointest Oncol. Sep 15, 2026; 18(9): 121675
Published online Sep 15, 2026. doi: 10.4251/wjgo.121675
Published online Sep 15, 2026. doi: 10.4251/wjgo.121675
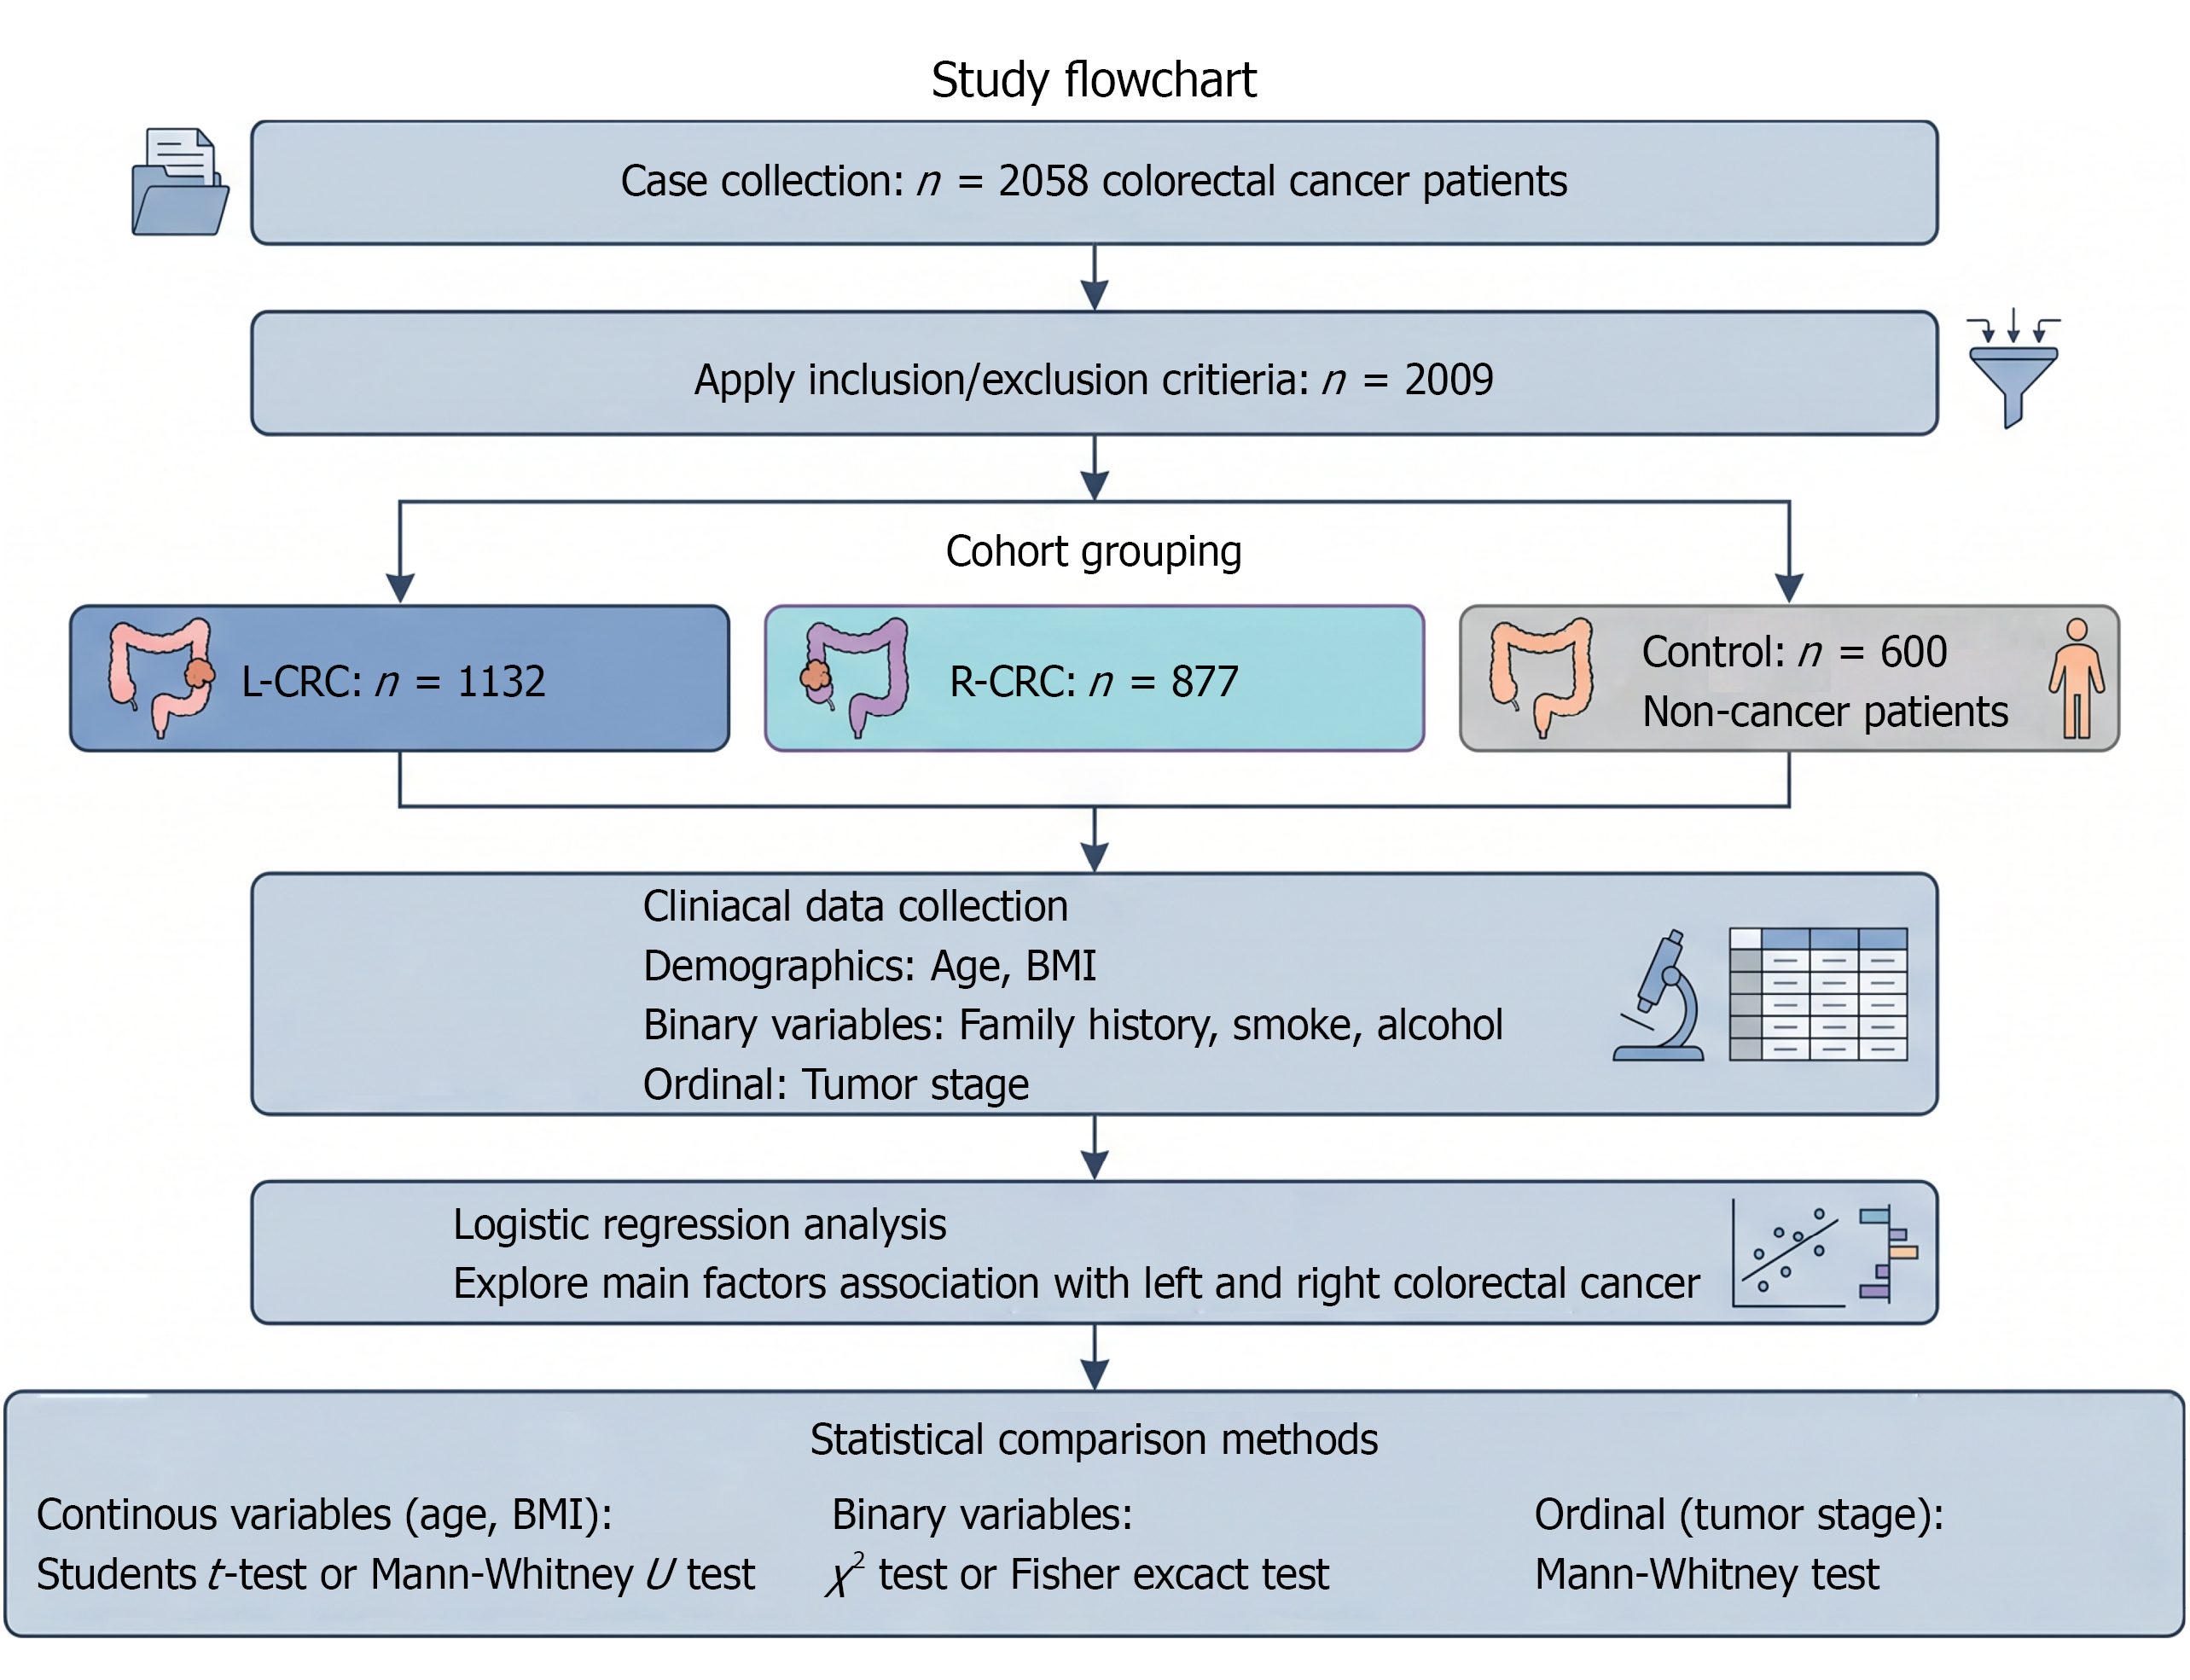
Figure 1 Study flowchart for the comparative analysis of left-sided colorectal cancer and right-sided colorectal cancer.
The study began with the collection of data from 2580 colorectal cancer (CRC) patients, of whom 2009 met the inclusion or exclusion criteria and were included in the analysis [1132 left-sided CRC (L-CRC), 877 right-sided CRC (R-CRC) and 600 control]. Clinical data, including demographics, laboratory tests [triglyceride (TG), low-density lipoprotein (LDL)], medical and family history, and lifestyle factors (smoking, alcohol), were collected. Logistic regression analysis was conducted to identify major factors associated with L-CRC vs R-CRC, using age, TG, LDL, past history, family history, smoking, alcohol, and tumor stage as input variables. The analysis included both univariable and multivariable models to estimate adjusted ORs and 95%CIs. Comparative analysis was performed using t-tests for continuous variables (age, TG, LDL), χ2 tests for binary variables (past medical history, family history, smoking, alcohol), and Mann-Whitney U tests for ordinal variables (tumor stage). L-CRC: Left-sided colorectal cancer; R-CRC: Right-sided colorectal cancer; BMI: Body mass index.
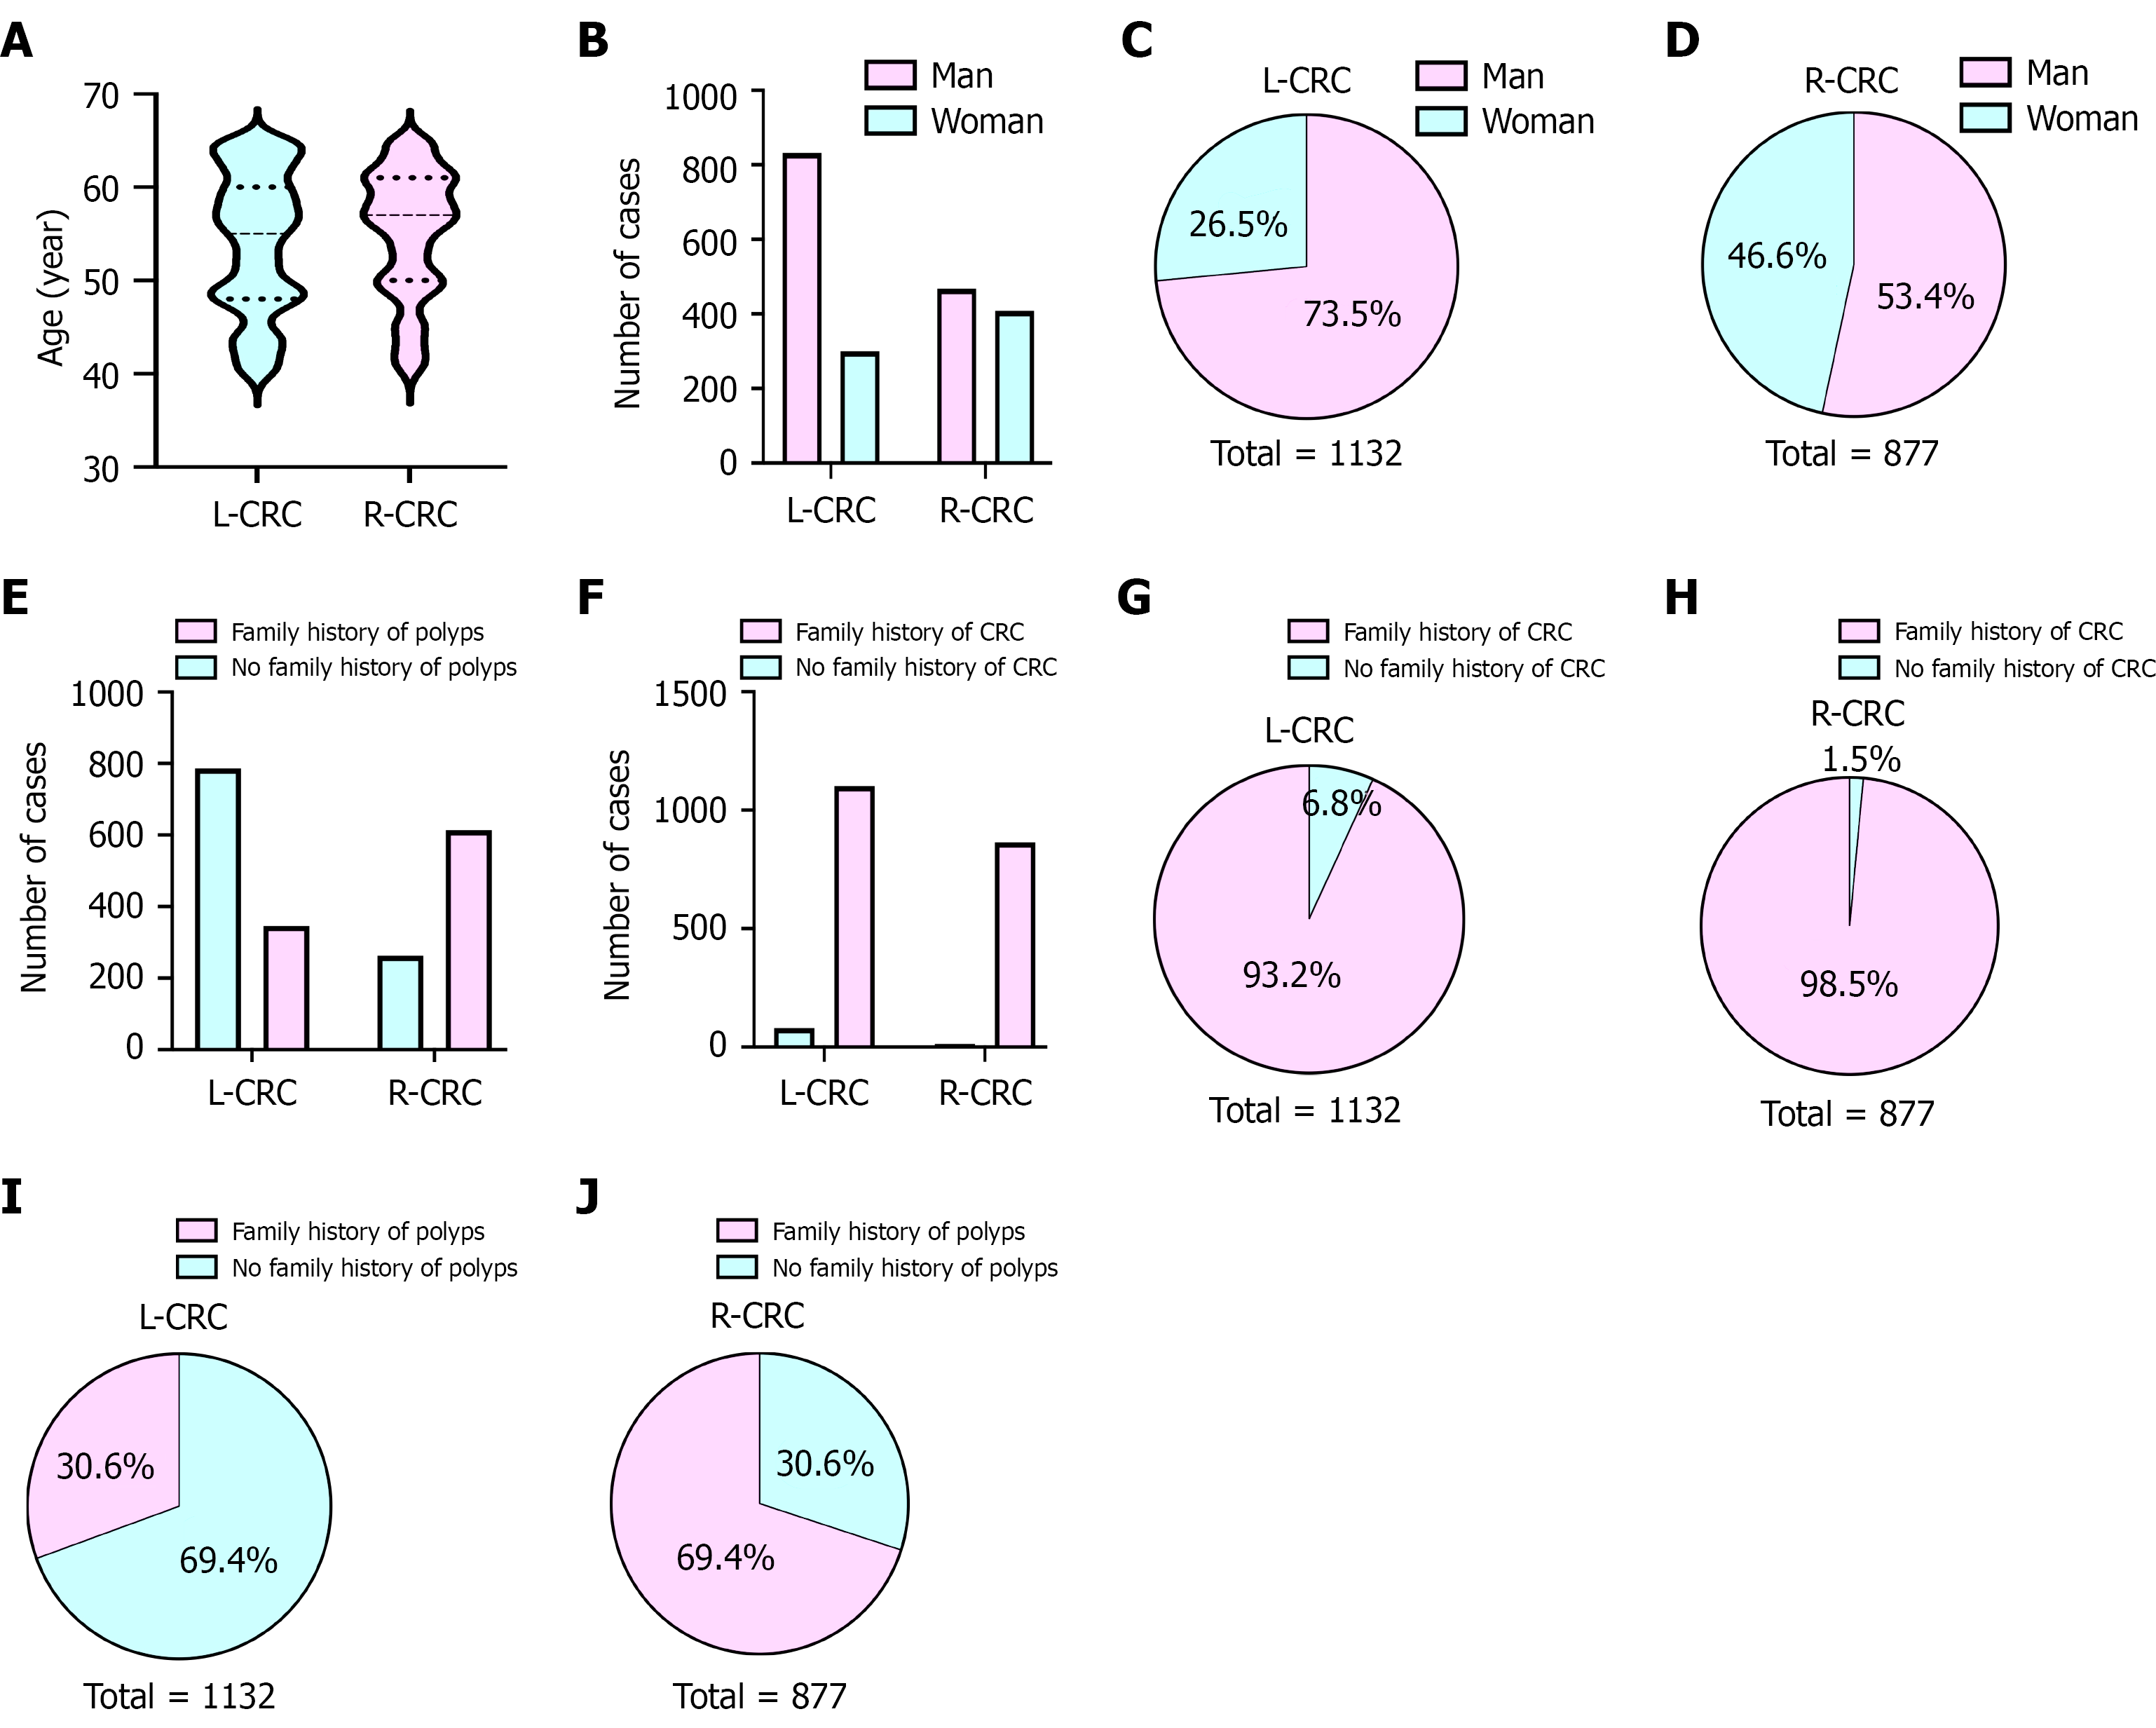
Figure 2 Comparison of demographic and clinical characteristics between left-sided colorectal cancer and right-sided colorectal cancer groups.
A: Violin plot showing the distribution of age (year) in left-sided colorectal cancer (L-CRC) and right-sided colorectal cancer (R-CRC) groups. The light blue violin represents the L-CRC group, and the light purple violin represents the R-CRC group. Data were analyzed using an independent samples t-test; B: Bar plot comparing the distribution of sex between L-CRC and R-CRC groups. The light blue sector indicates female, and light purple sector indicates male; C and D: Pie charts displaying the sex distribution (male vs female) in L-CRC (total = 1132) and R-CRC (total = 877) groups. The light blue sector represents males, and light purple sector represents females; E: Bar plot showing the distribution of family history of polyps in L-CRC and R-CRC groups. The light blue sector indicates Family history of polyps, and light purple sector indicates no family history of polyps; F: Bar plot showing the distribution of family history of colorectal cancer (CRC) in L-CRC and R-CRC groups. The light blue sector indicates family history of CRC, and light purple sector indicates no family history of CRC; G and H: Pie charts showing the proportion of family history of CRC in L-CRC (total = 1132) and R-CRC (total = 877) groups. The light blue sector represents family history of CRC, and light purple sector represents no family history of CRC; I and J: Pie charts showing the proportion of family history of polyps in L-CRC (total = 1132) and R-CRC (total = 877) groups. The light blue sector represents family history of polyps, and light purple sector represents no family history of polyps. All statistical analyses yielded P < 0.001. Data were analyzed using an independent samples t-test for continuous variables (A) and χ2 tests for categorical variables (B-G). L-CRC: Left-sided colorectal cancer; R-CRC: Right-sided colorectal cancer; CRC: Colorectal cancer.
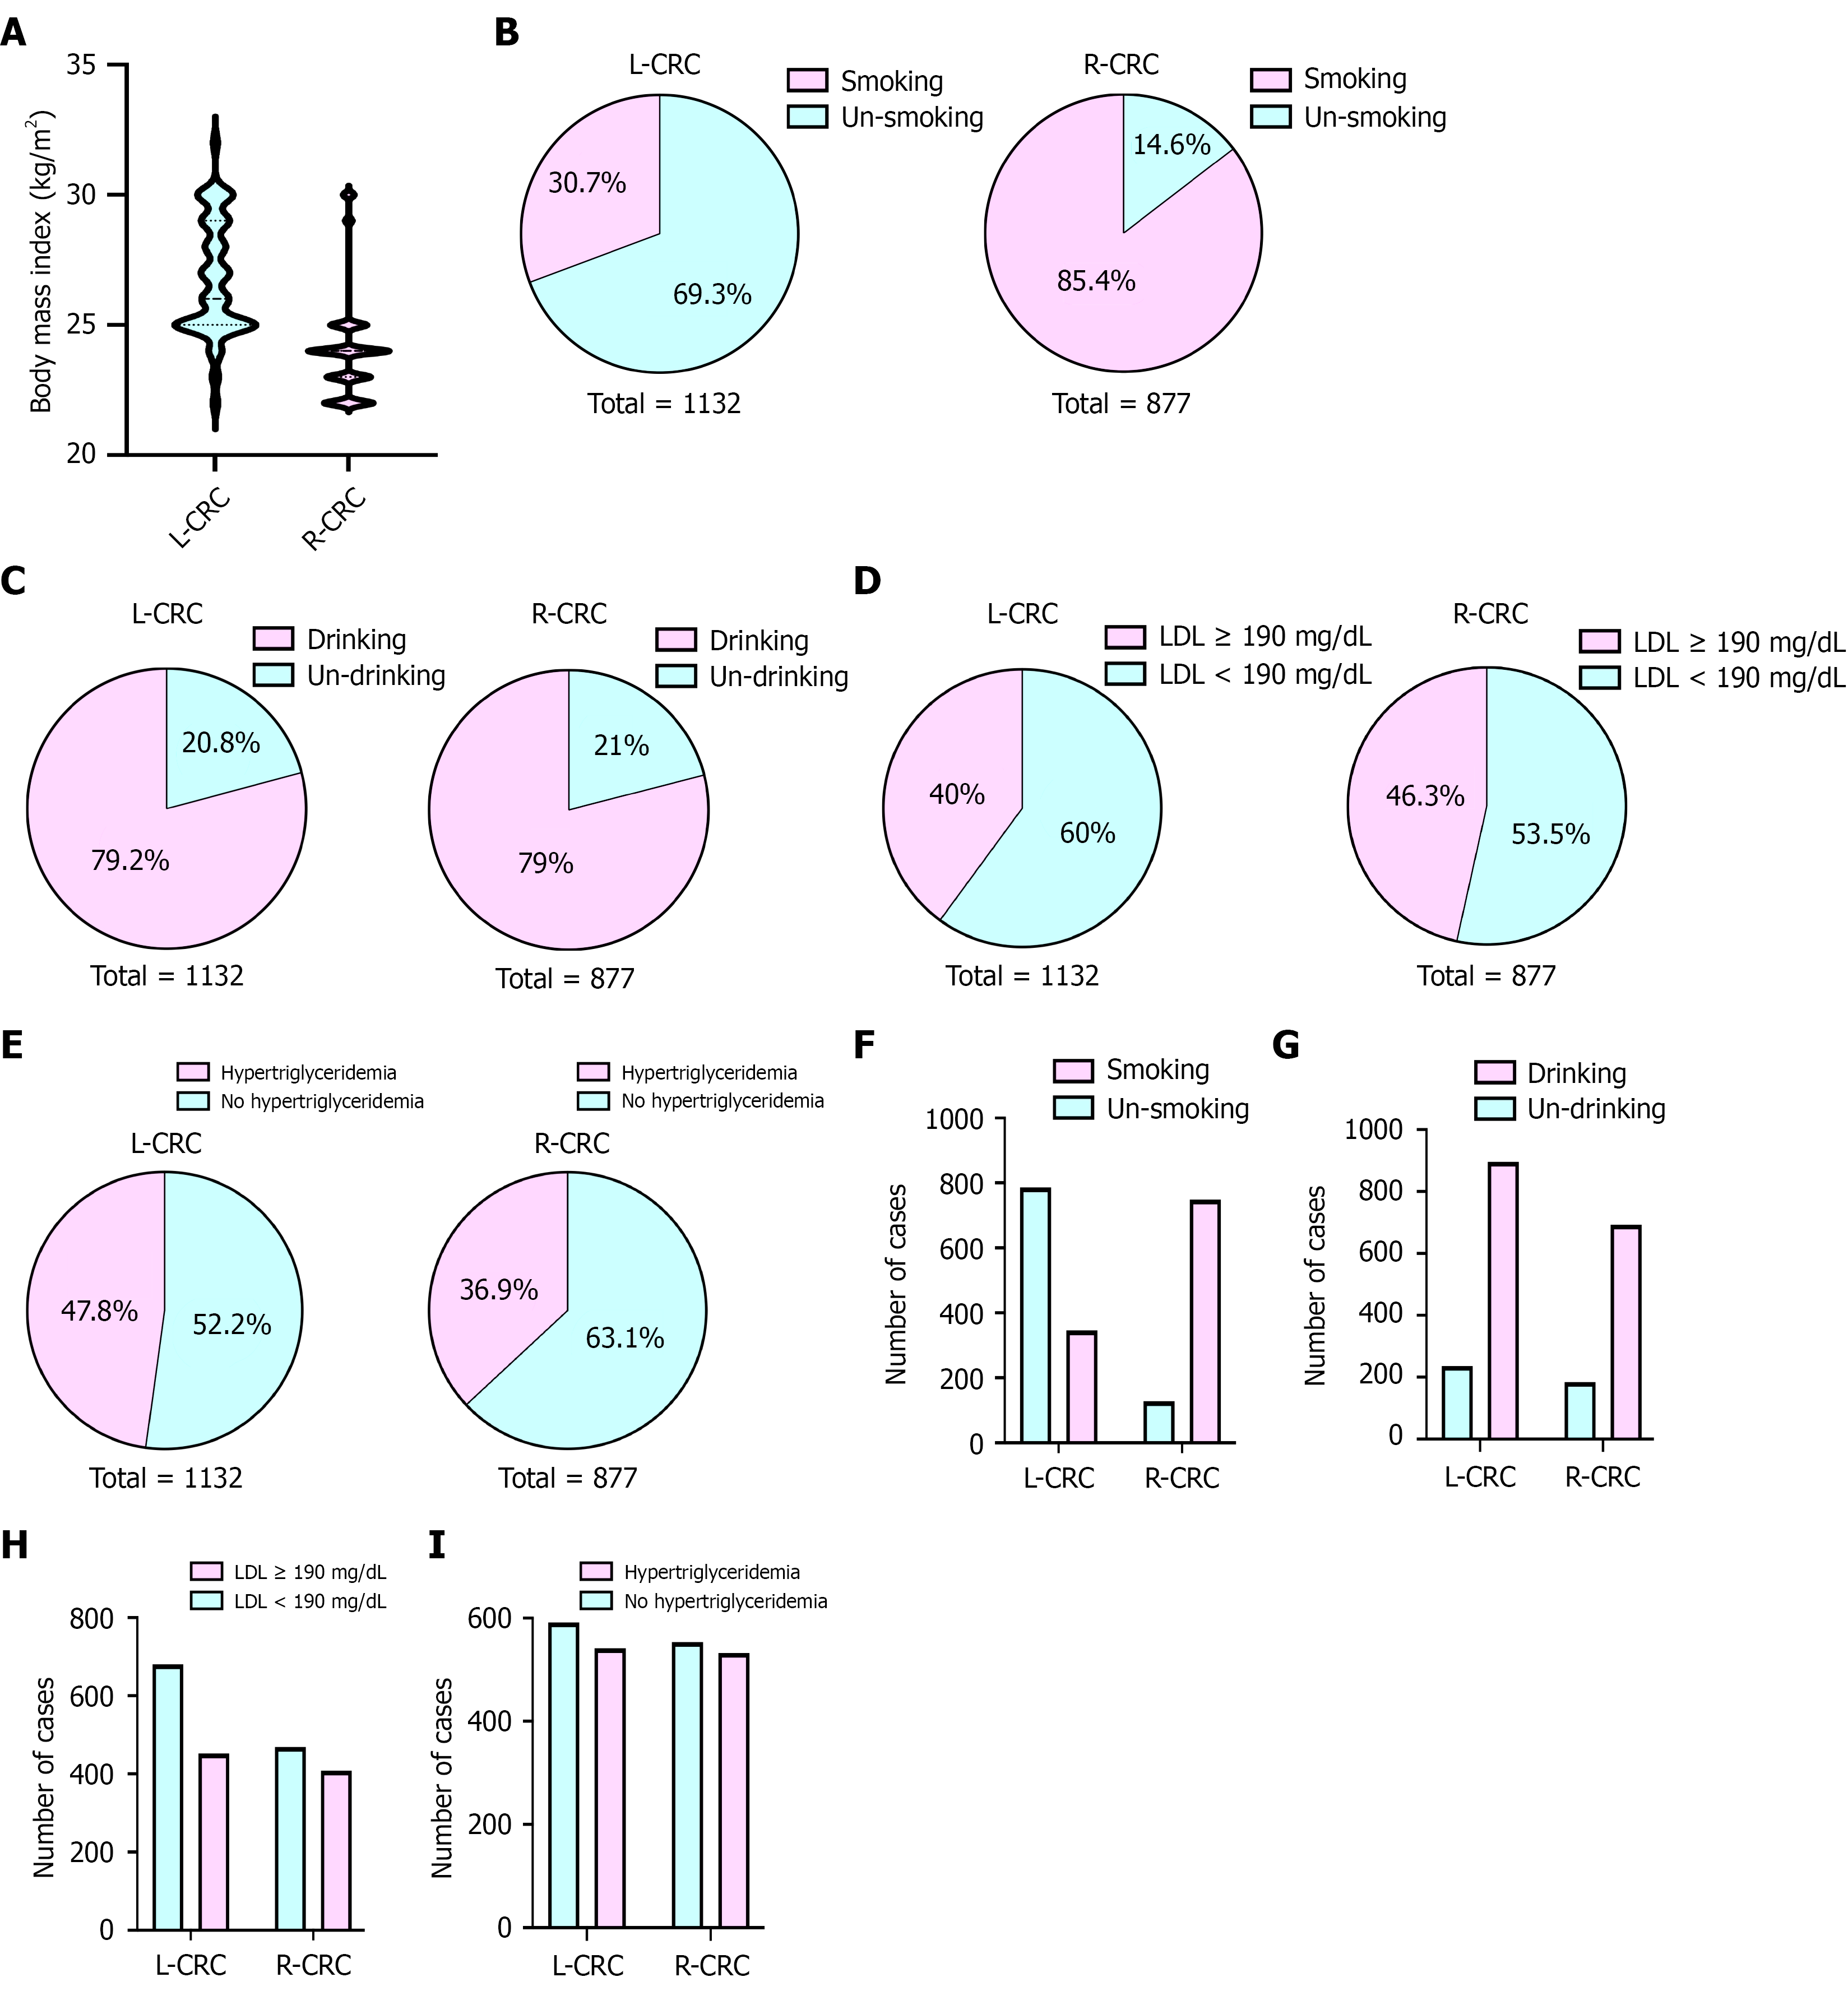
Figure 3 Comparison of metabolic indicators and lifestyle factors between left-sided colorectal cancer and right-sided colorectal cancer groups.
A: Comparison of body mass index between the left-sided colorectal cancer (L-CRC) and right-sided colorectal cancer (R-CRC) groups. Data are presented as mean ± SD. Statistical analysis was performed using an independent samples t-test; B-E: Pie charts illustrating the proportions of patients in the L-CRC (n = 1132) and R-CRC (n = 877) groups based on smoking status (smoking vs un-smoking; B), drinking status (drinking vs un-drinking; C), low-density lipoprotein (LDL) levels (LDL ≥ 190 mg/dL vs LDL < 190 mg/dL; D), and hypertriglyceridemia status (hypertriglyceridemia vs no hypertriglyceridemia; E); F-I: Bar charts depicting the absolute number of patients in each group corresponding to the characteristics shown in panels B-E, respectively. Statistical significance for categorical variables (panels B-E) was determined using the χ2 test. All statistical tests yielded P < 0.001. L-CRC: Left-sided colorectal cancer; R-CRC: Right-sided colorectal cancer; LDL: Low-density lipoprotein.
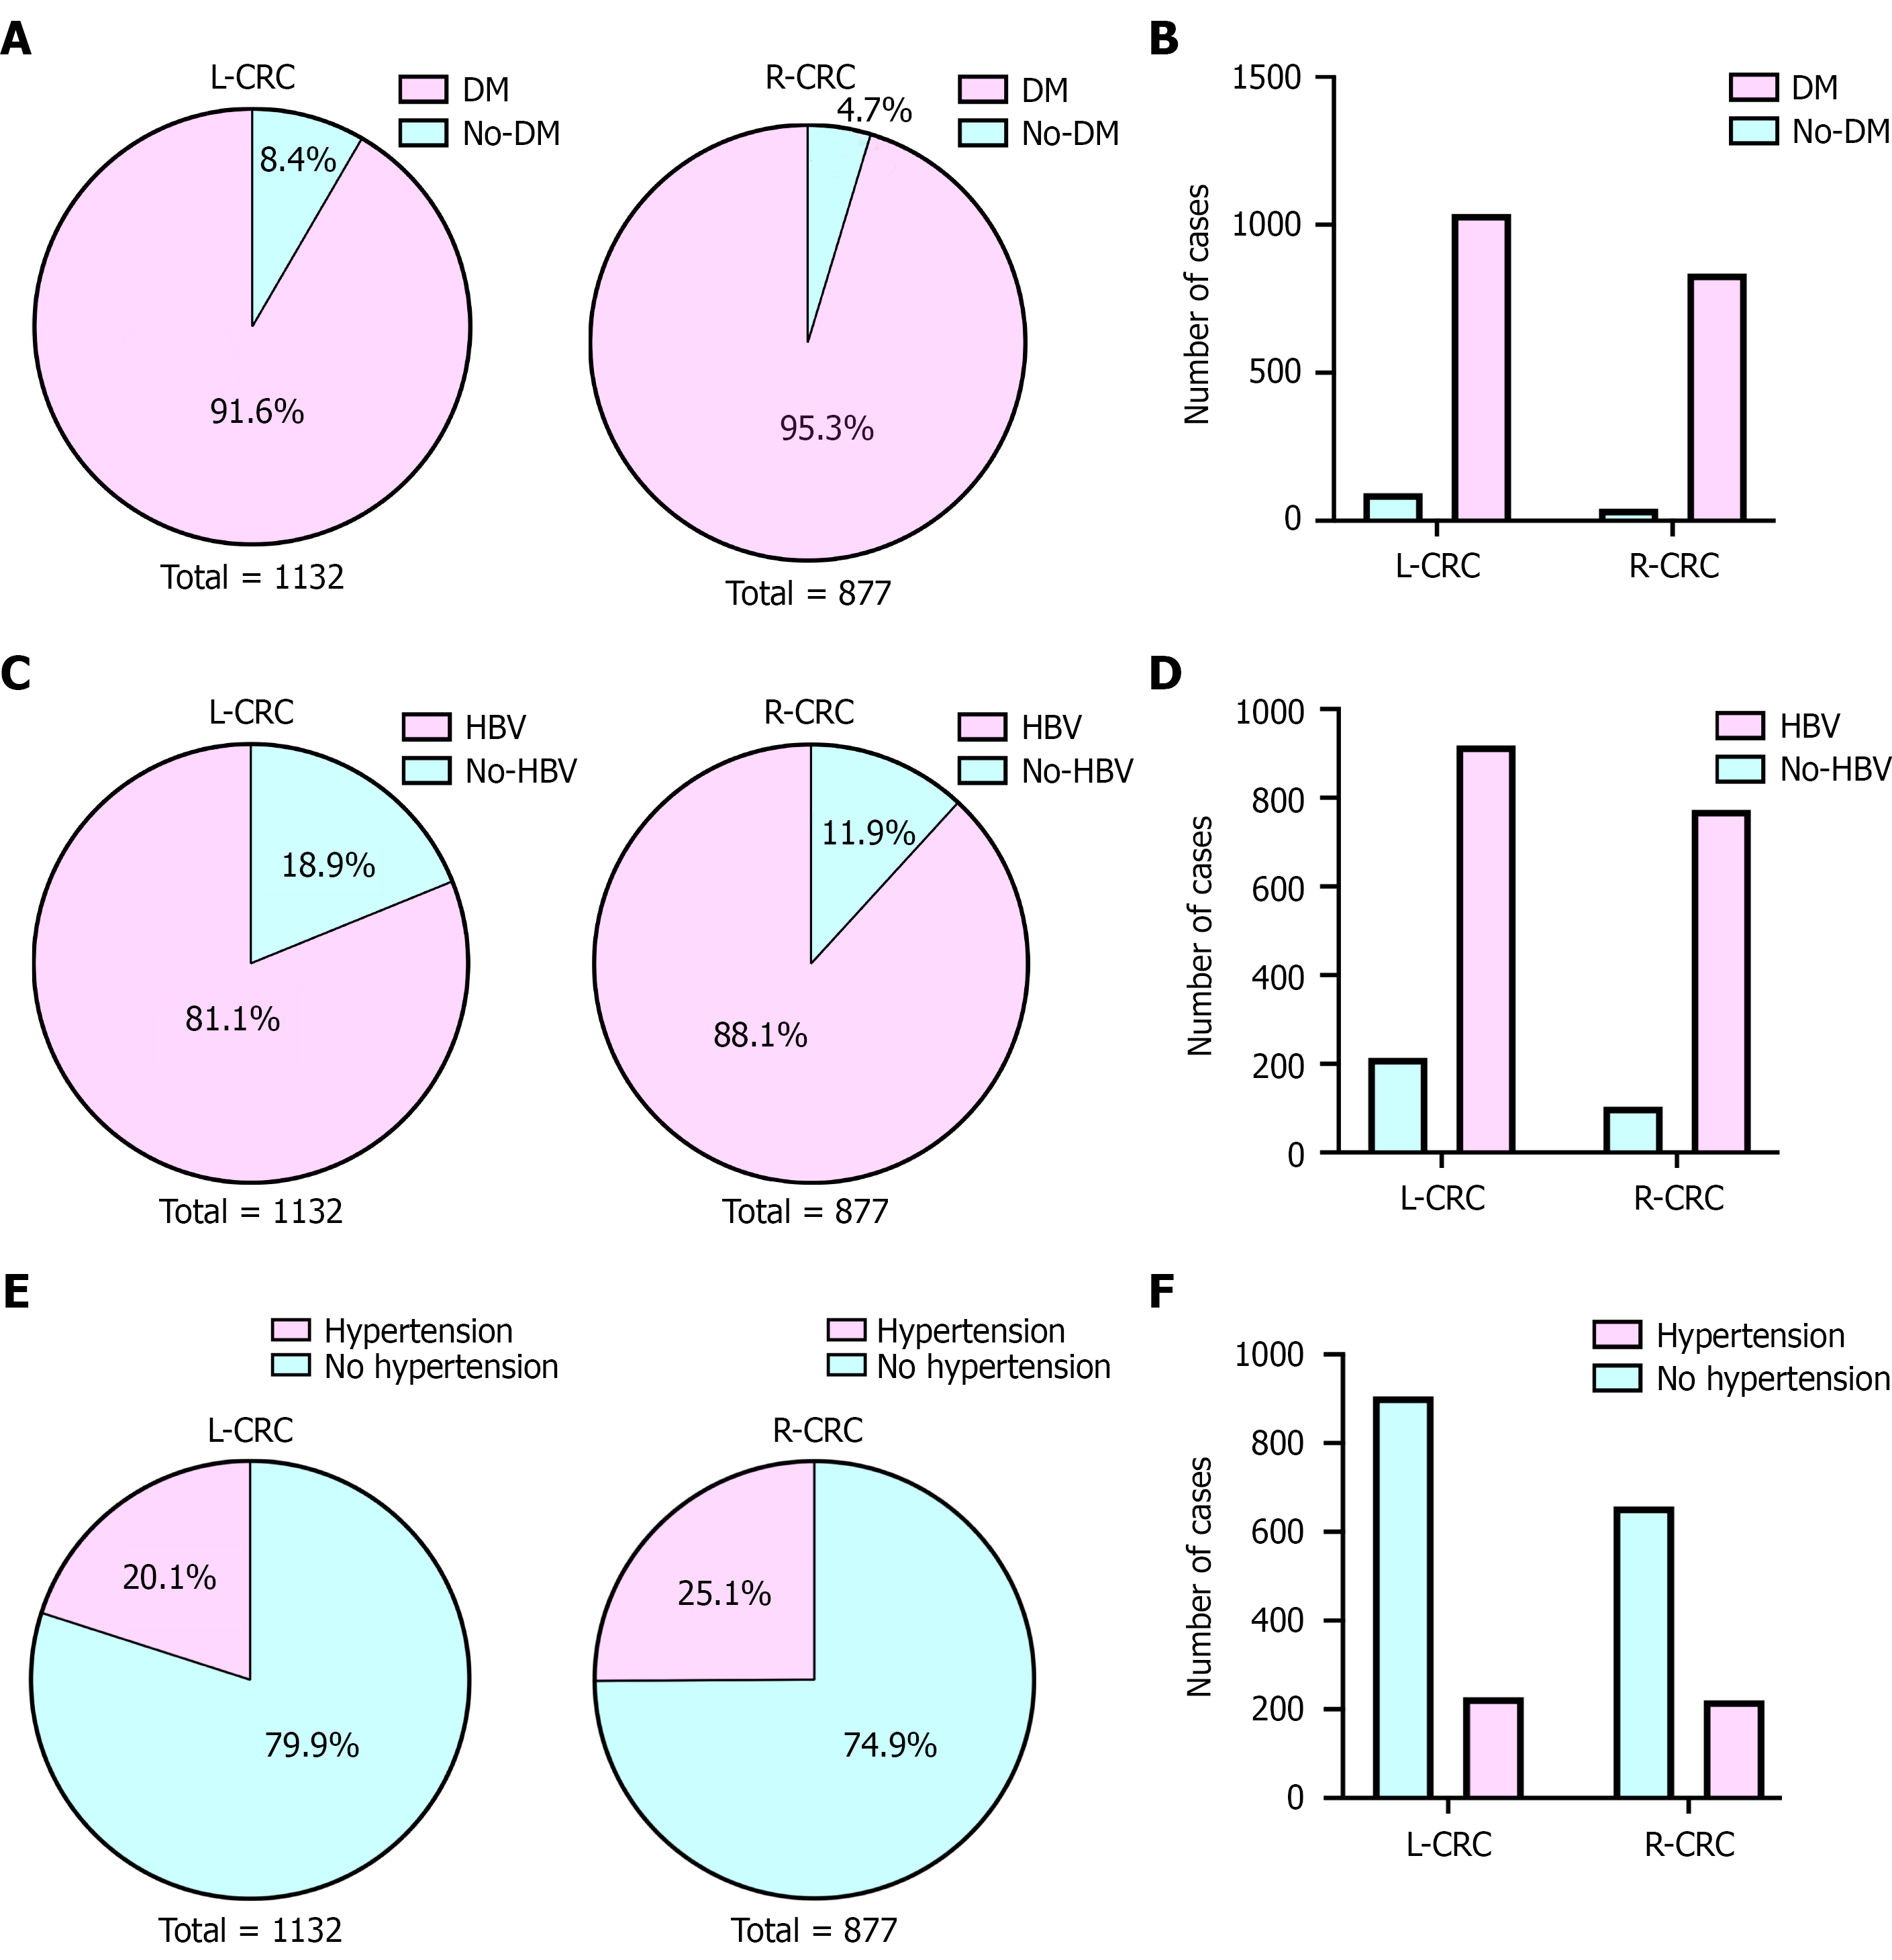
Figure 4 Comparison of comorbidities between left-sided colorectal cancer and right-sided colorectal cancer groups.
A: Pie charts showing the proportion of diabetes mellitus (DM) in left-sided colorectal cancer (L-CRC; total = 1132) and right-sided colorectal cancer (R-CRC; total = 877) groups; B: Bar plot comparing the number of cases with or without DM between the L-CRC and R-CRC groups. Data were analyzed using a χ2 test; C: Pie charts showing the proportion of hepatitis B virus (HBV) infection in L-CRC (total = 1132) and R-CRC (total = 877) groups; D: Bar plot comparing the number of cases with or without HBV infection between the L-CRC and R-CRC groups. Data were analyzed using a χ2 test; E: Pie charts showing the proportion of hypertension in L-CRC (total = 1132) and R-CRC (total = 877) groups; F: Bar plot comparing the number of cases with or without hypertension between the L-CRC and R-CRC groups. Data were analyzed using a χ2 test. All data are presented as percentages or case numbers. P < 0.001 for all comparisons. L-CRC: Left-sided colorectal cancer; R-CRC: Right-sided colorectal cancer; DM: Diabetes mellitus; HBV: Hepatitis B virus.
- Citation: Lai Y, Ye YF, Lin Y, Yu YF, Chen QK. Retrospective analysis of risk factors for left-sided vs right-sided colon cancer in a southern Chinese Han population. World J Gastrointest Oncol 2026; 18(9): 121675
- URL: https://www.wjgnet.com/1948-5204/full/v18/i9/121675.htm
- DOI: https://dx.doi.org/10.4251/wjgo.121675