
















Copyright: ©Author(s) 2026.
World J Gastrointest Oncol. Sep 15, 2026; 18(9): 121675
Published online Sep 15, 2026. doi: 10.4251/wjgo.121675
Published online Sep 15, 2026. doi: 10.4251/wjgo.121675
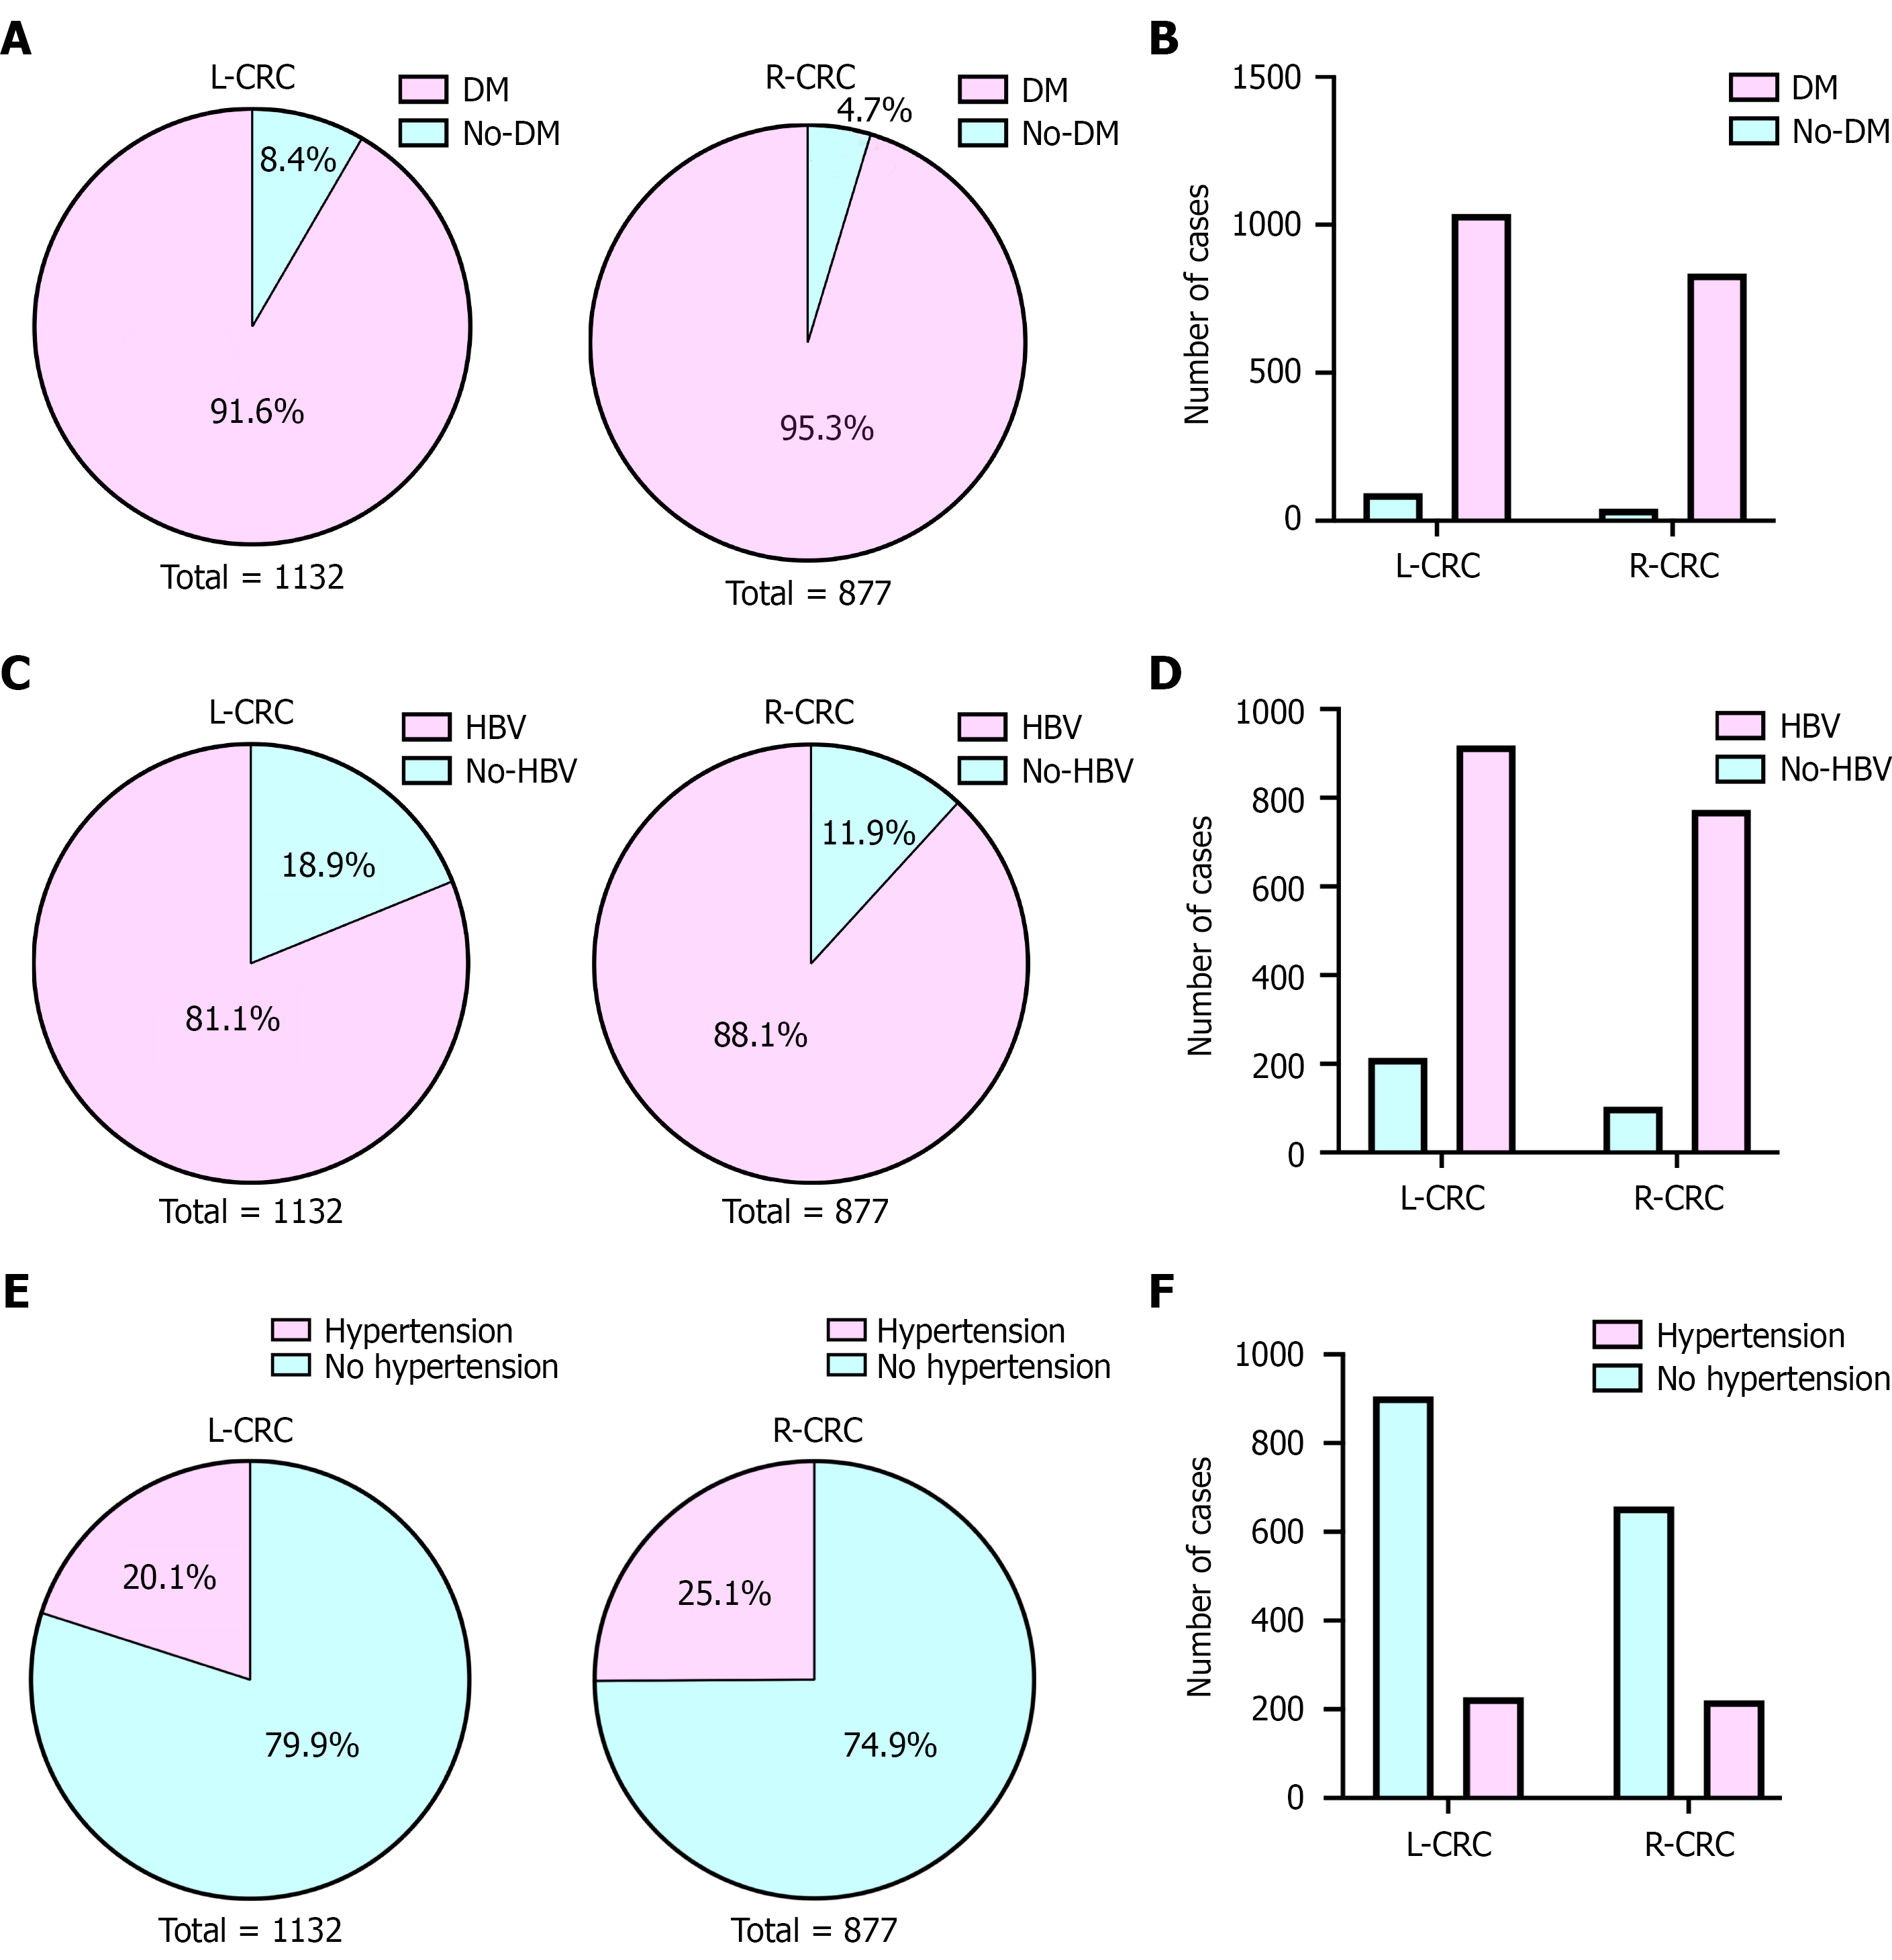
Figure 4 Comparison of comorbidities between left-sided colorectal cancer and right-sided colorectal cancer groups.
A: Pie charts showing the proportion of diabetes mellitus (DM) in left-sided colorectal cancer (L-CRC; total = 1132) and right-sided colorectal cancer (R-CRC; total = 877) groups; B: Bar plot comparing the number of cases with or without DM between the L-CRC and R-CRC groups. Data were analyzed using a χ2 test; C: Pie charts showing the proportion of hepatitis B virus (HBV) infection in L-CRC (total = 1132) and R-CRC (total = 877) groups; D: Bar plot comparing the number of cases with or without HBV infection between the L-CRC and R-CRC groups. Data were analyzed using a χ2 test; E: Pie charts showing the proportion of hypertension in L-CRC (total = 1132) and R-CRC (total = 877) groups; F: Bar plot comparing the number of cases with or without hypertension between the L-CRC and R-CRC groups. Data were analyzed using a χ2 test. All data are presented as percentages or case numbers. P < 0.001 for all comparisons. L-CRC: Left-sided colorectal cancer; R-CRC: Right-sided colorectal cancer; DM: Diabetes mellitus; HBV: Hepatitis B virus.
- Citation: Lai Y, Ye YF, Lin Y, Yu YF, Chen QK. Retrospective analysis of risk factors for left-sided vs right-sided colon cancer in a southern Chinese Han population. World J Gastrointest Oncol 2026; 18(9): 121675
- URL: https://www.wjgnet.com/1948-5204/full/v18/i9/121675.htm
- DOI: https://dx.doi.org/10.4251/wjgo.121675