
















Copyright: ©Author(s) 2026.
World J Gastrointest Oncol. Nov 15, 2026; 18(11): 124022
Published online Nov 15, 2026. doi: 10.4251/wjgo.124022
Published online Nov 15, 2026. doi: 10.4251/wjgo.124022
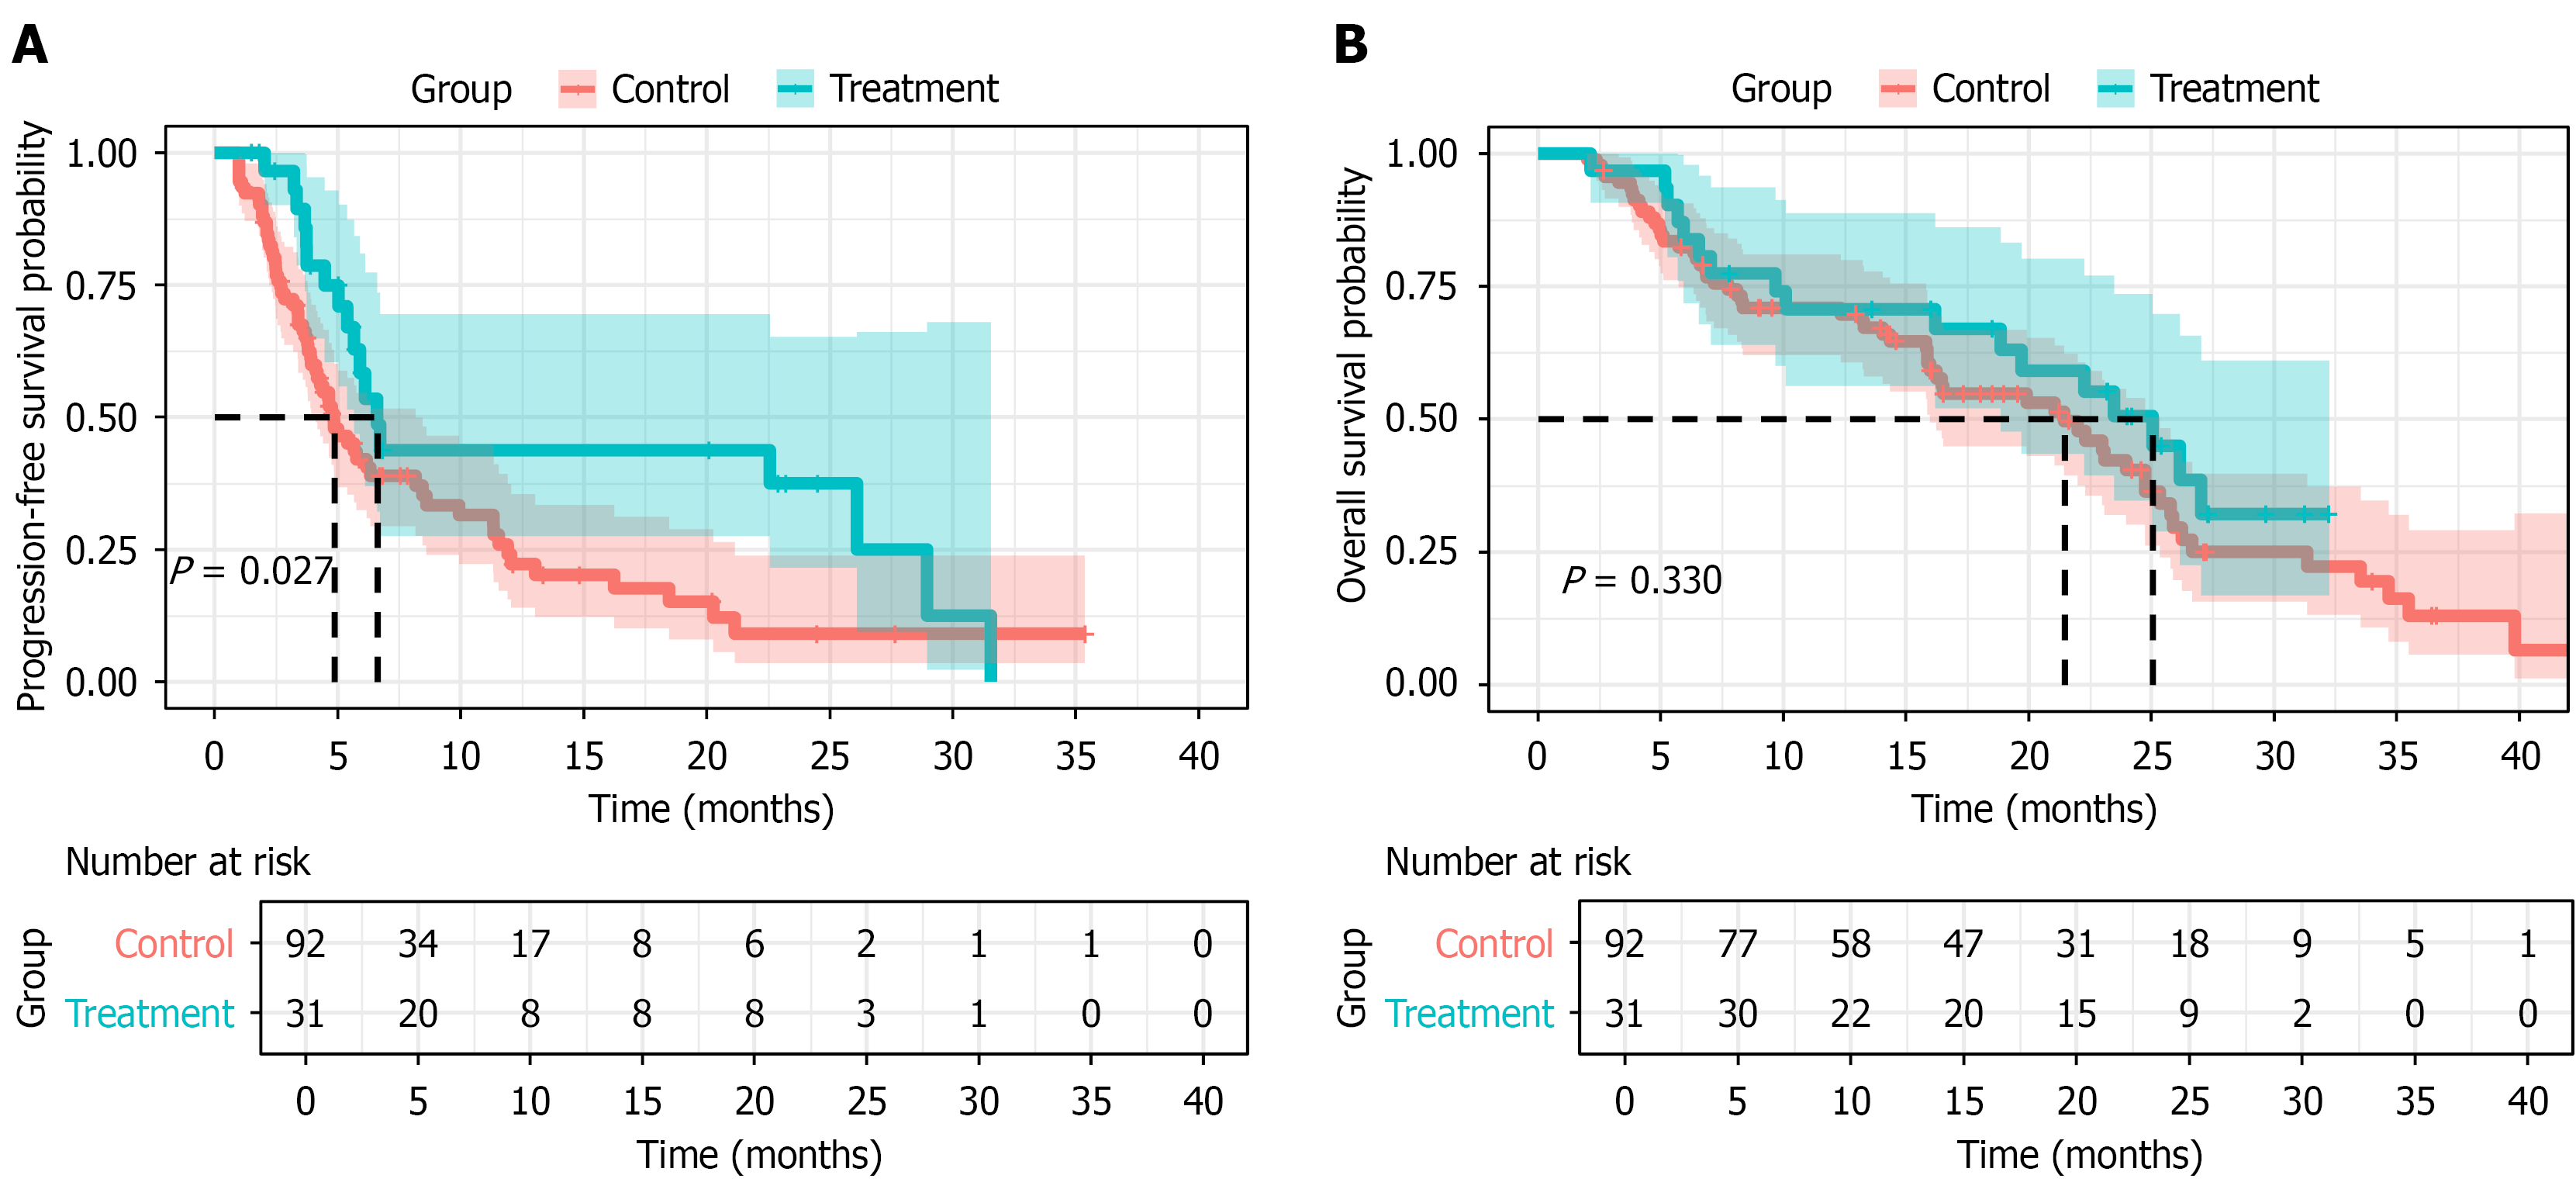
Figure 1 Kaplan-Meier curves for progression-free survival and overall survival before propensity score matching.
A: Progression-free survival; B: Overall survival.
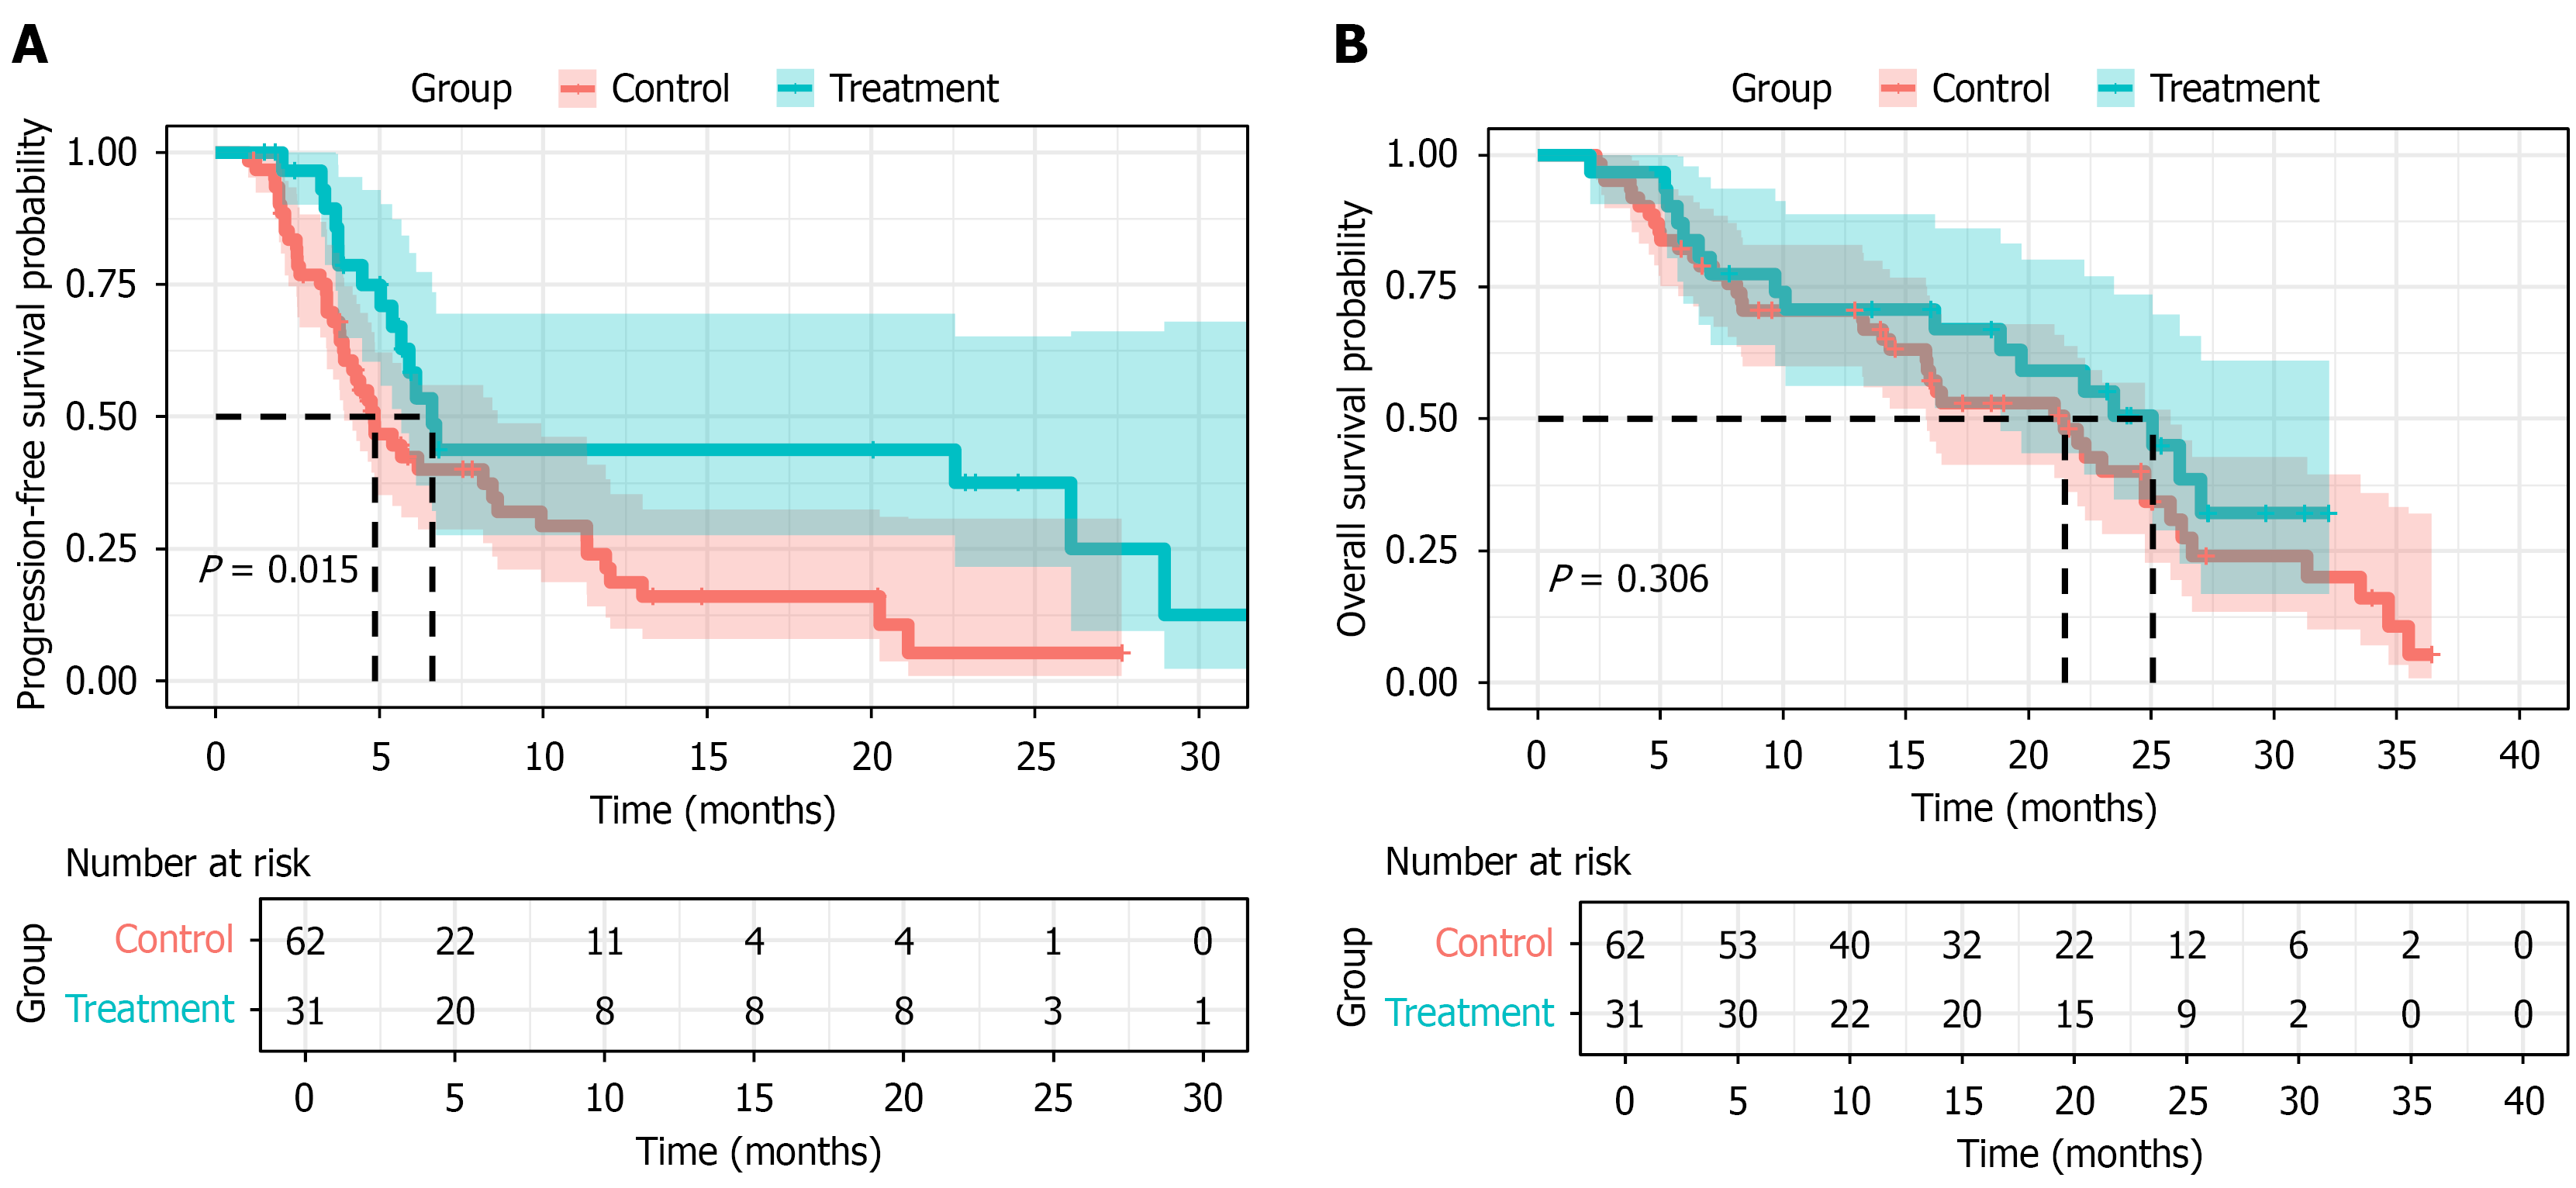
Figure 2 Kaplan-Meier curves for progression-free survival and overall survival after propensity score matching.
A: Progression-free survival; B: Overall survival.
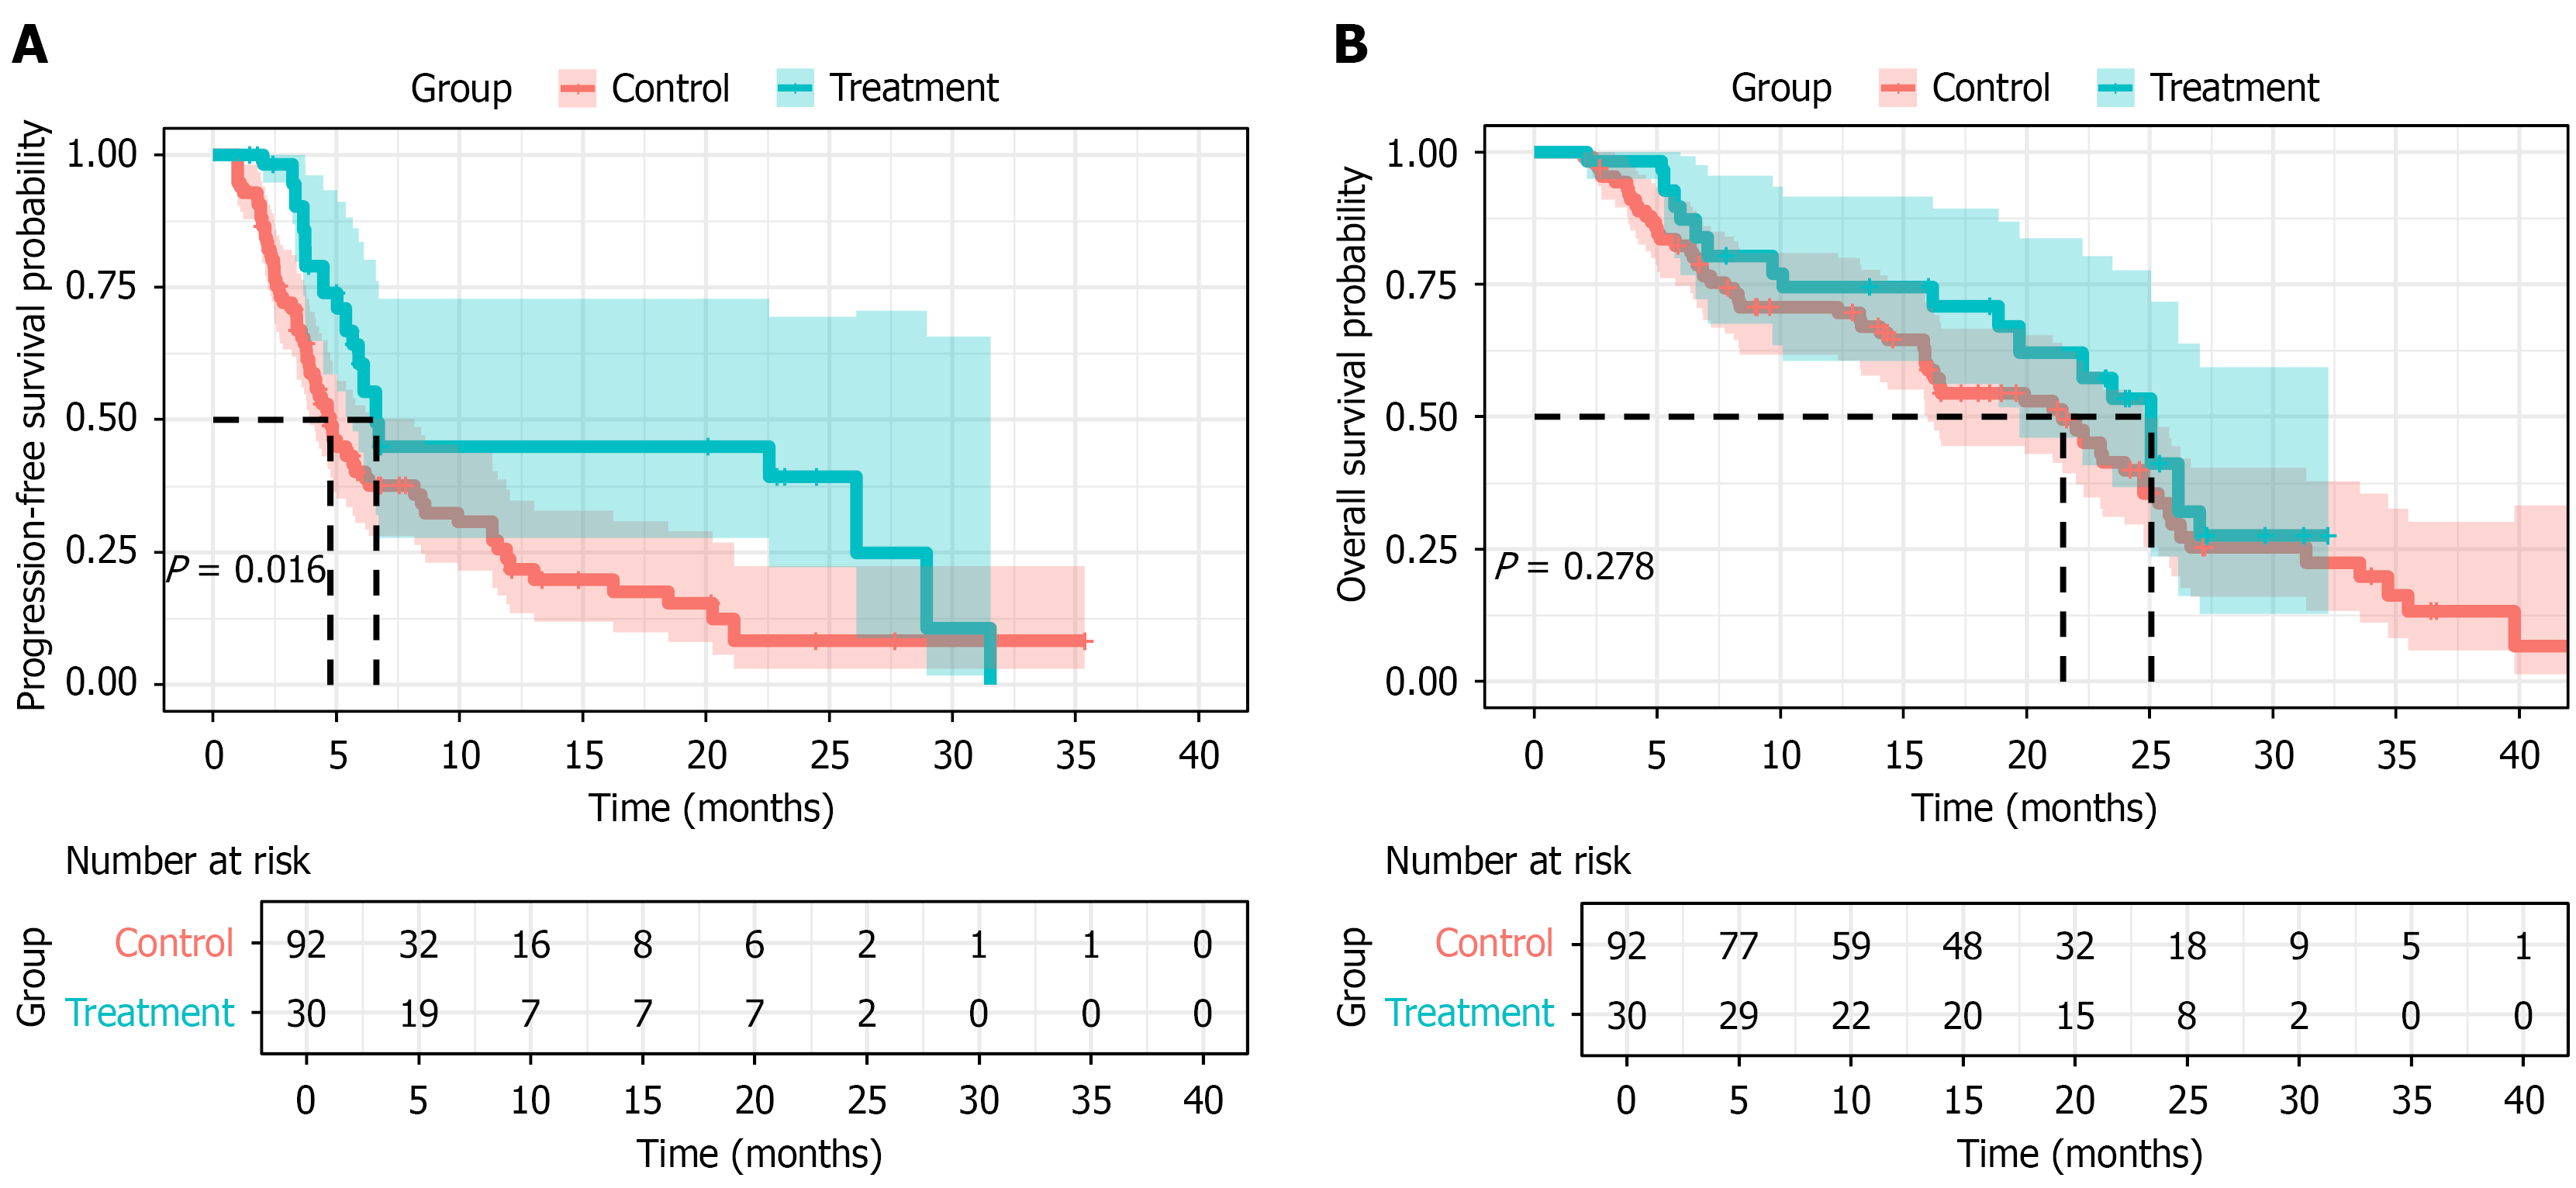
Figure 3 Survival analysis after inverse probability of treatment weighting.
A: Progression-free survival comparison between treatment groups after inverse probability of treatment weighting adjustment; B: Overall survival comparison after inverse probability of treatment weighting. Weighted Cox regression analysis was used to estimate hazard ratios.
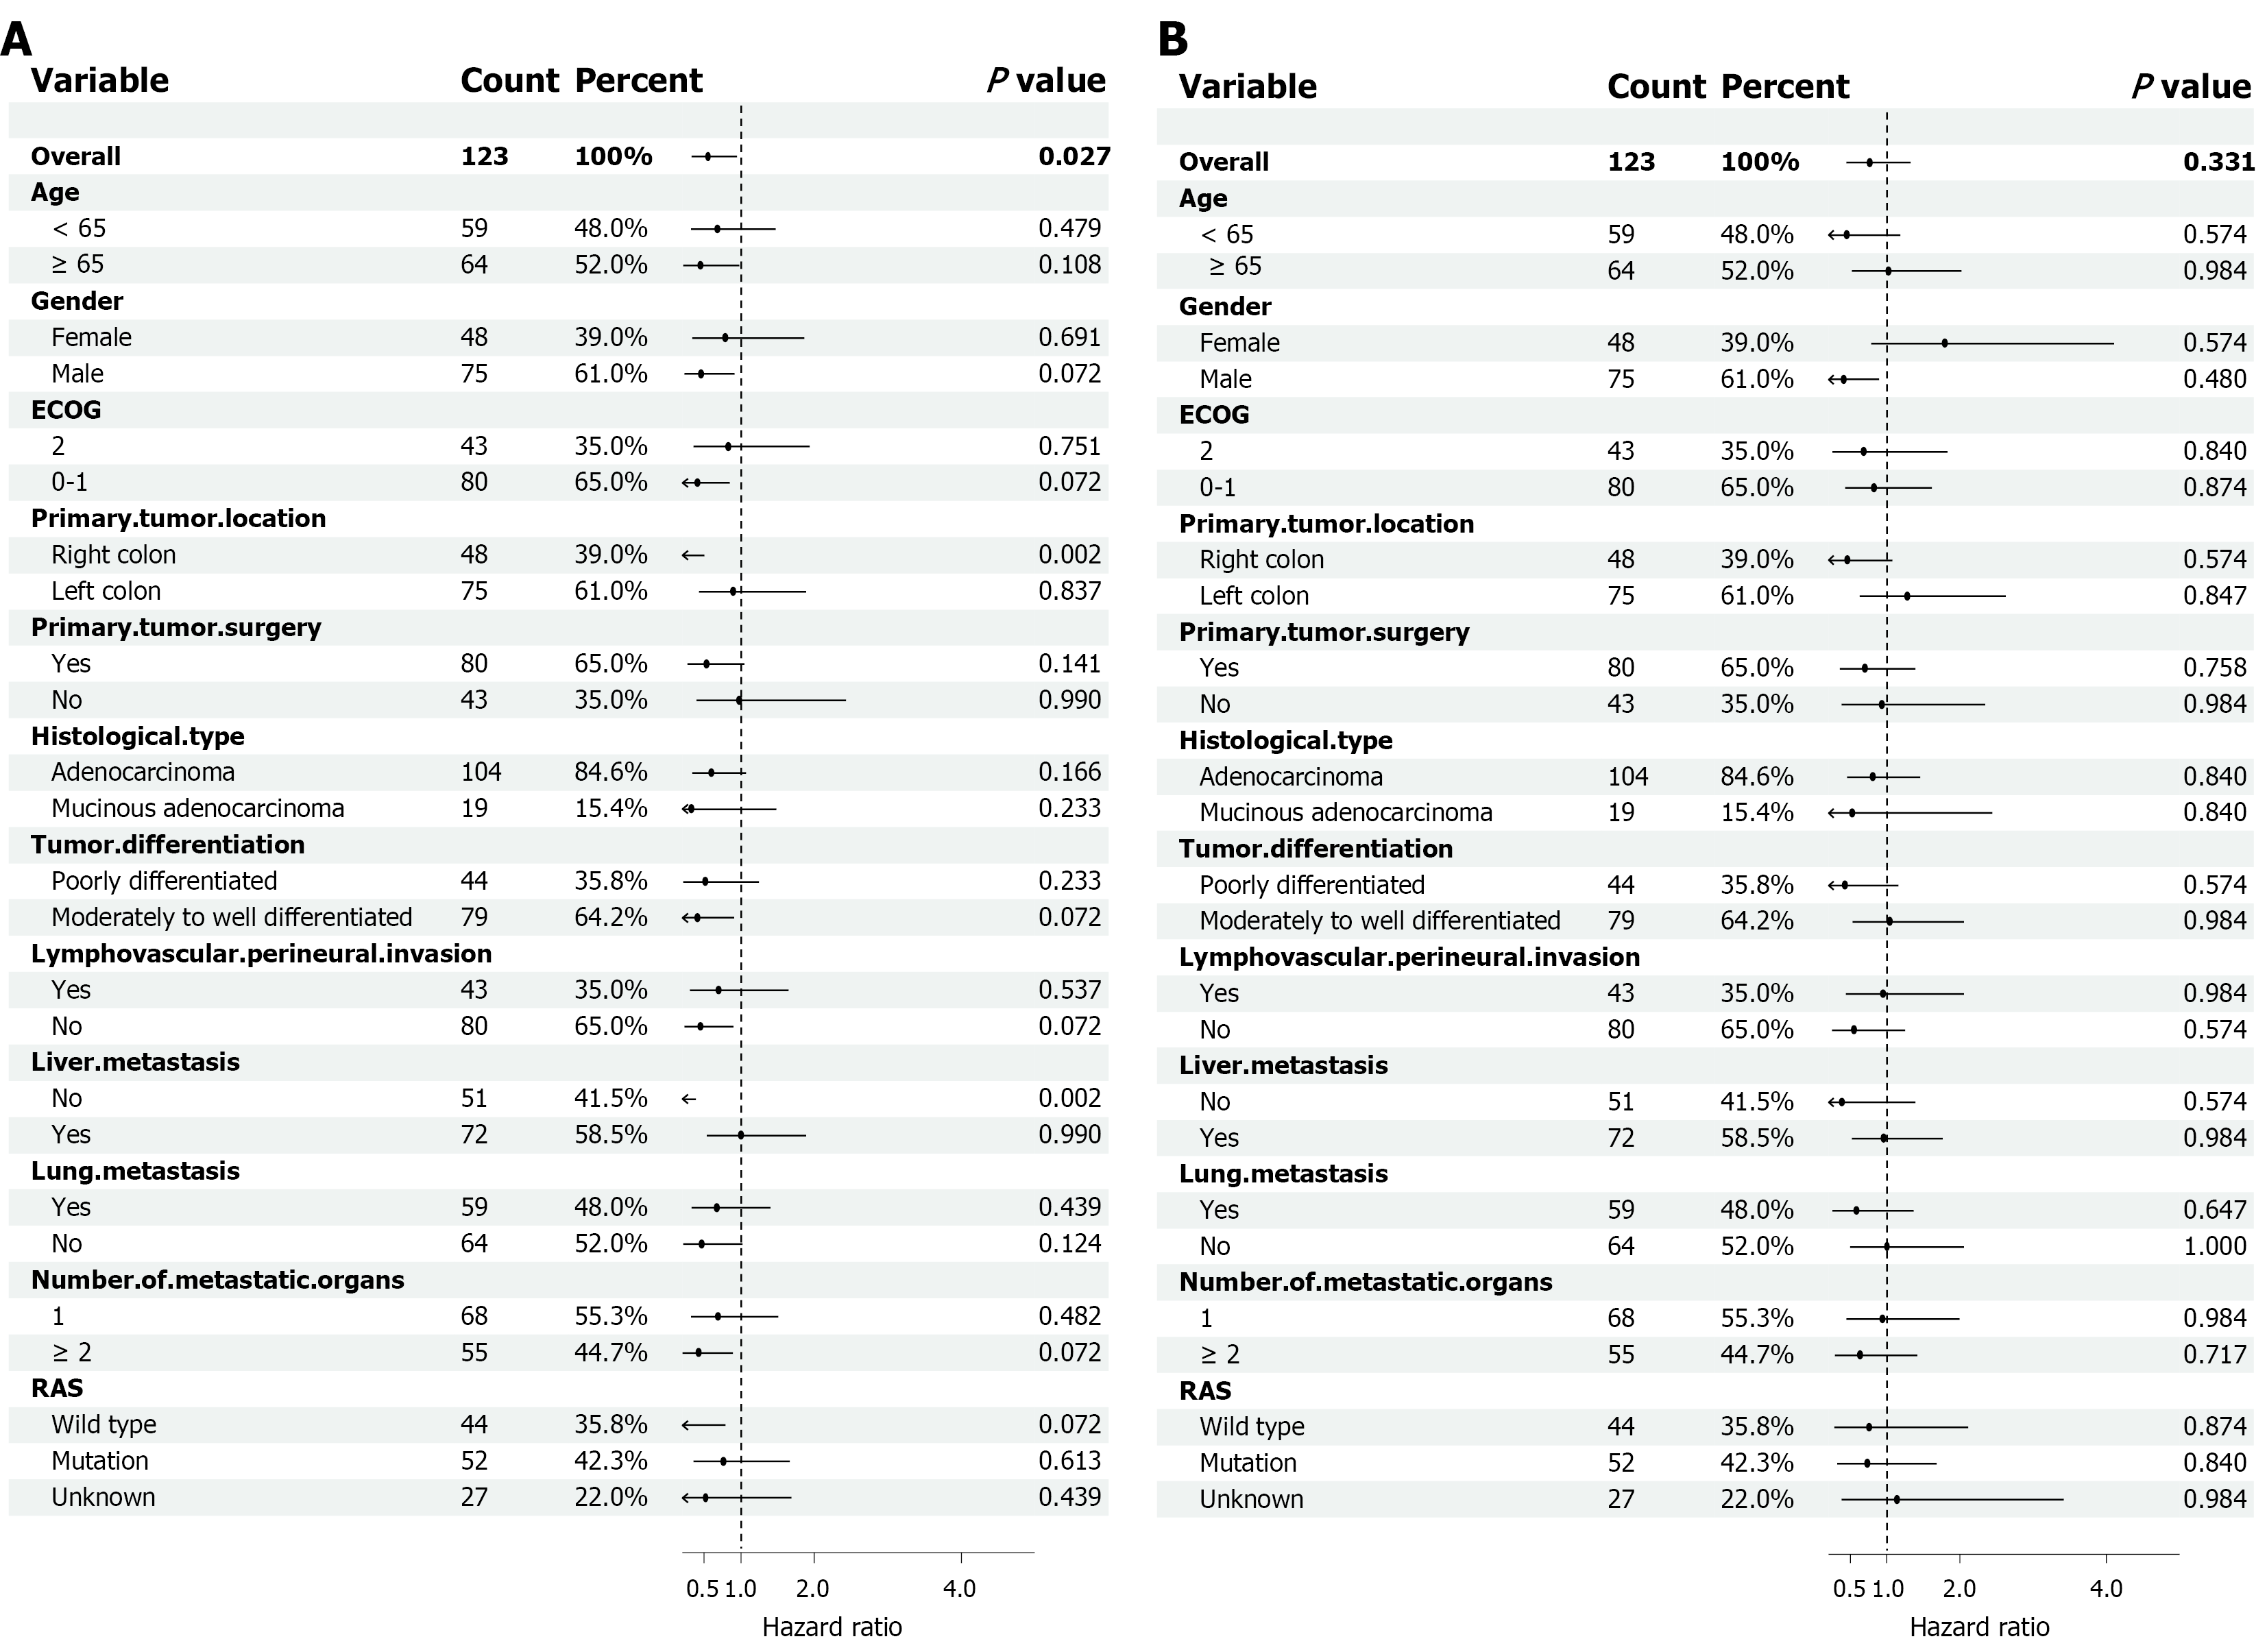
Figure 4 Exploratory subgroup analyses of treatment effects on progression-free survival and overall survival.
A: Progression-free survival; B: Overall survival. P values were adjusted using the Benjamini-Hochberg method. Formal interaction tests were not statistically significant, and subgroup findings should be interpreted as exploratory. ECOG: Eastern Cooperative Oncology Group.
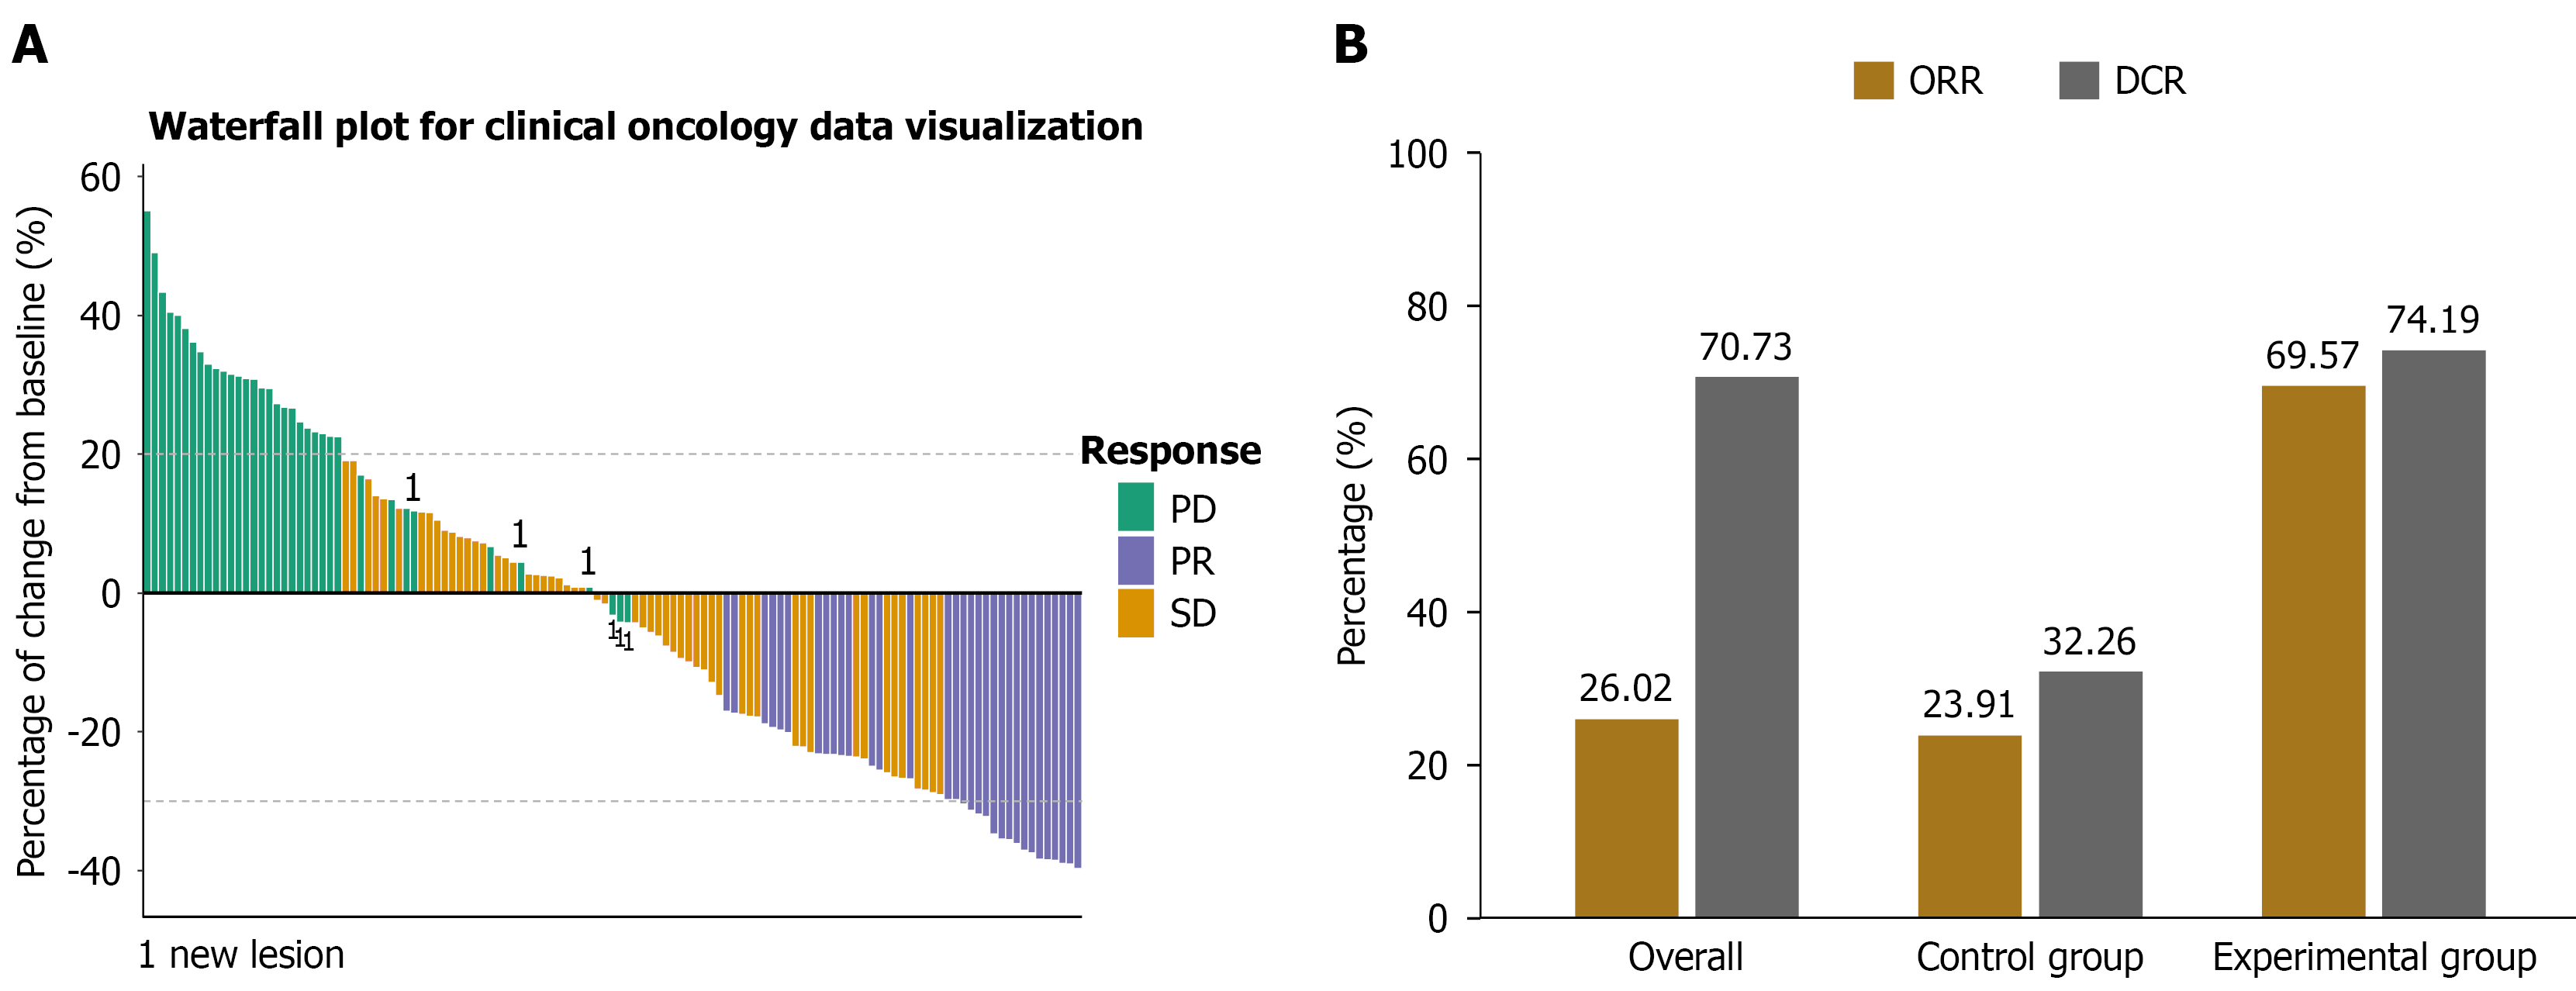
Figure 5 Tumor response evaluation.
A: Waterfall plot showing the maximum percentage change in target lesion size for each patient according to RECIST 1.1 criteria; B: Bar chart comparing objective response rate and disease control rate between the two groups. ORR: Objective response rate; DCR: Disease control rate; PD: Progressive disease; PR: Partial response; SD: Stable disease.
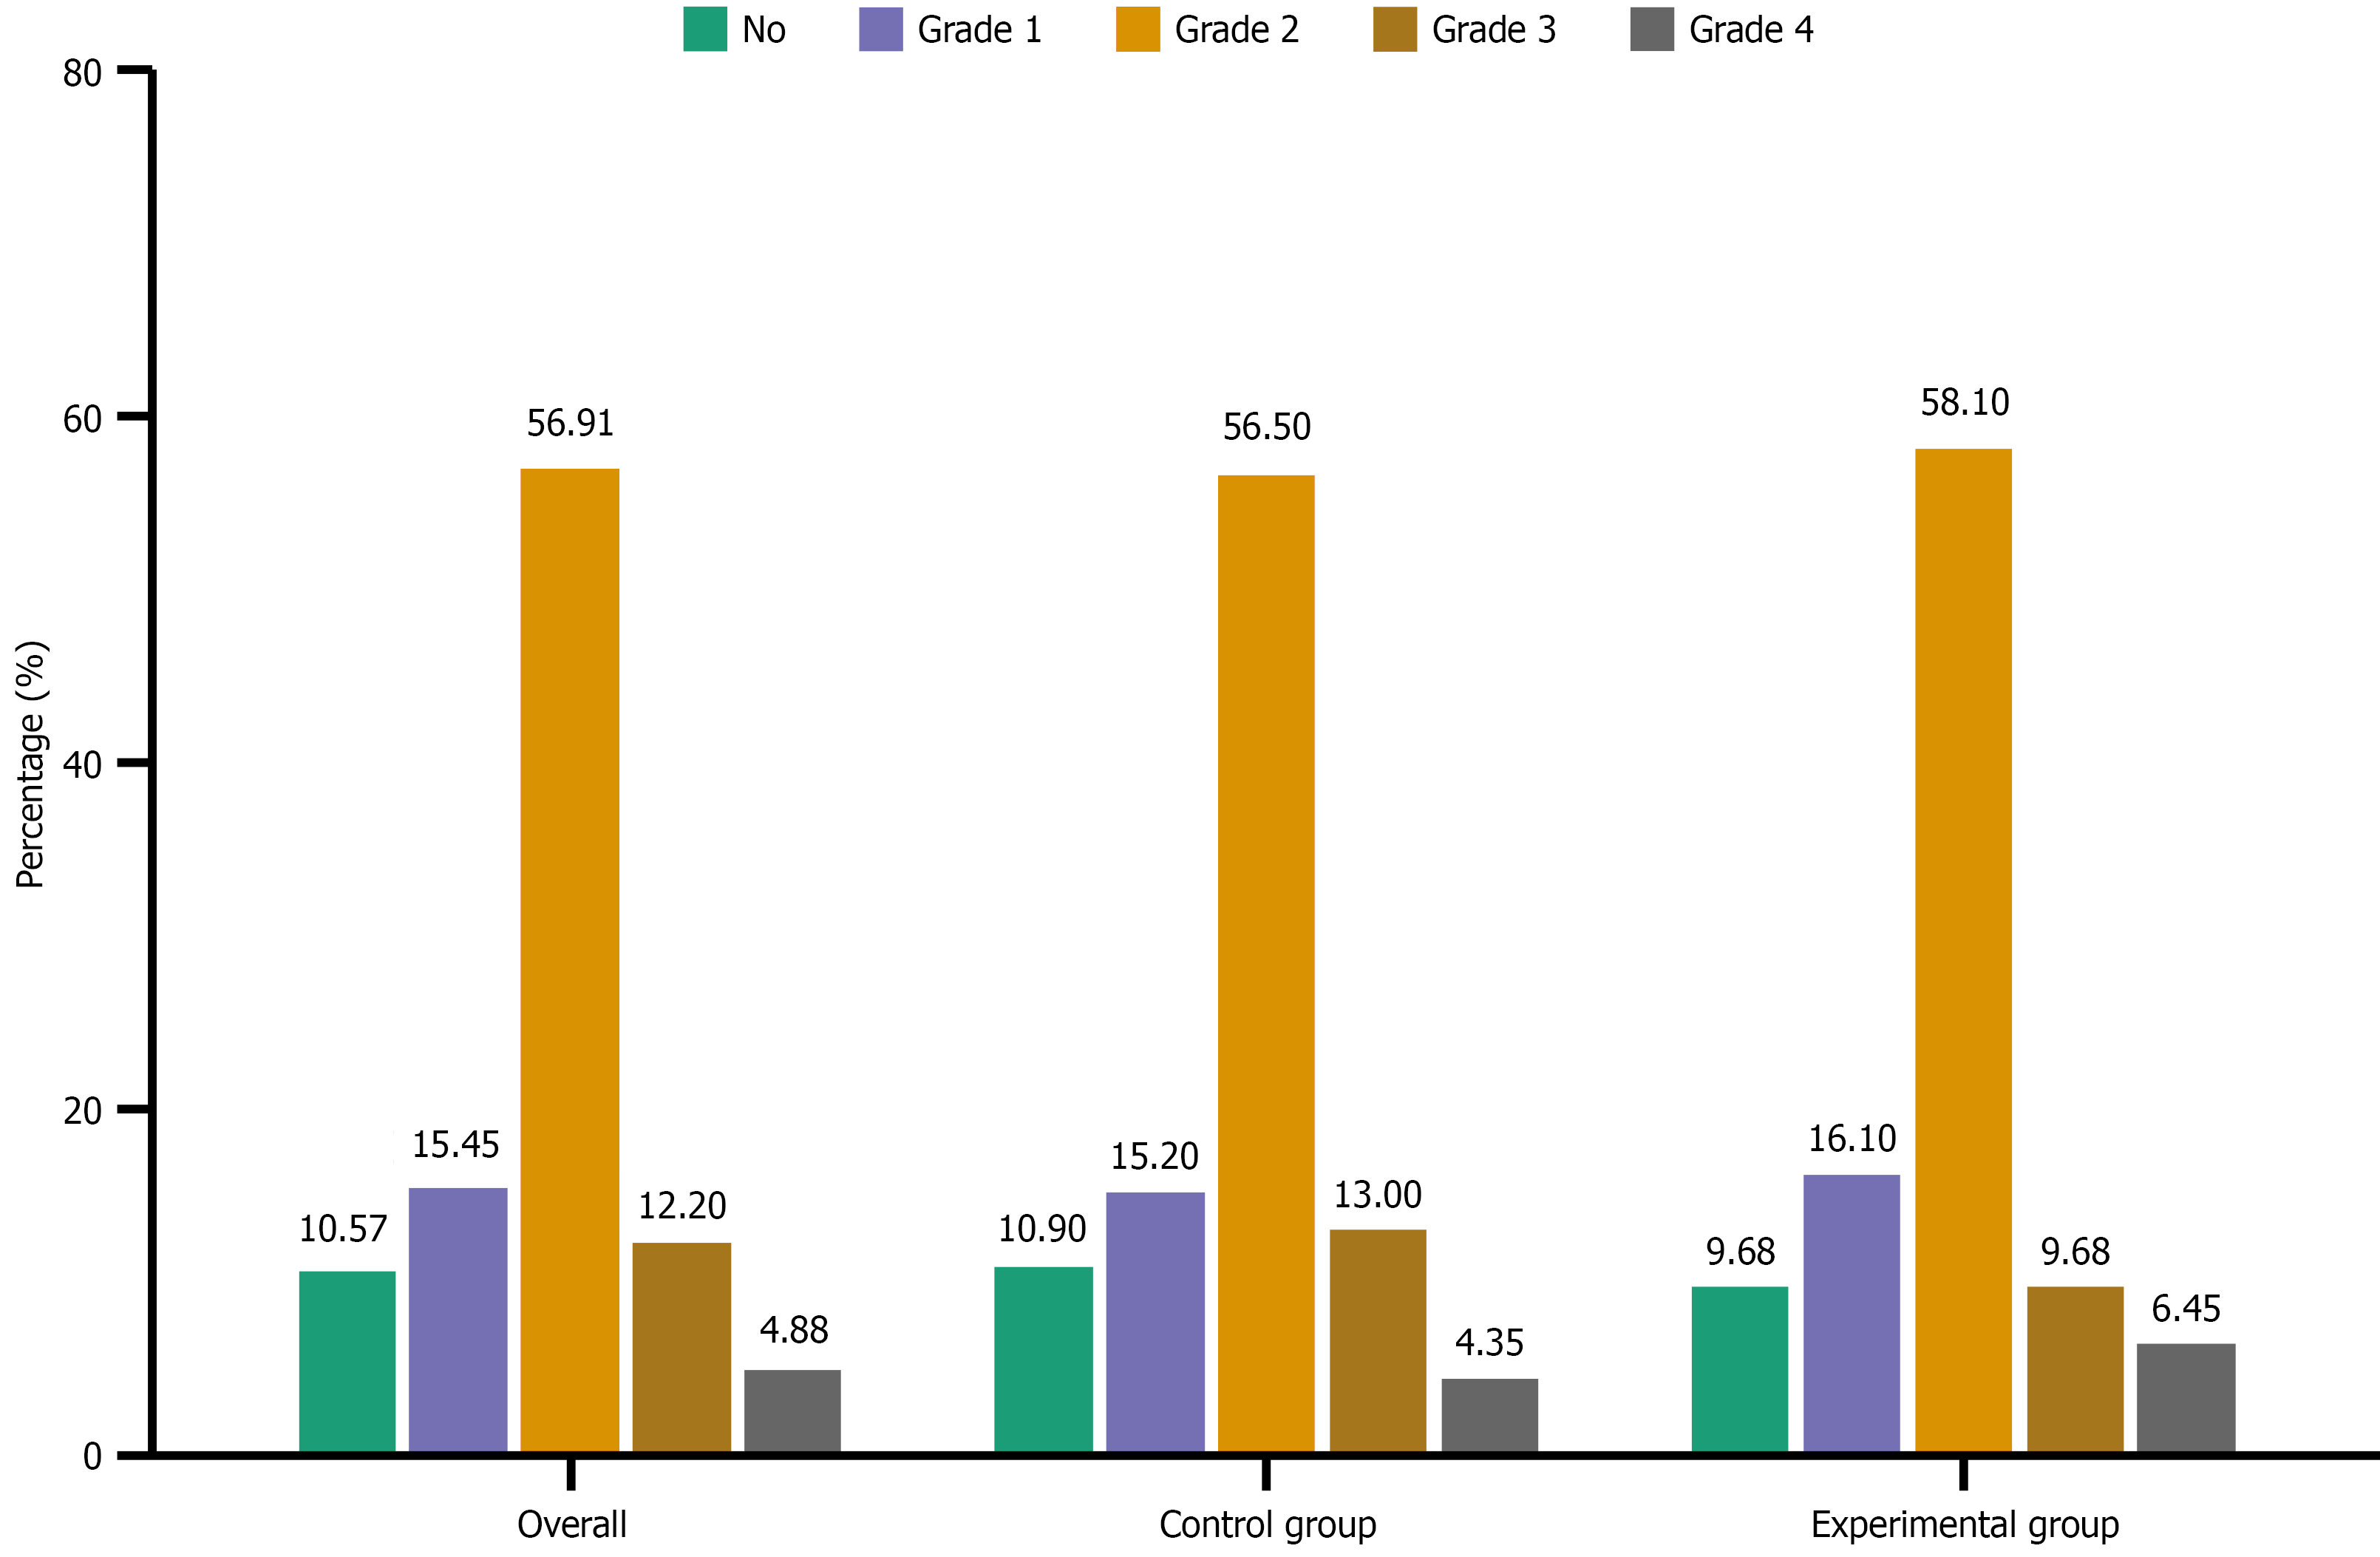
Figure 6 Adverse events and safety profile.
Distribution of treatment-related adverse events by grade in the control and experimental groups. Most adverse events were grade 1-2, with comparable incidence of grade ≥ 3 events between groups.
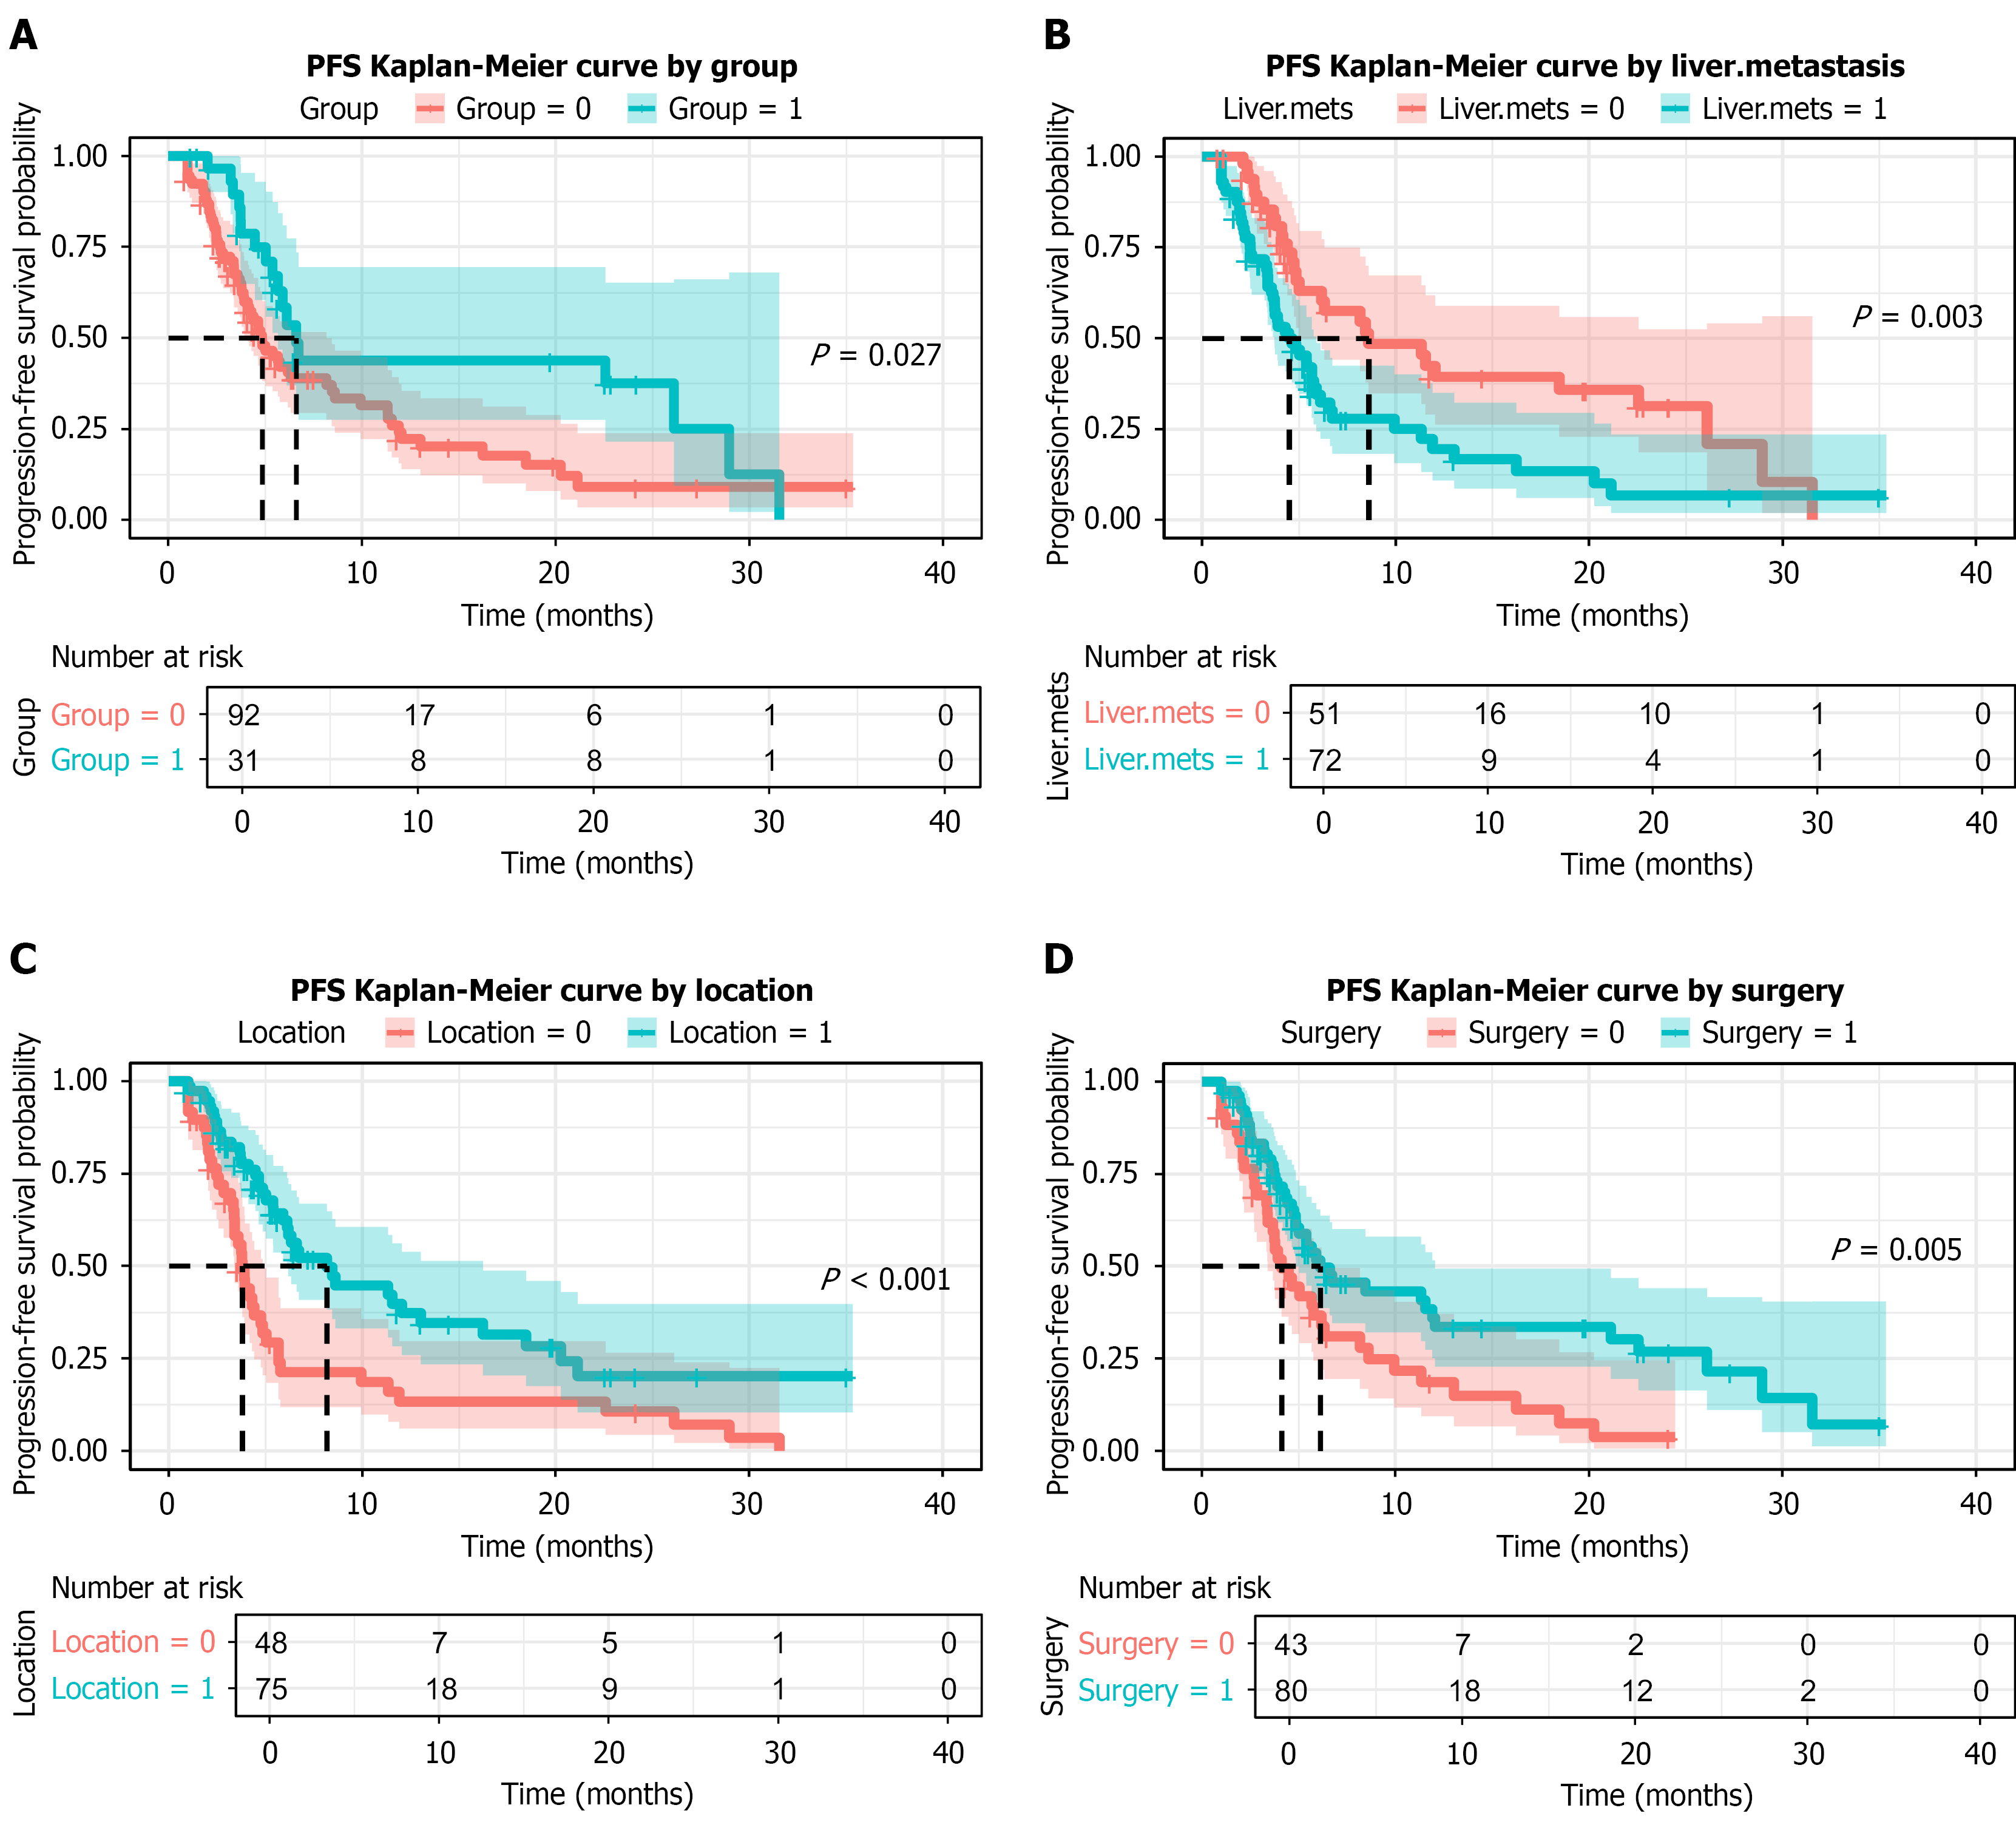
Figure 7 Kaplan-Meier survival curves for key prognostic factors.
A: Treatment group; B: Liver metastasis status; C: Primary tumor location; D: Primary tumor resection. PFS: Progression-free survival.
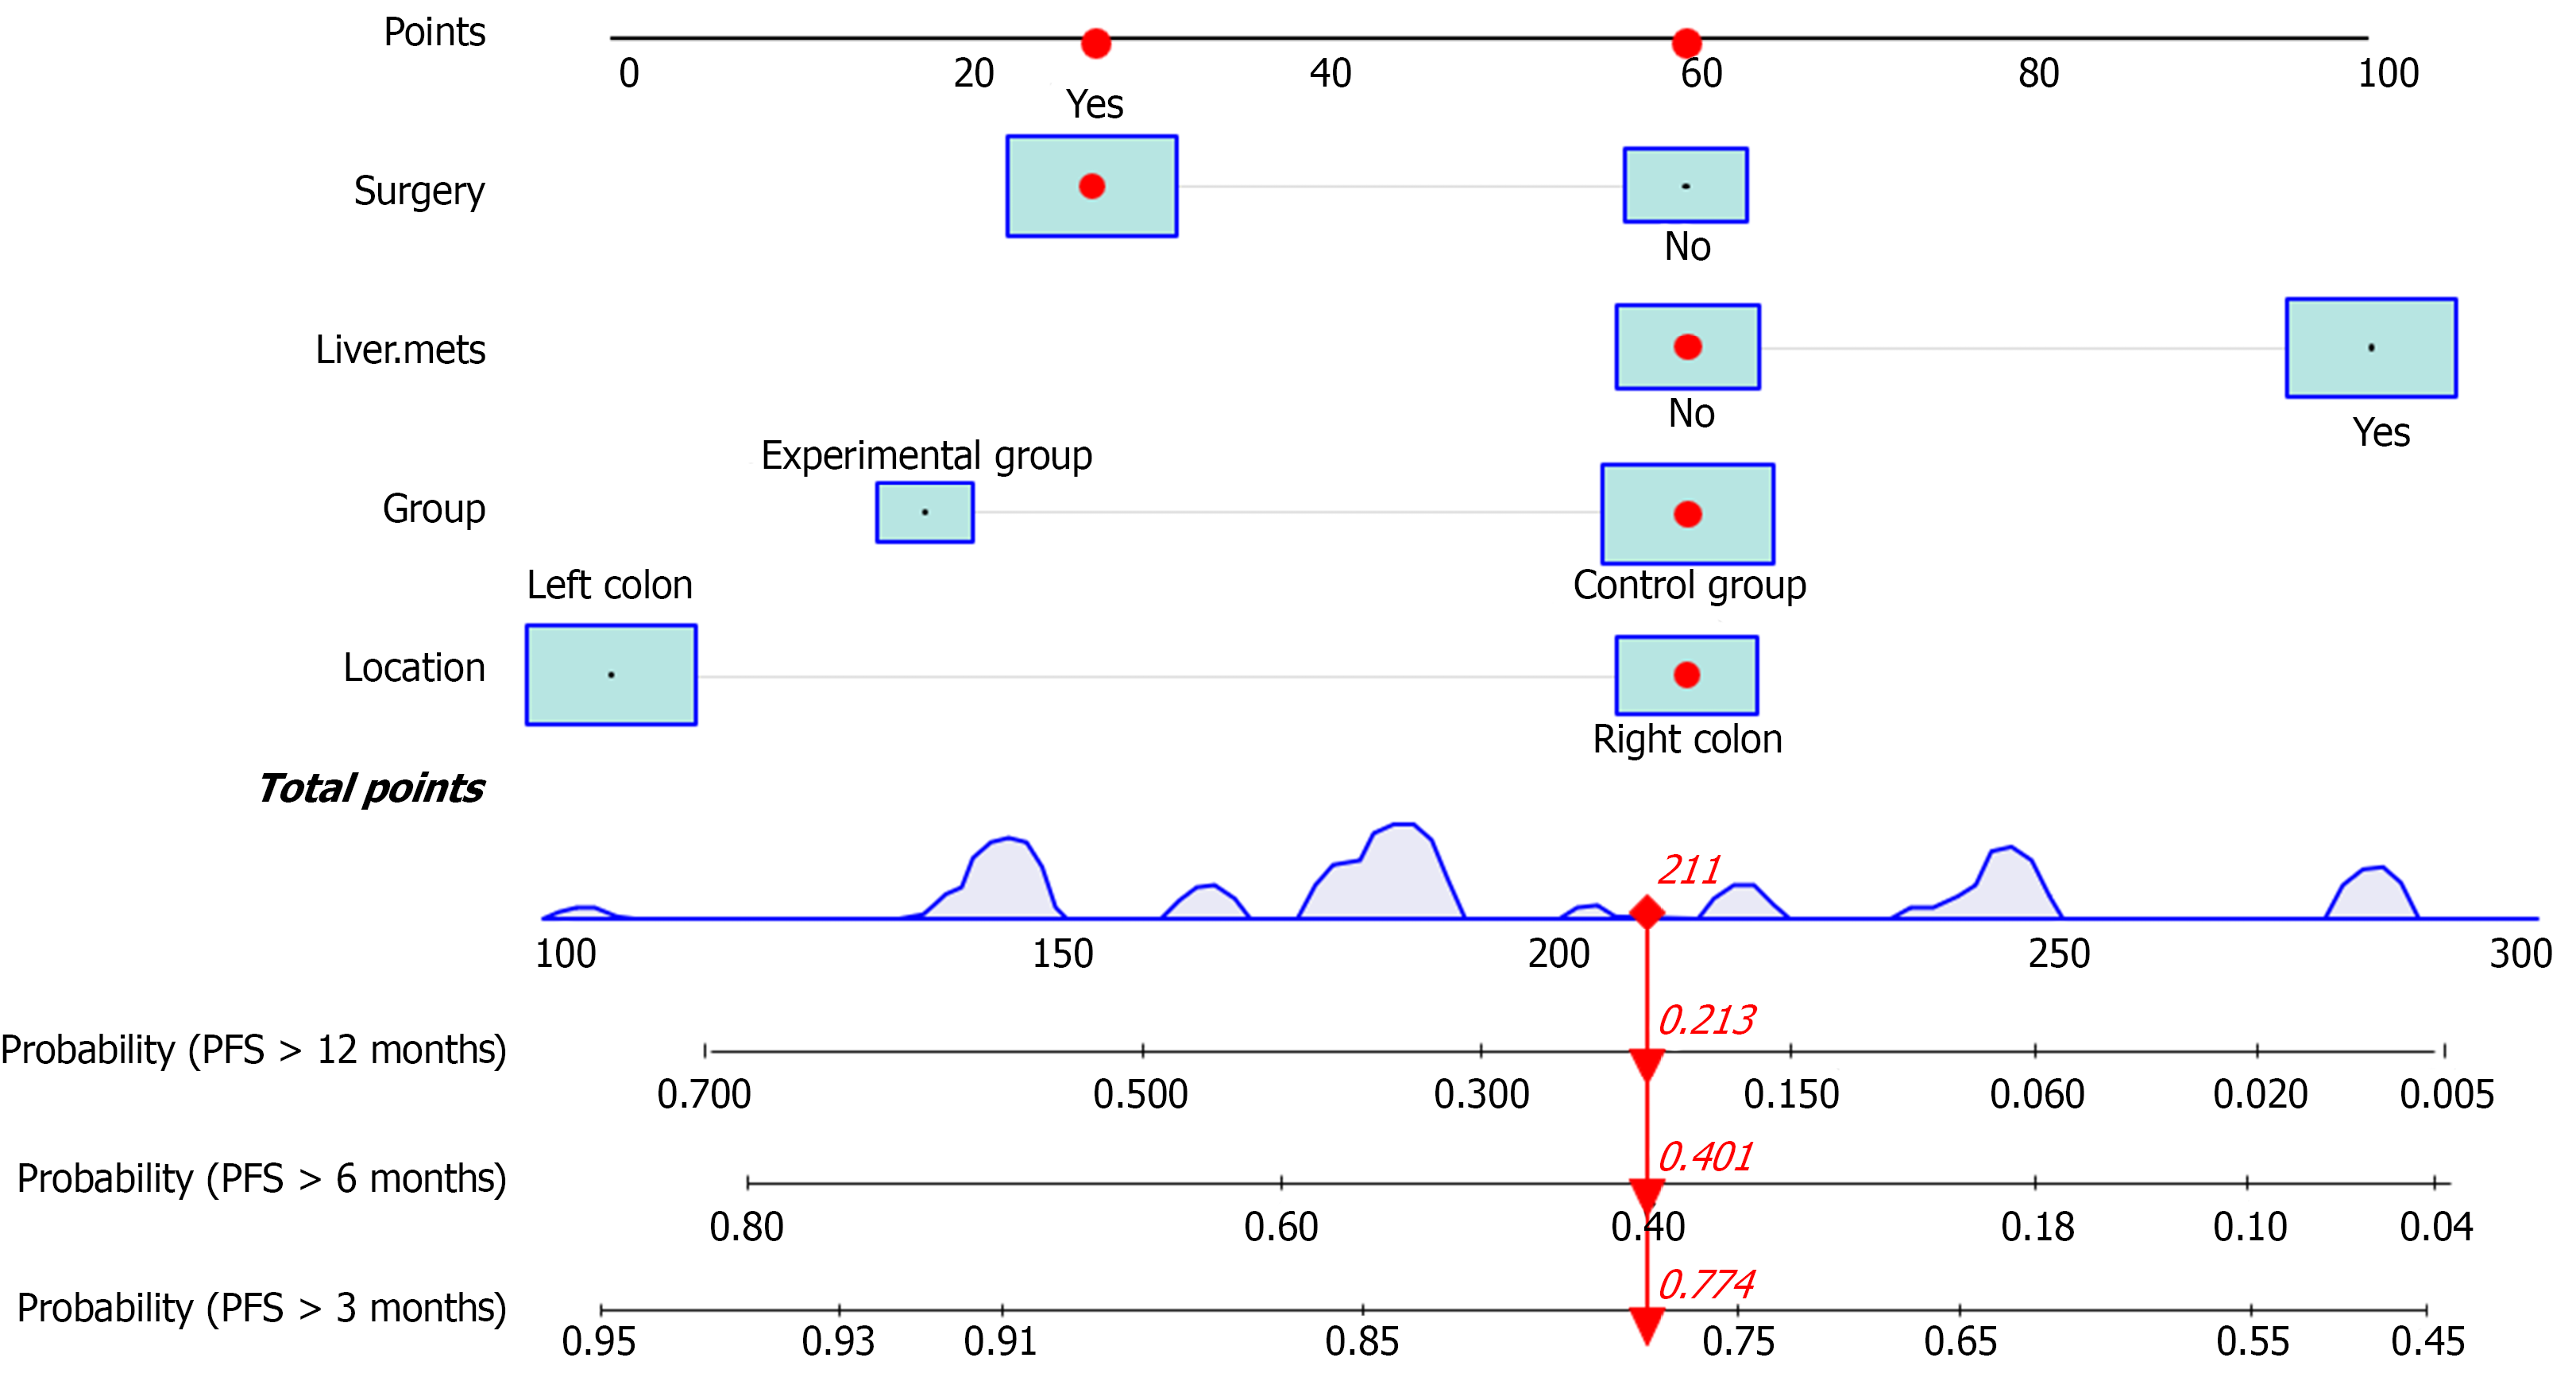
Figure 8 Nomogram for predicting progression-free survival.
The nomogram was constructed based on independent prognostic factors to predict 3-, 6-, and 12-month progression-free survival probabilities. PFS: Progression-free survival.
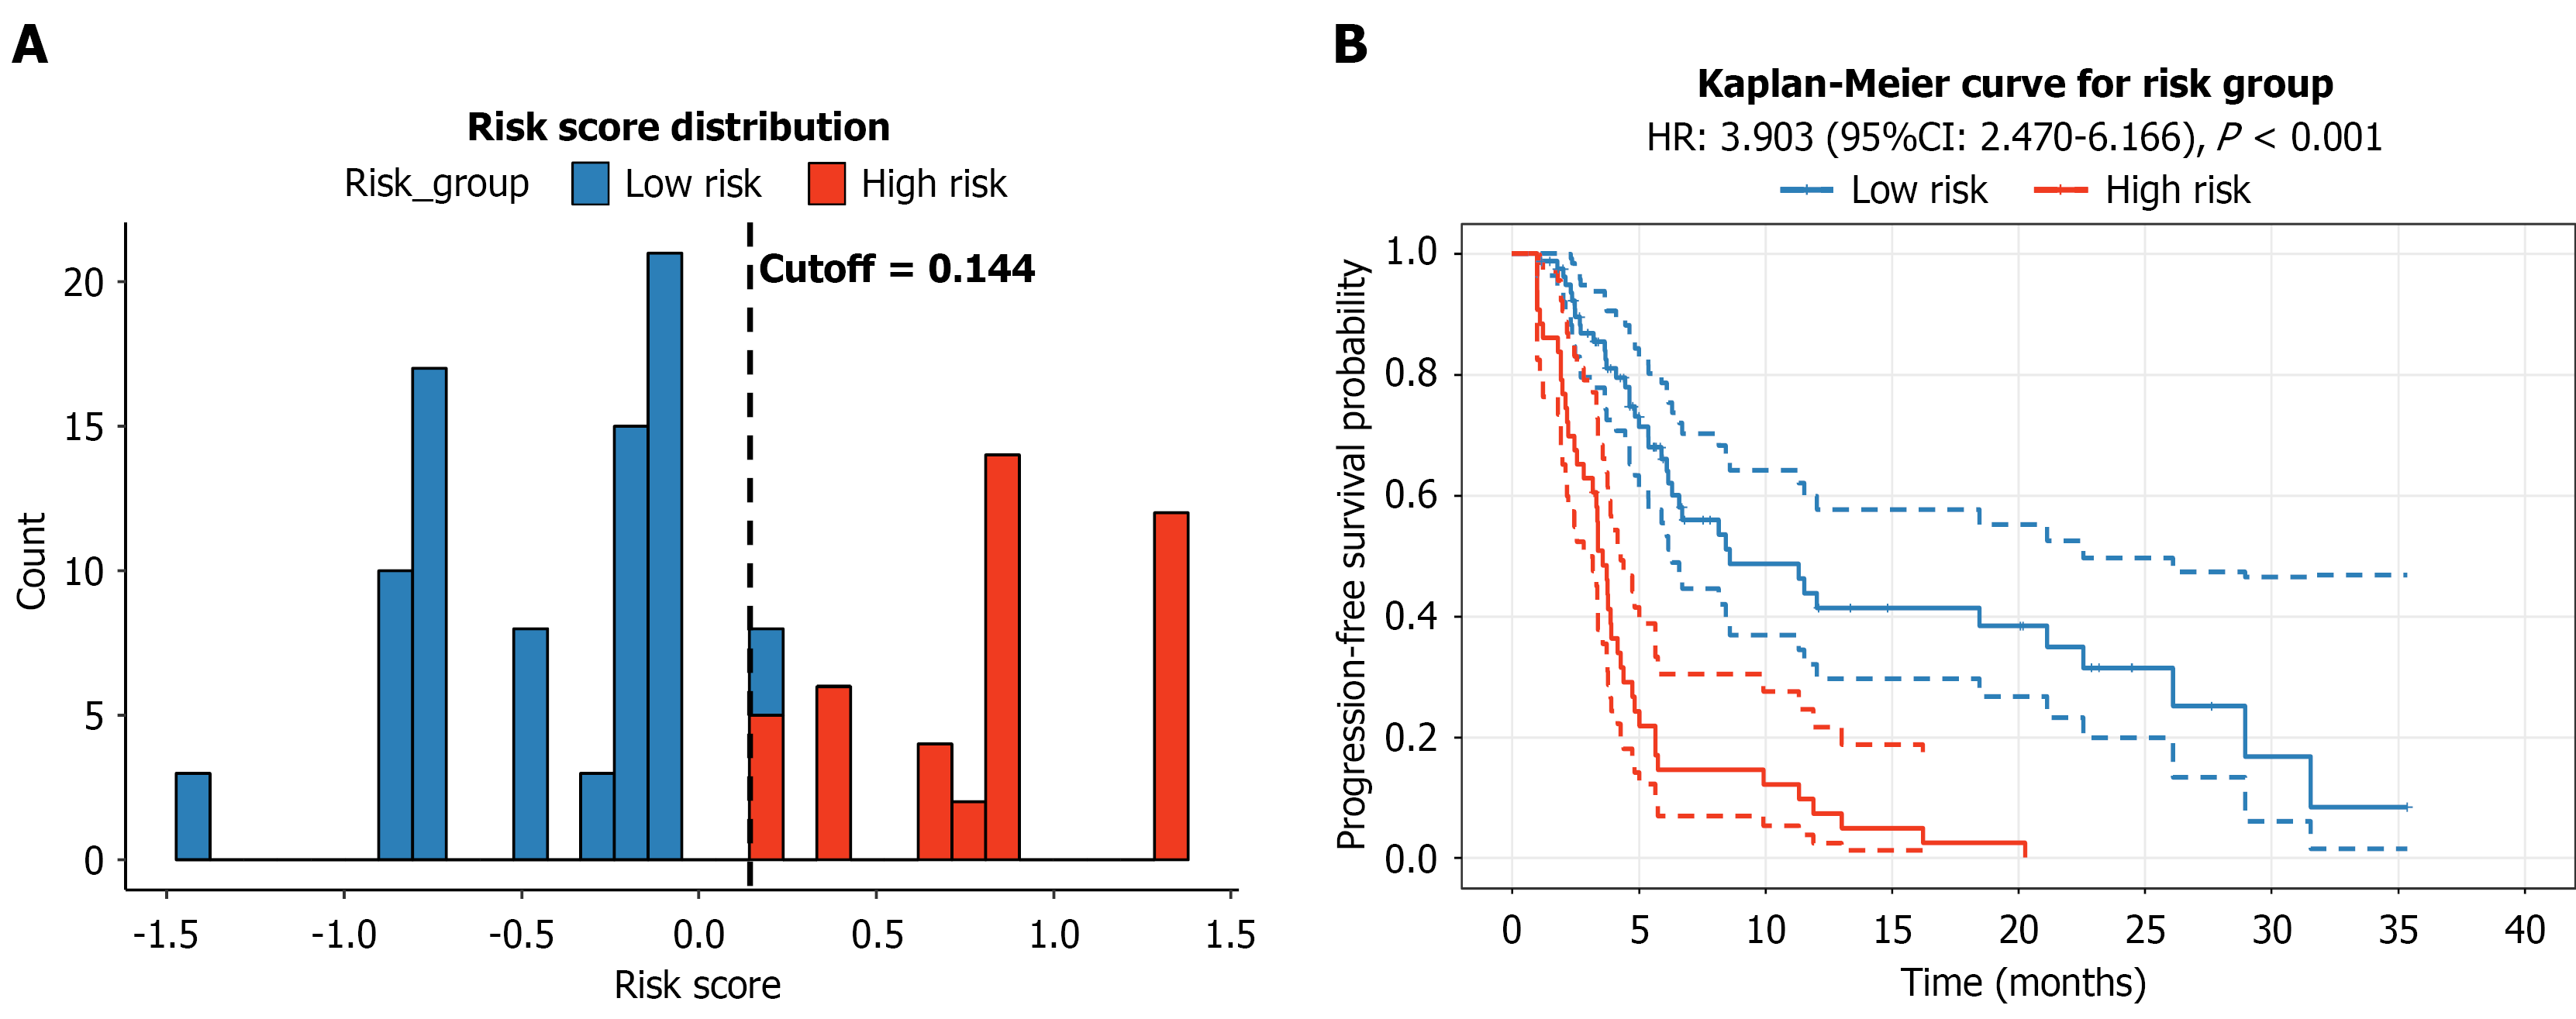
Figure 9 Risk stratification based on the nomogram.
A: Distribution of risk scores and optimal cutoff value; B: Kaplan-Meier curves comparing progression-free survival between low-risk and high-risk groups. HR: Hazard ratio; CI: Confidence interval.
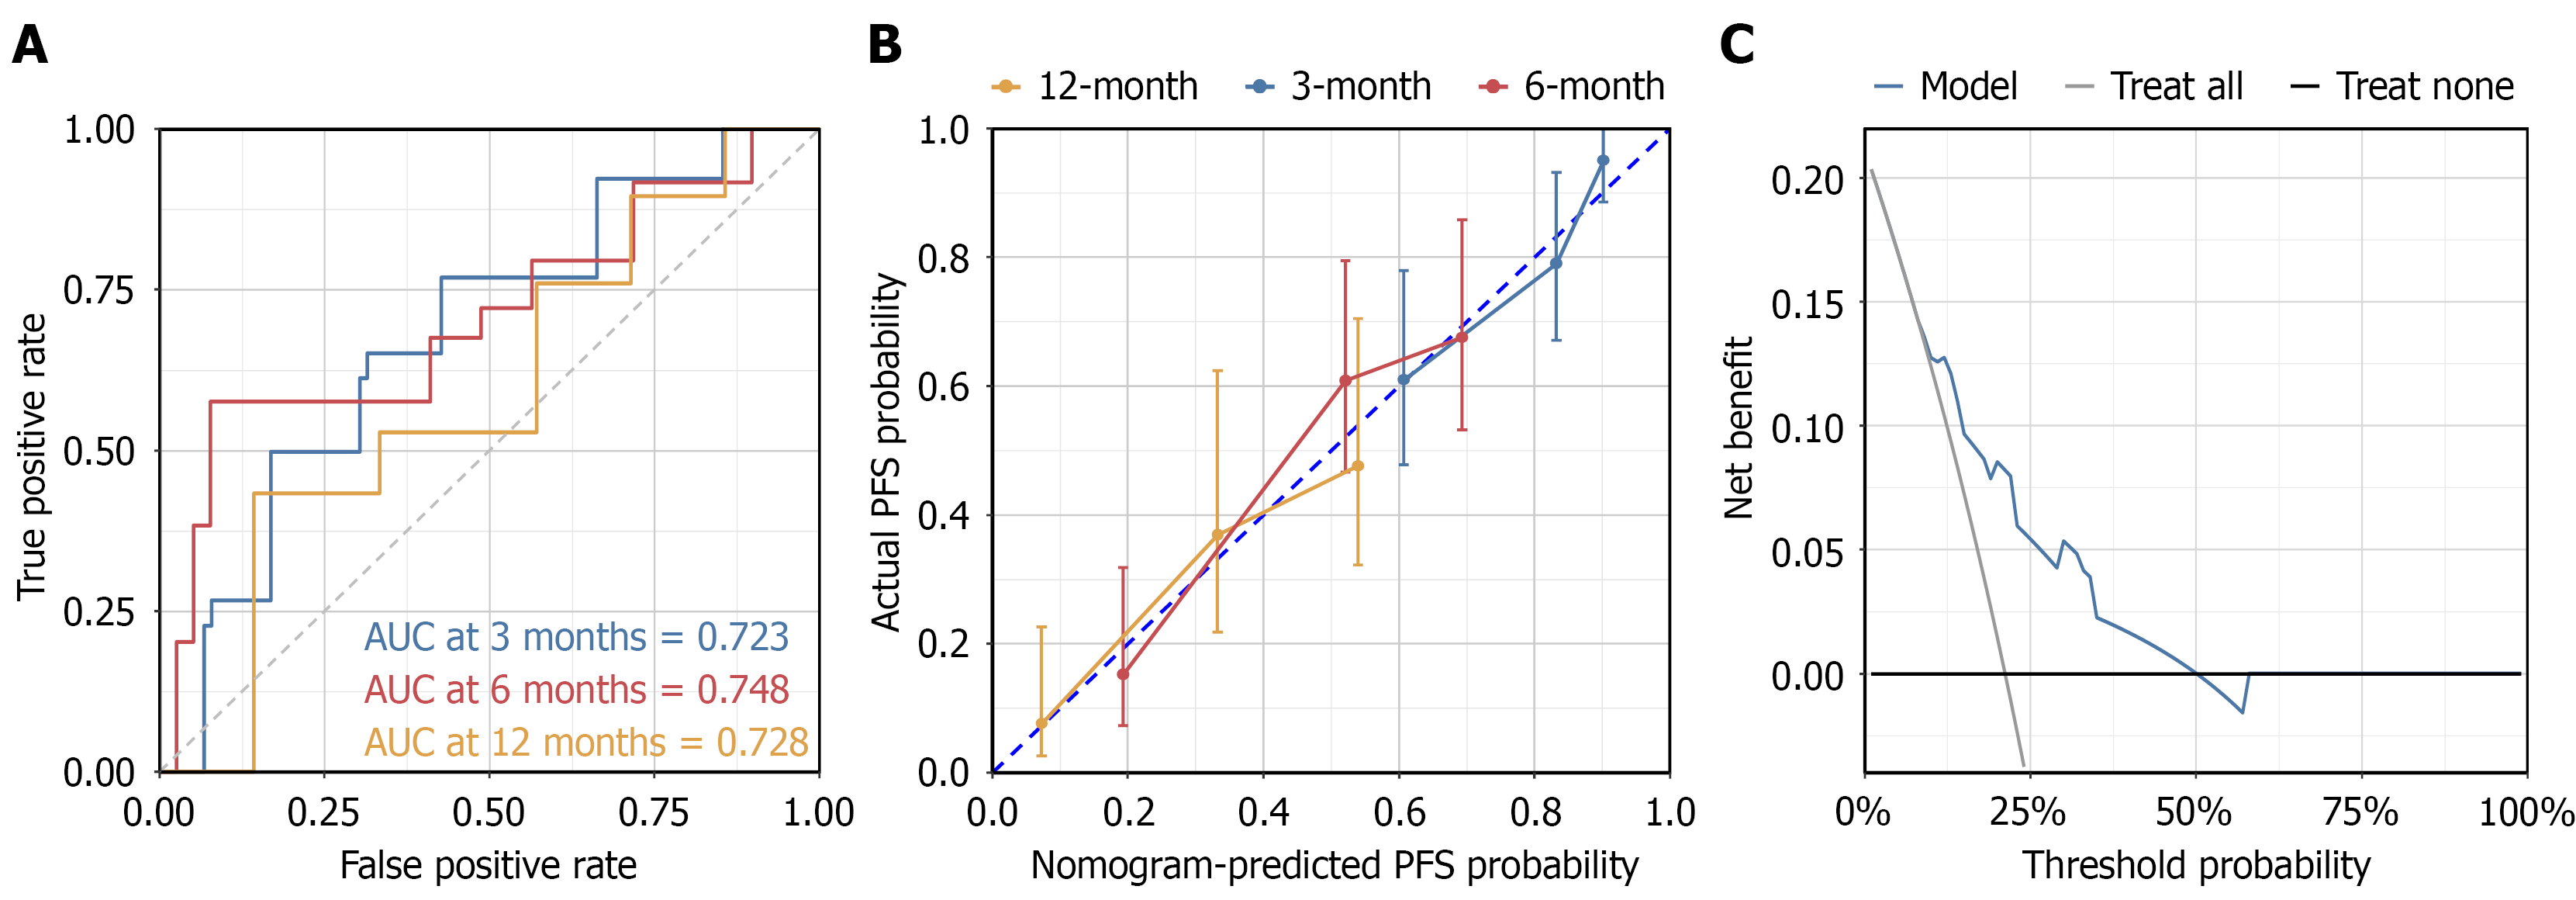
Figure 10 Internal validation of the exploratory nomogram.
A: Receiver operating characteristic curves for predicting 3-, 6-, and 12-month progression-free survival; B: Calibration curves showing agreement between predicted and observed probabilities; C: Decision-curve analysis suggesting potential clinical net benefit. AUC: Area under the curve; PFS: Progression-free survival.
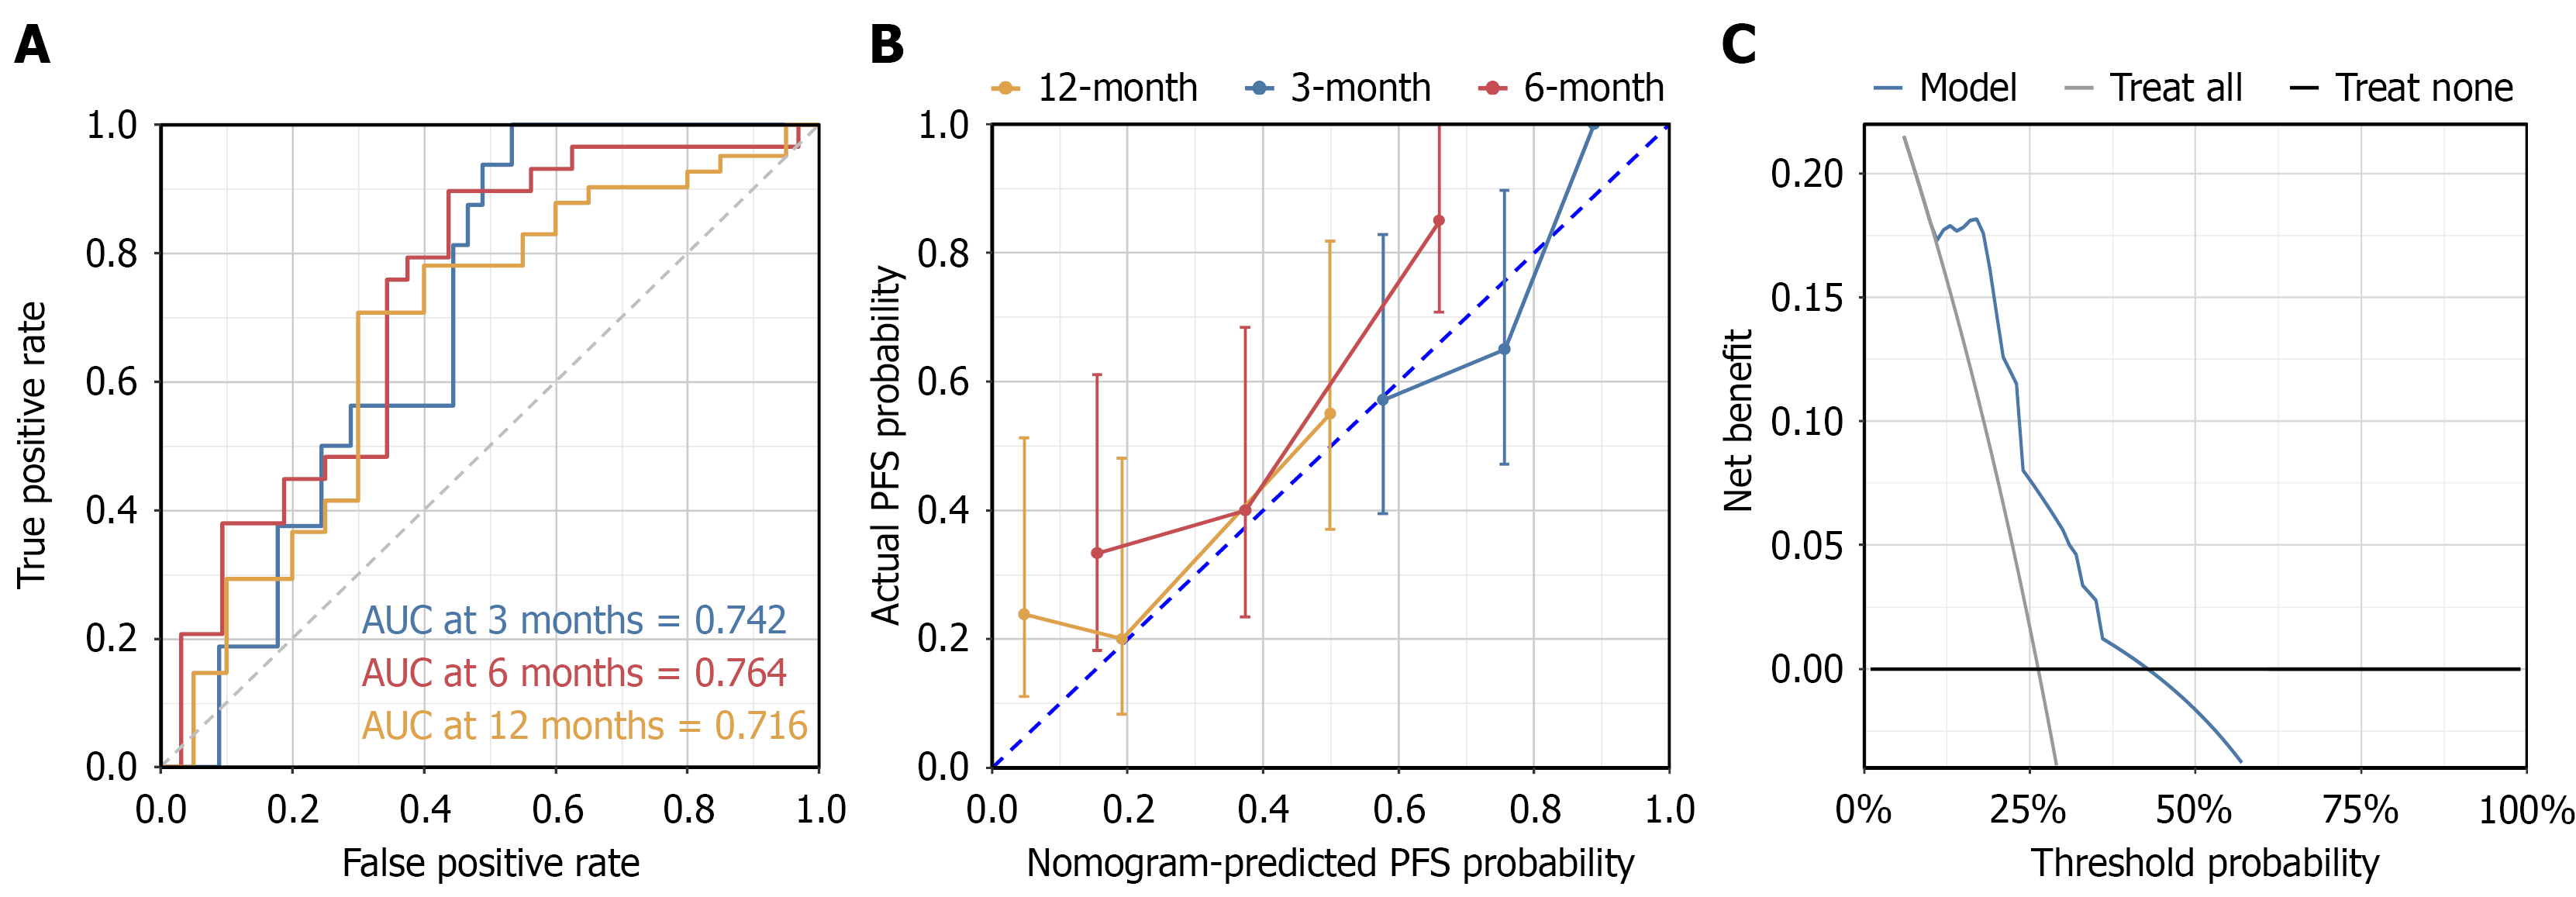
Figure 11 Temporal validation of the exploratory nomogram.
A: Receiver operating characteristic curves in the temporal validation cohort; B: Calibration curves; C: Decision-curve analysis suggesting potential clinical net benefit. AUC: Area under the curve; PFS: Progression-free survival.
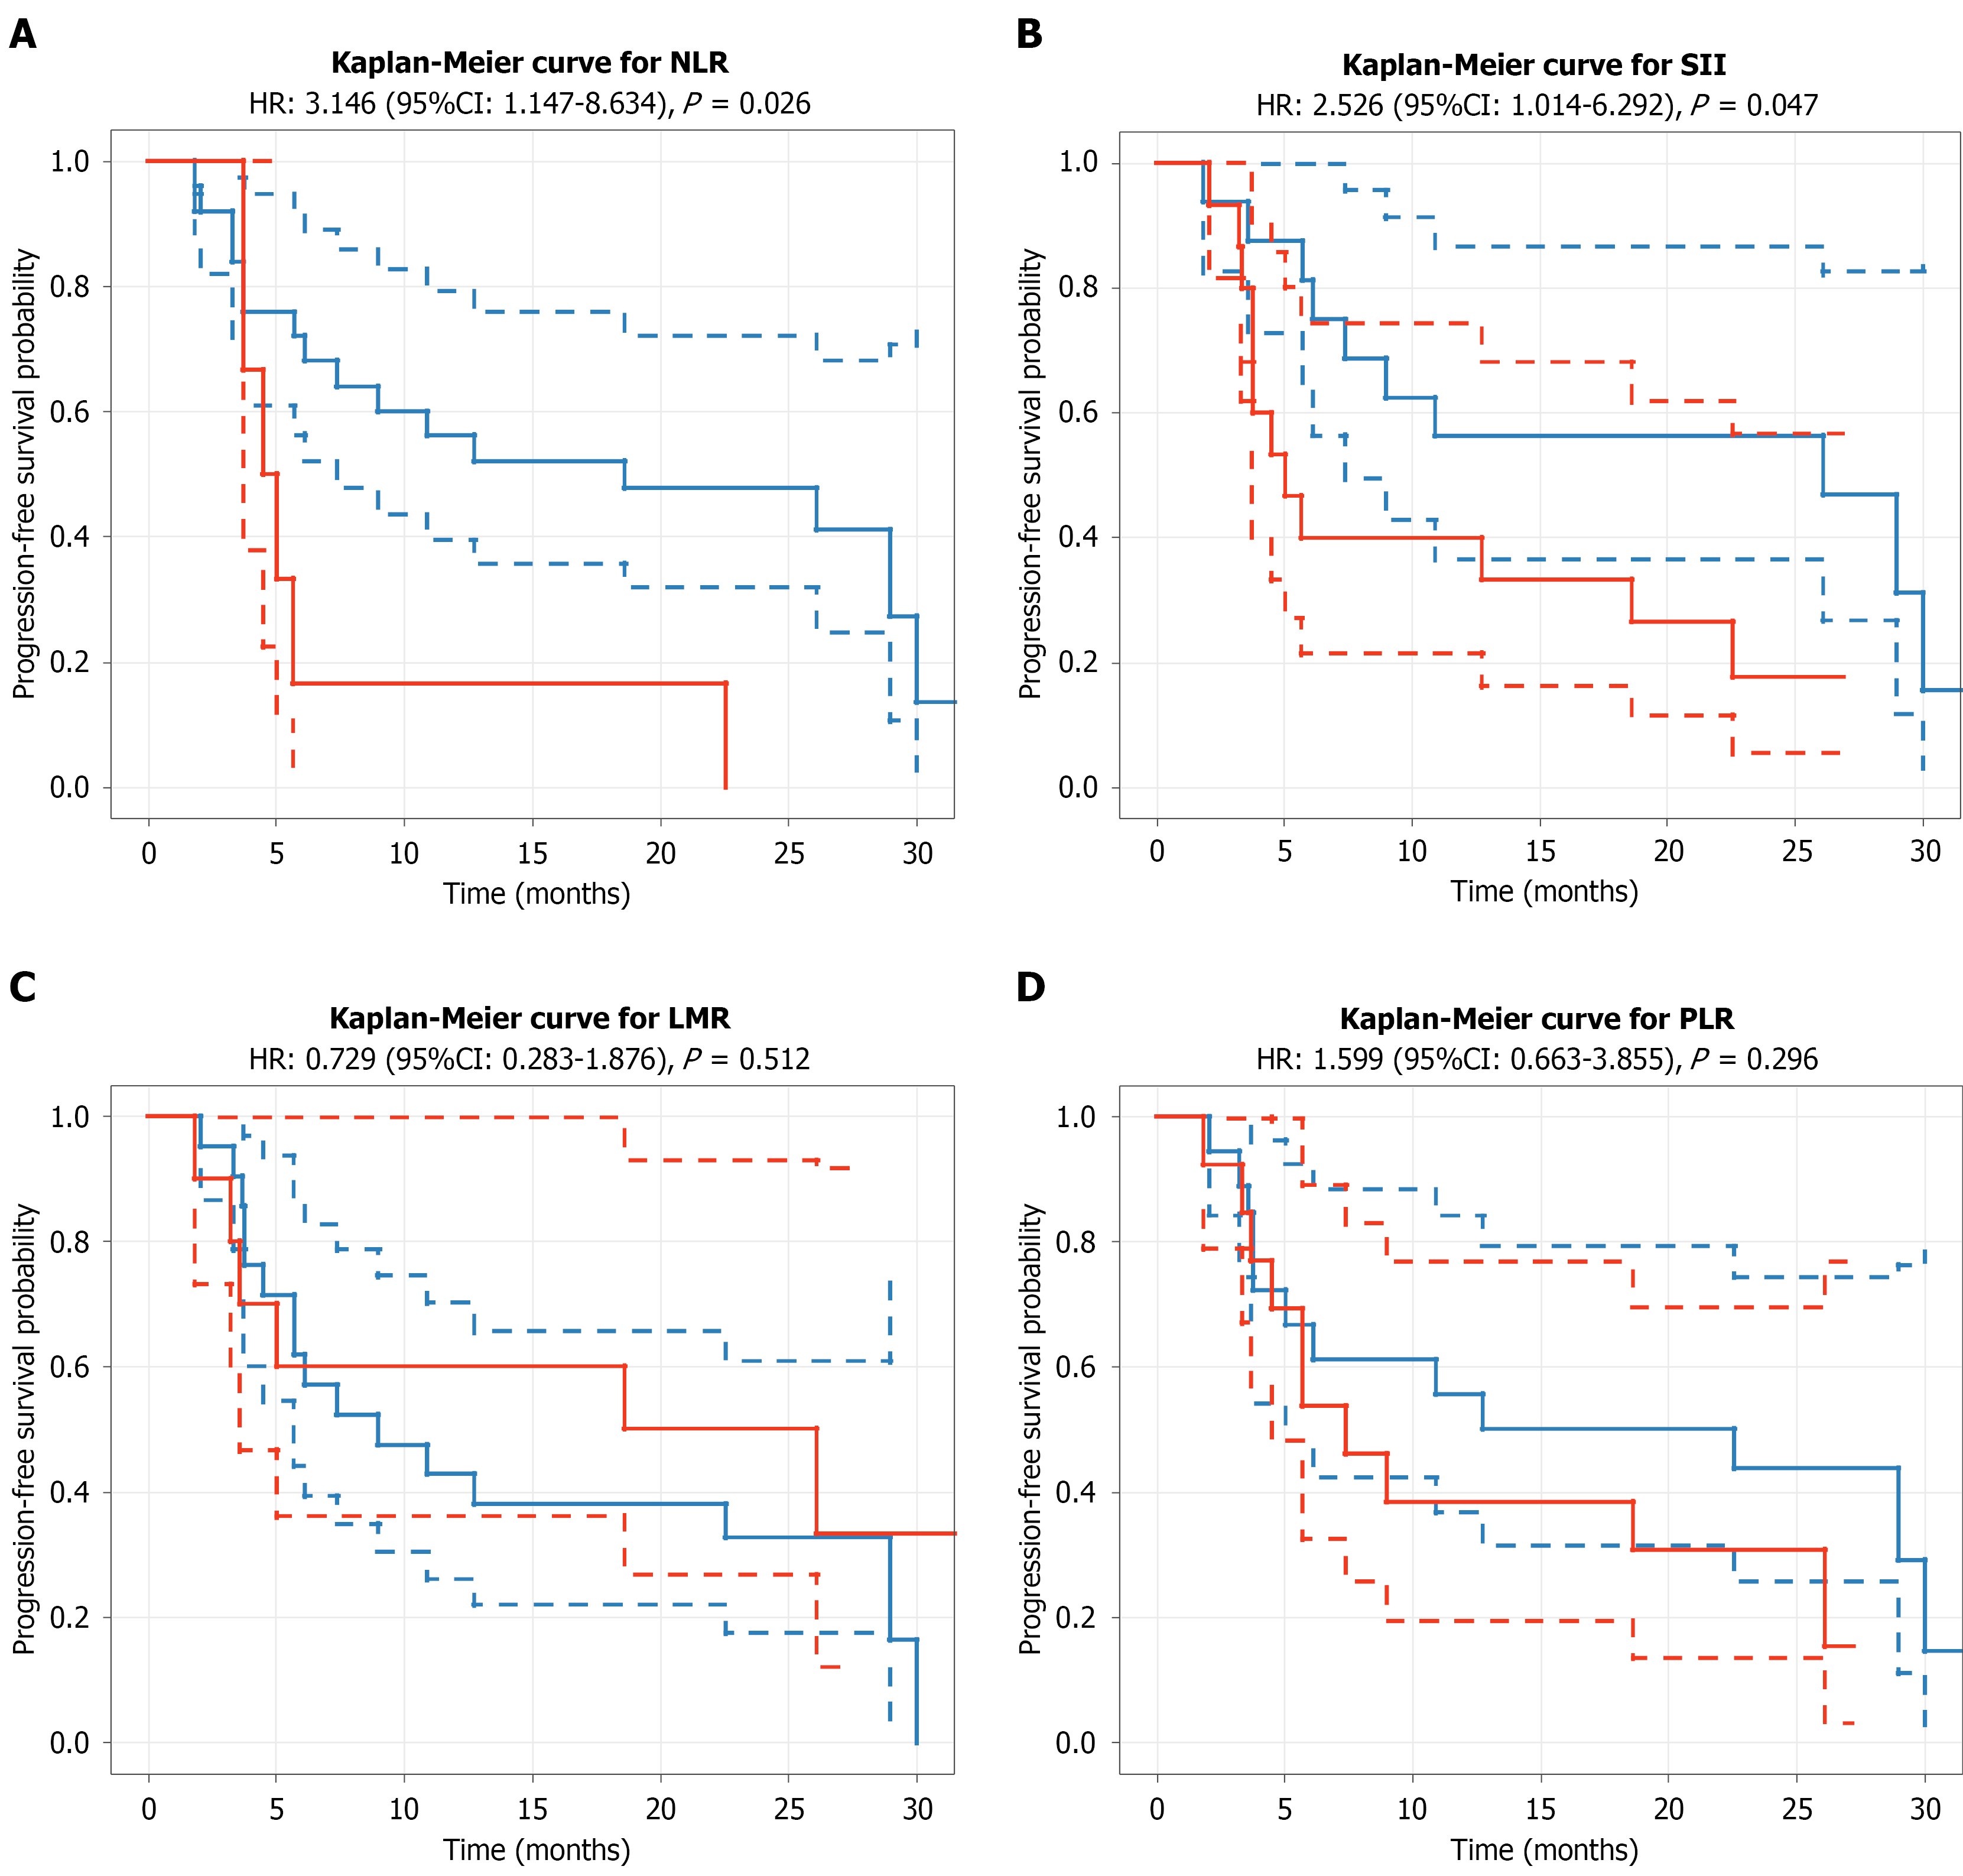
Figure 12 Kaplan-Meier curves for progression-free survival according to post-treatment changes in inflammatory biomarkers in the overall cohort.
A: Neutrophil-to-lymphocyte ratio; B: Systemic immune-inflammation index; C: Lymphocyte-to-monocyte ratio; D: Platelet-to-lymphocyte ratio. Elevated neutrophil-to-lymphocyte ratio and systemic immune-inflammation index were associated with shorter progression-free survival, whereas lymphocyte-to-monocyte ratio and platelet-to-lymphocyte ratio were not significantly associated with progression-free survival. These findings are exploratory and based on a single post-treatment assessment. NLR: Neutrophil-to-lymphocyte ratio; SII: Systemic immune-inflammation index; LMR: Lymphocyte-to-monocyte ratio; PLR: Platelet-to-lymphocyte ratio; HR: Hazard ratio; CI: Confidence interval.
- Citation: Zhang C, Wu SH, Jin L, Lu L, Li J, Jin S. Propensity score-based real-world study of immune checkpoint inhibitor combination therapy in microsatellite stable/proficient mismatch repair metastatic colorectal cancer. World J Gastrointest Oncol 2026; 18(11): 124022
- URL: https://www.wjgnet.com/1948-5204/full/v18/i11/124022.htm
- DOI: https://dx.doi.org/10.4251/wjgo.124022