
















Copyright: ©Author(s) 2026.
World J Gastrointest Oncol. Nov 15, 2026; 18(11): 124022
Published online Nov 15, 2026. doi: 10.4251/wjgo.124022
Published online Nov 15, 2026. doi: 10.4251/wjgo.124022
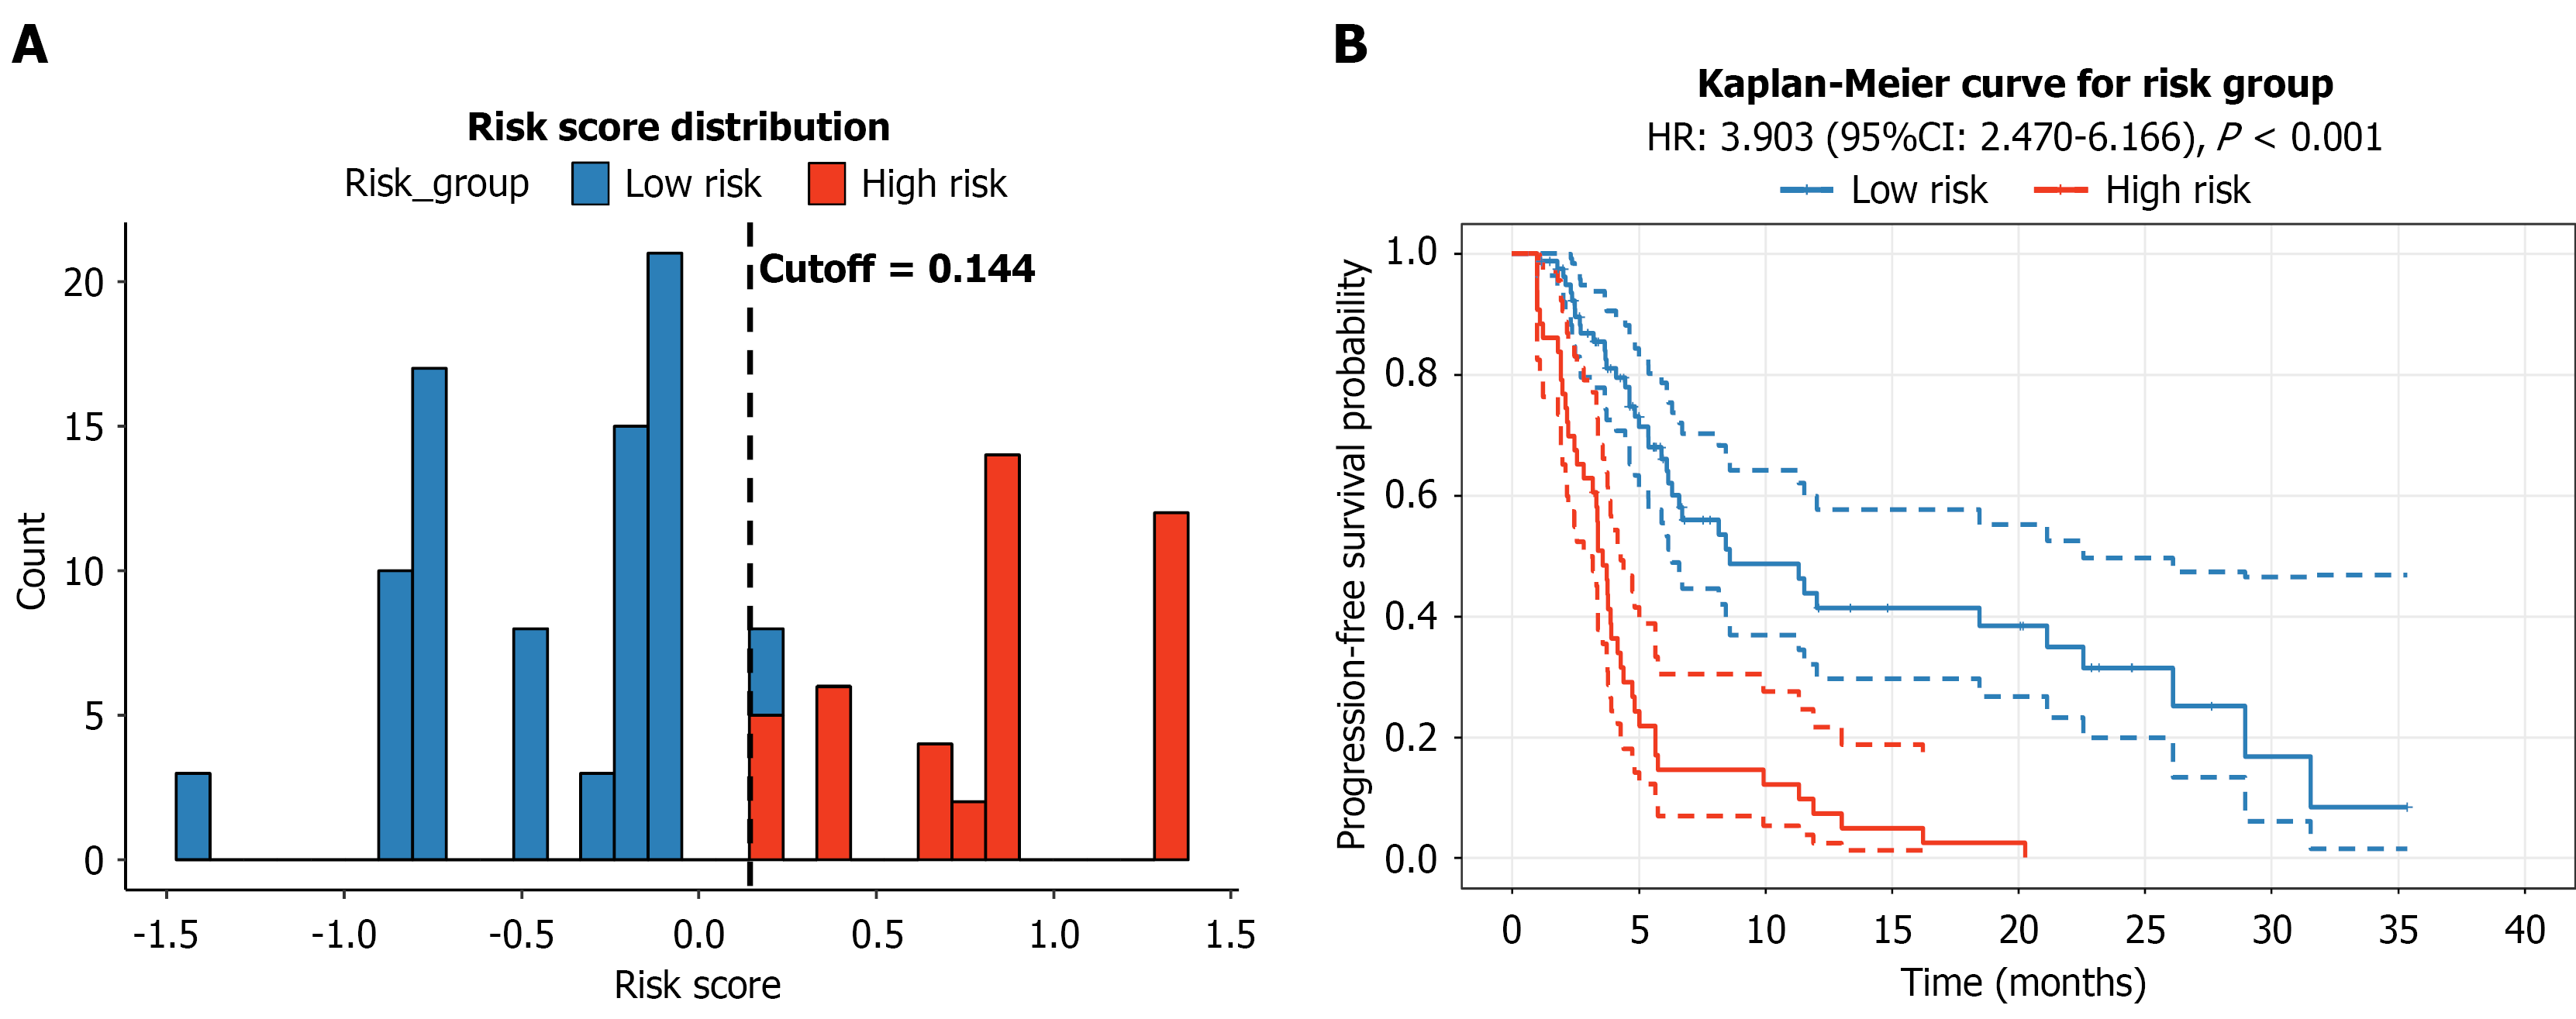
Figure 9 Risk stratification based on the nomogram.
A: Distribution of risk scores and optimal cutoff value; B: Kaplan-Meier curves comparing progression-free survival between low-risk and high-risk groups. HR: Hazard ratio; CI: Confidence interval.
- Citation: Zhang C, Wu SH, Jin L, Lu L, Li J, Jin S. Propensity score-based real-world study of immune checkpoint inhibitor combination therapy in microsatellite stable/proficient mismatch repair metastatic colorectal cancer. World J Gastrointest Oncol 2026; 18(11): 124022
- URL: https://www.wjgnet.com/1948-5204/full/v18/i11/124022.htm
- DOI: https://dx.doi.org/10.4251/wjgo.124022