
















Copyright: ©Author(s) 2026.
World J Gastrointest Oncol. Nov 15, 2026; 18(11): 121485
Published online Nov 15, 2026. doi: 10.4251/wjgo.121485
Published online Nov 15, 2026. doi: 10.4251/wjgo.121485
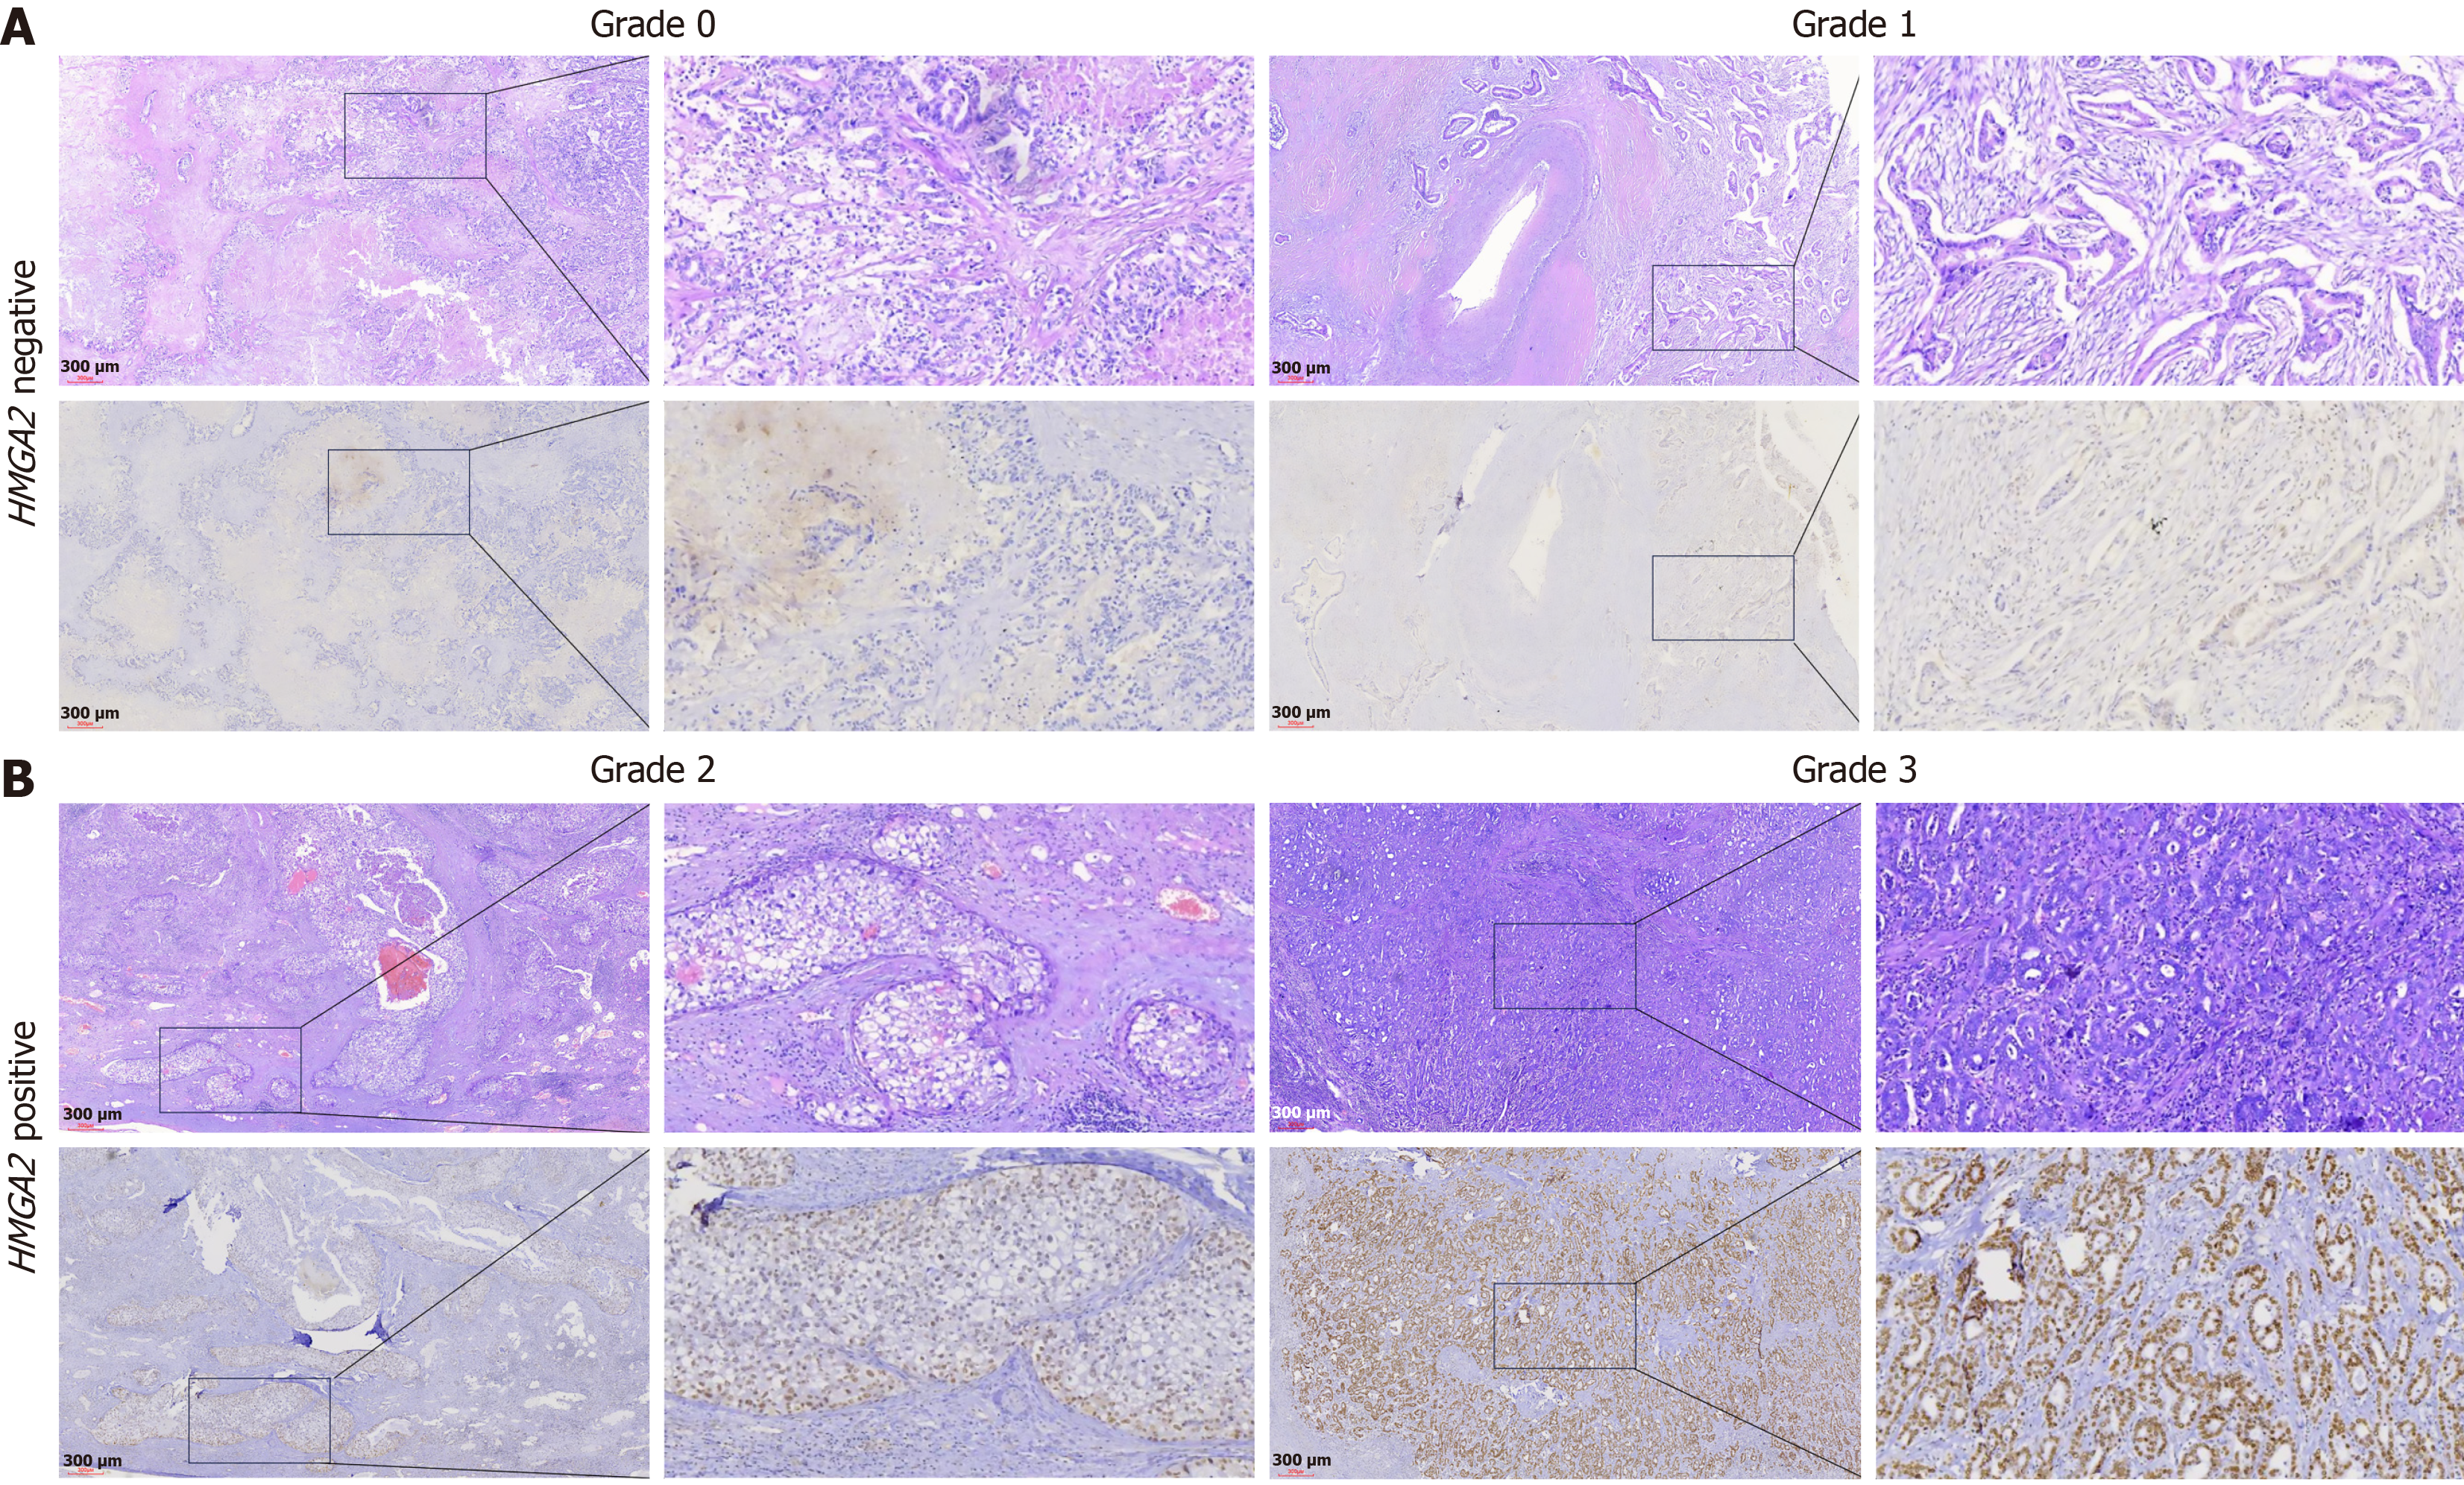
Figure 1 Immunohistochemical staining of HMGA2 in intrahepatic cholangiocarcinoma patient tissues.
A: Negative expression of HMGA2; B: Positive expression of HMGA2. Original magnification, × 40; scale bar, 300 μm.
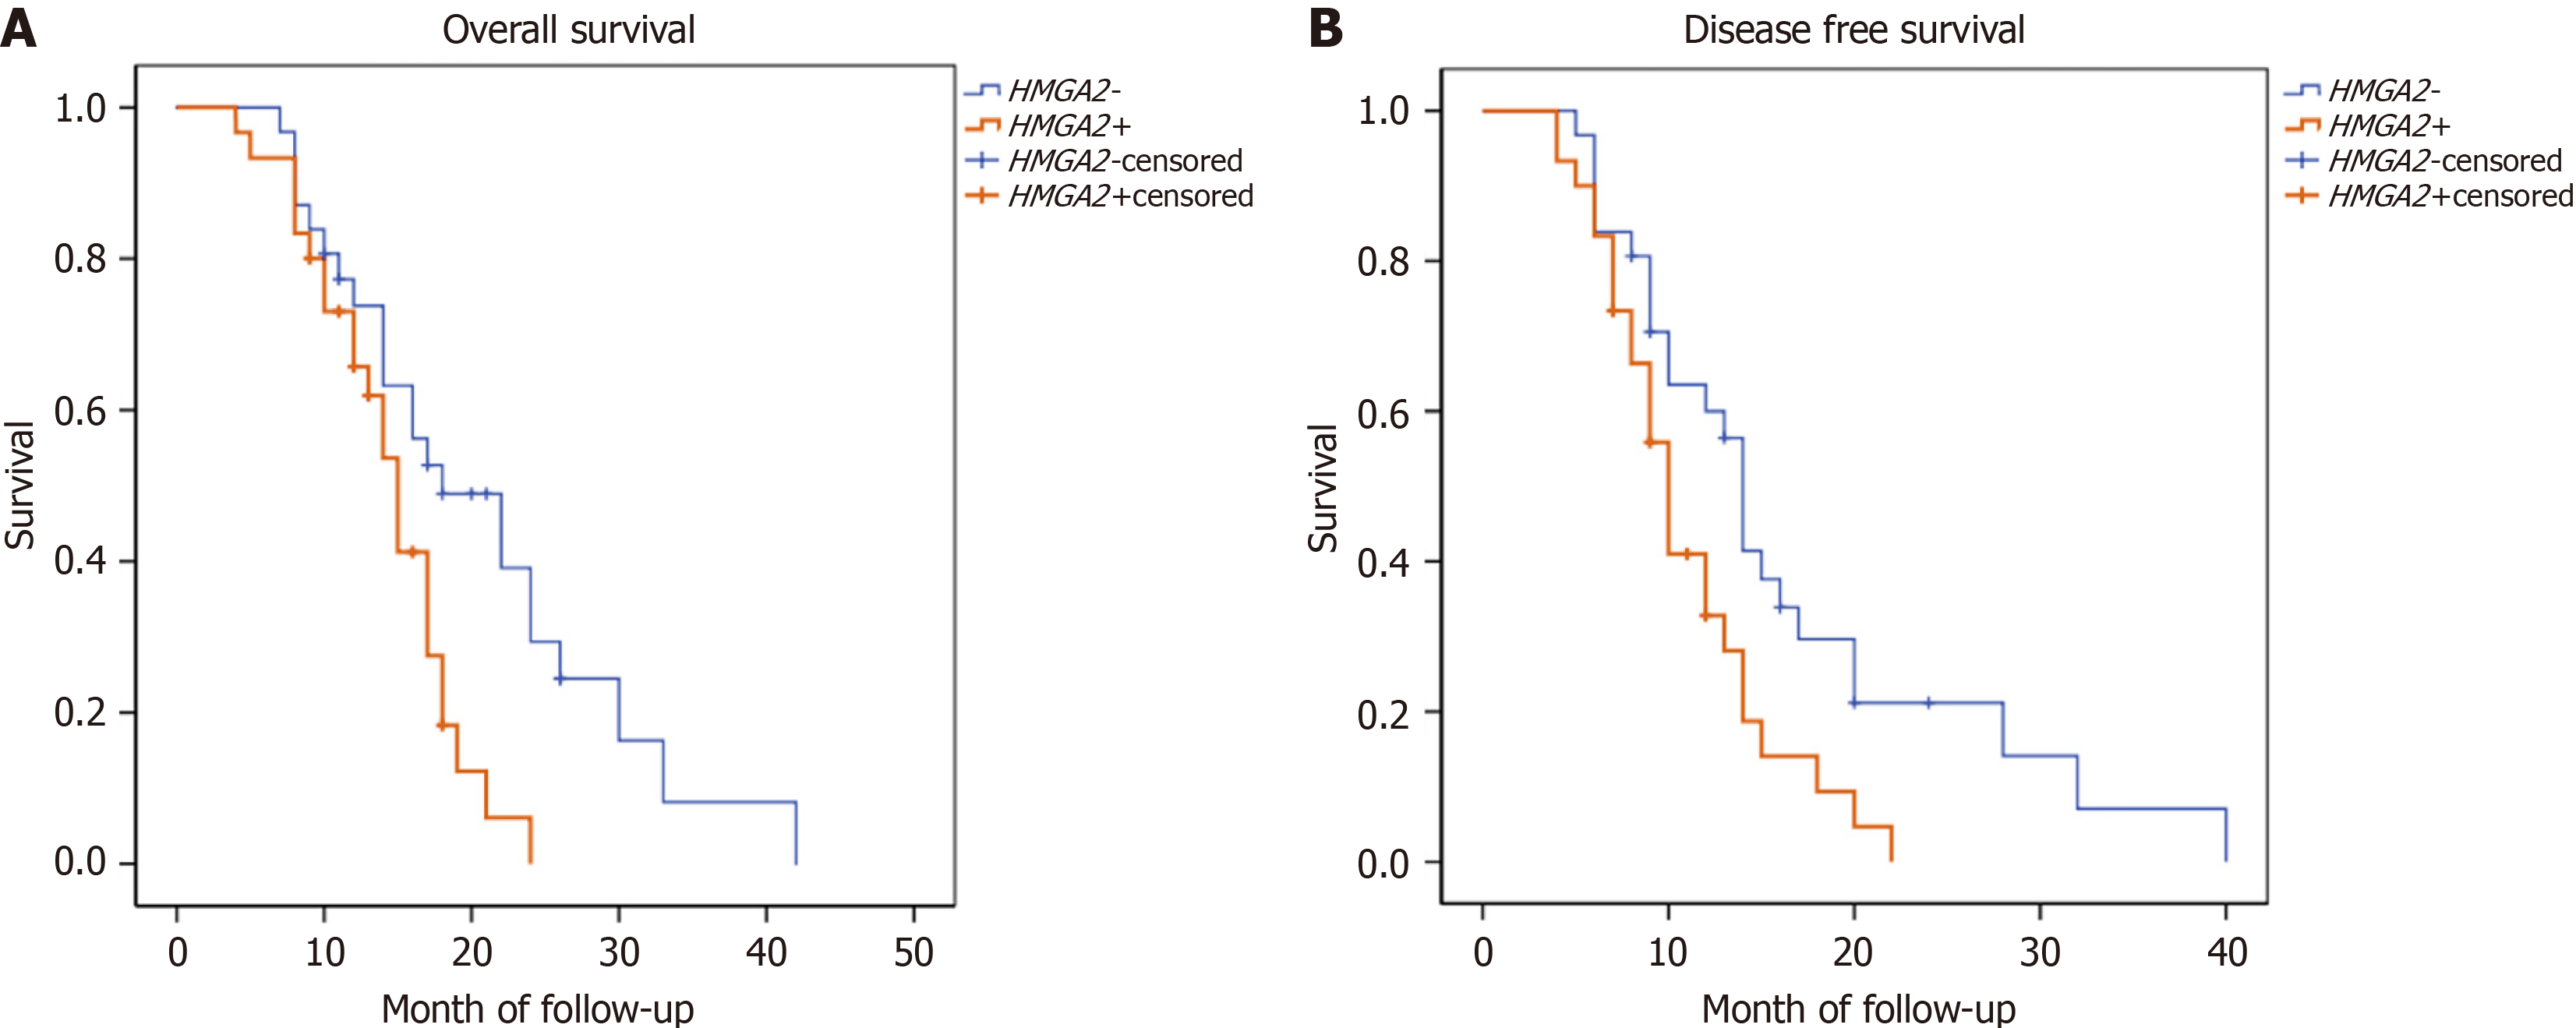
Figure 2 Prognostic value of HMGA2 expression in intrahepatic cholangiocarcinoma patients.
A: Kaplan-Meier analysis of overall survival; B: Kaplan-Meier analysis of disease-free survival.
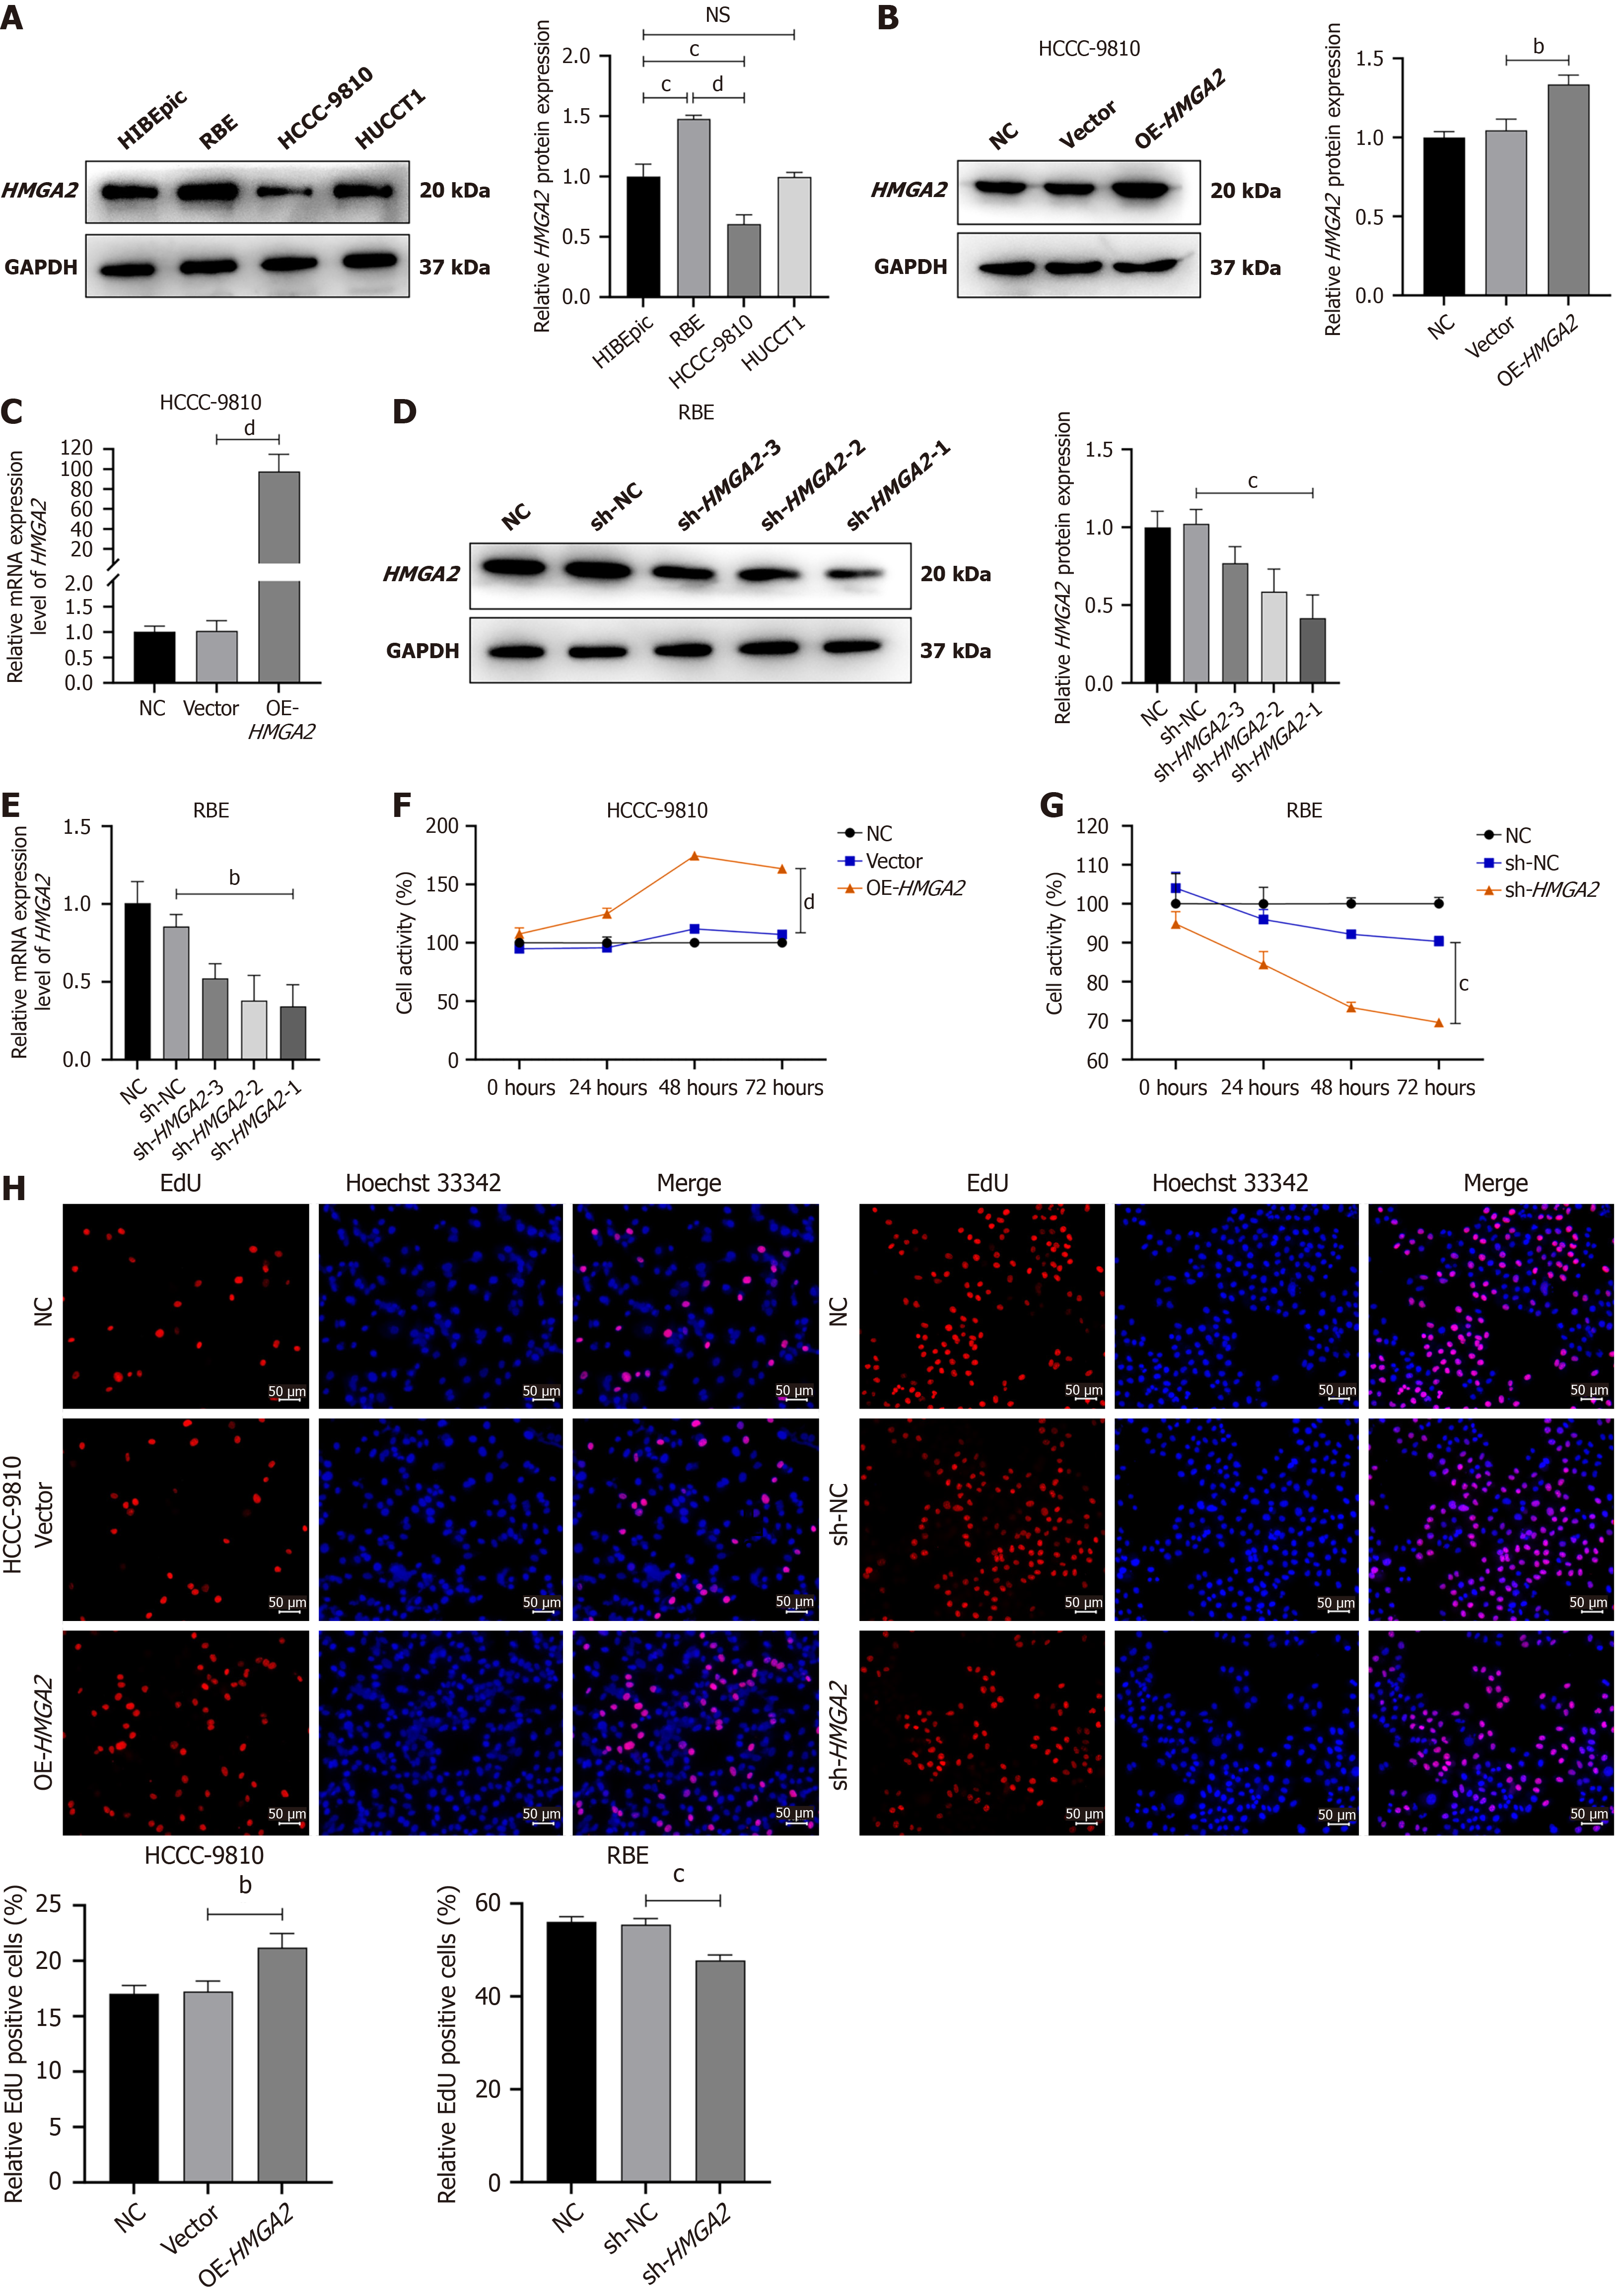
Figure 3 HMGA2 regulates the proliferative phenotype of intrahepatic cholangiocarcinoma cells.
A: HMGA2 protein expression in human intrahepatic biliary epithelial cells and intrahepatic cholangiocarcinoma cell lines (RBE, HCCC-9810, HUCCT1); B and C: Efficiency of HMGA2 overexpression verified by Western blot (WB) and reverse transcription quantitative polymerase chain reaction (RT-qPCR); D and E: Efficiency of HMGA2 knockdown validated by WB and RT-qPCR; F and G: Cell viability detected by cell counting kit-8 assay; H: Cell proliferation assessed by 5-ethynyl-2’-deoxyuridine staining. bP < 0.01. cP < 0.001. dP < 0.0001. NS: Not significant; GAPDH: Glyceraldehyde-3-phosphate dehydrogenase; NC: Negative control; OE-HMGA2: HMGA2 over-expression; mRNA: Messenger RNA; sh-NC: Short hairpin RNA negative control; sh-HMGA2: Short hairpin RNA-mediated HMGA2 knockdown; EdU: 5-ethynyl-2’-deoxyuridine.
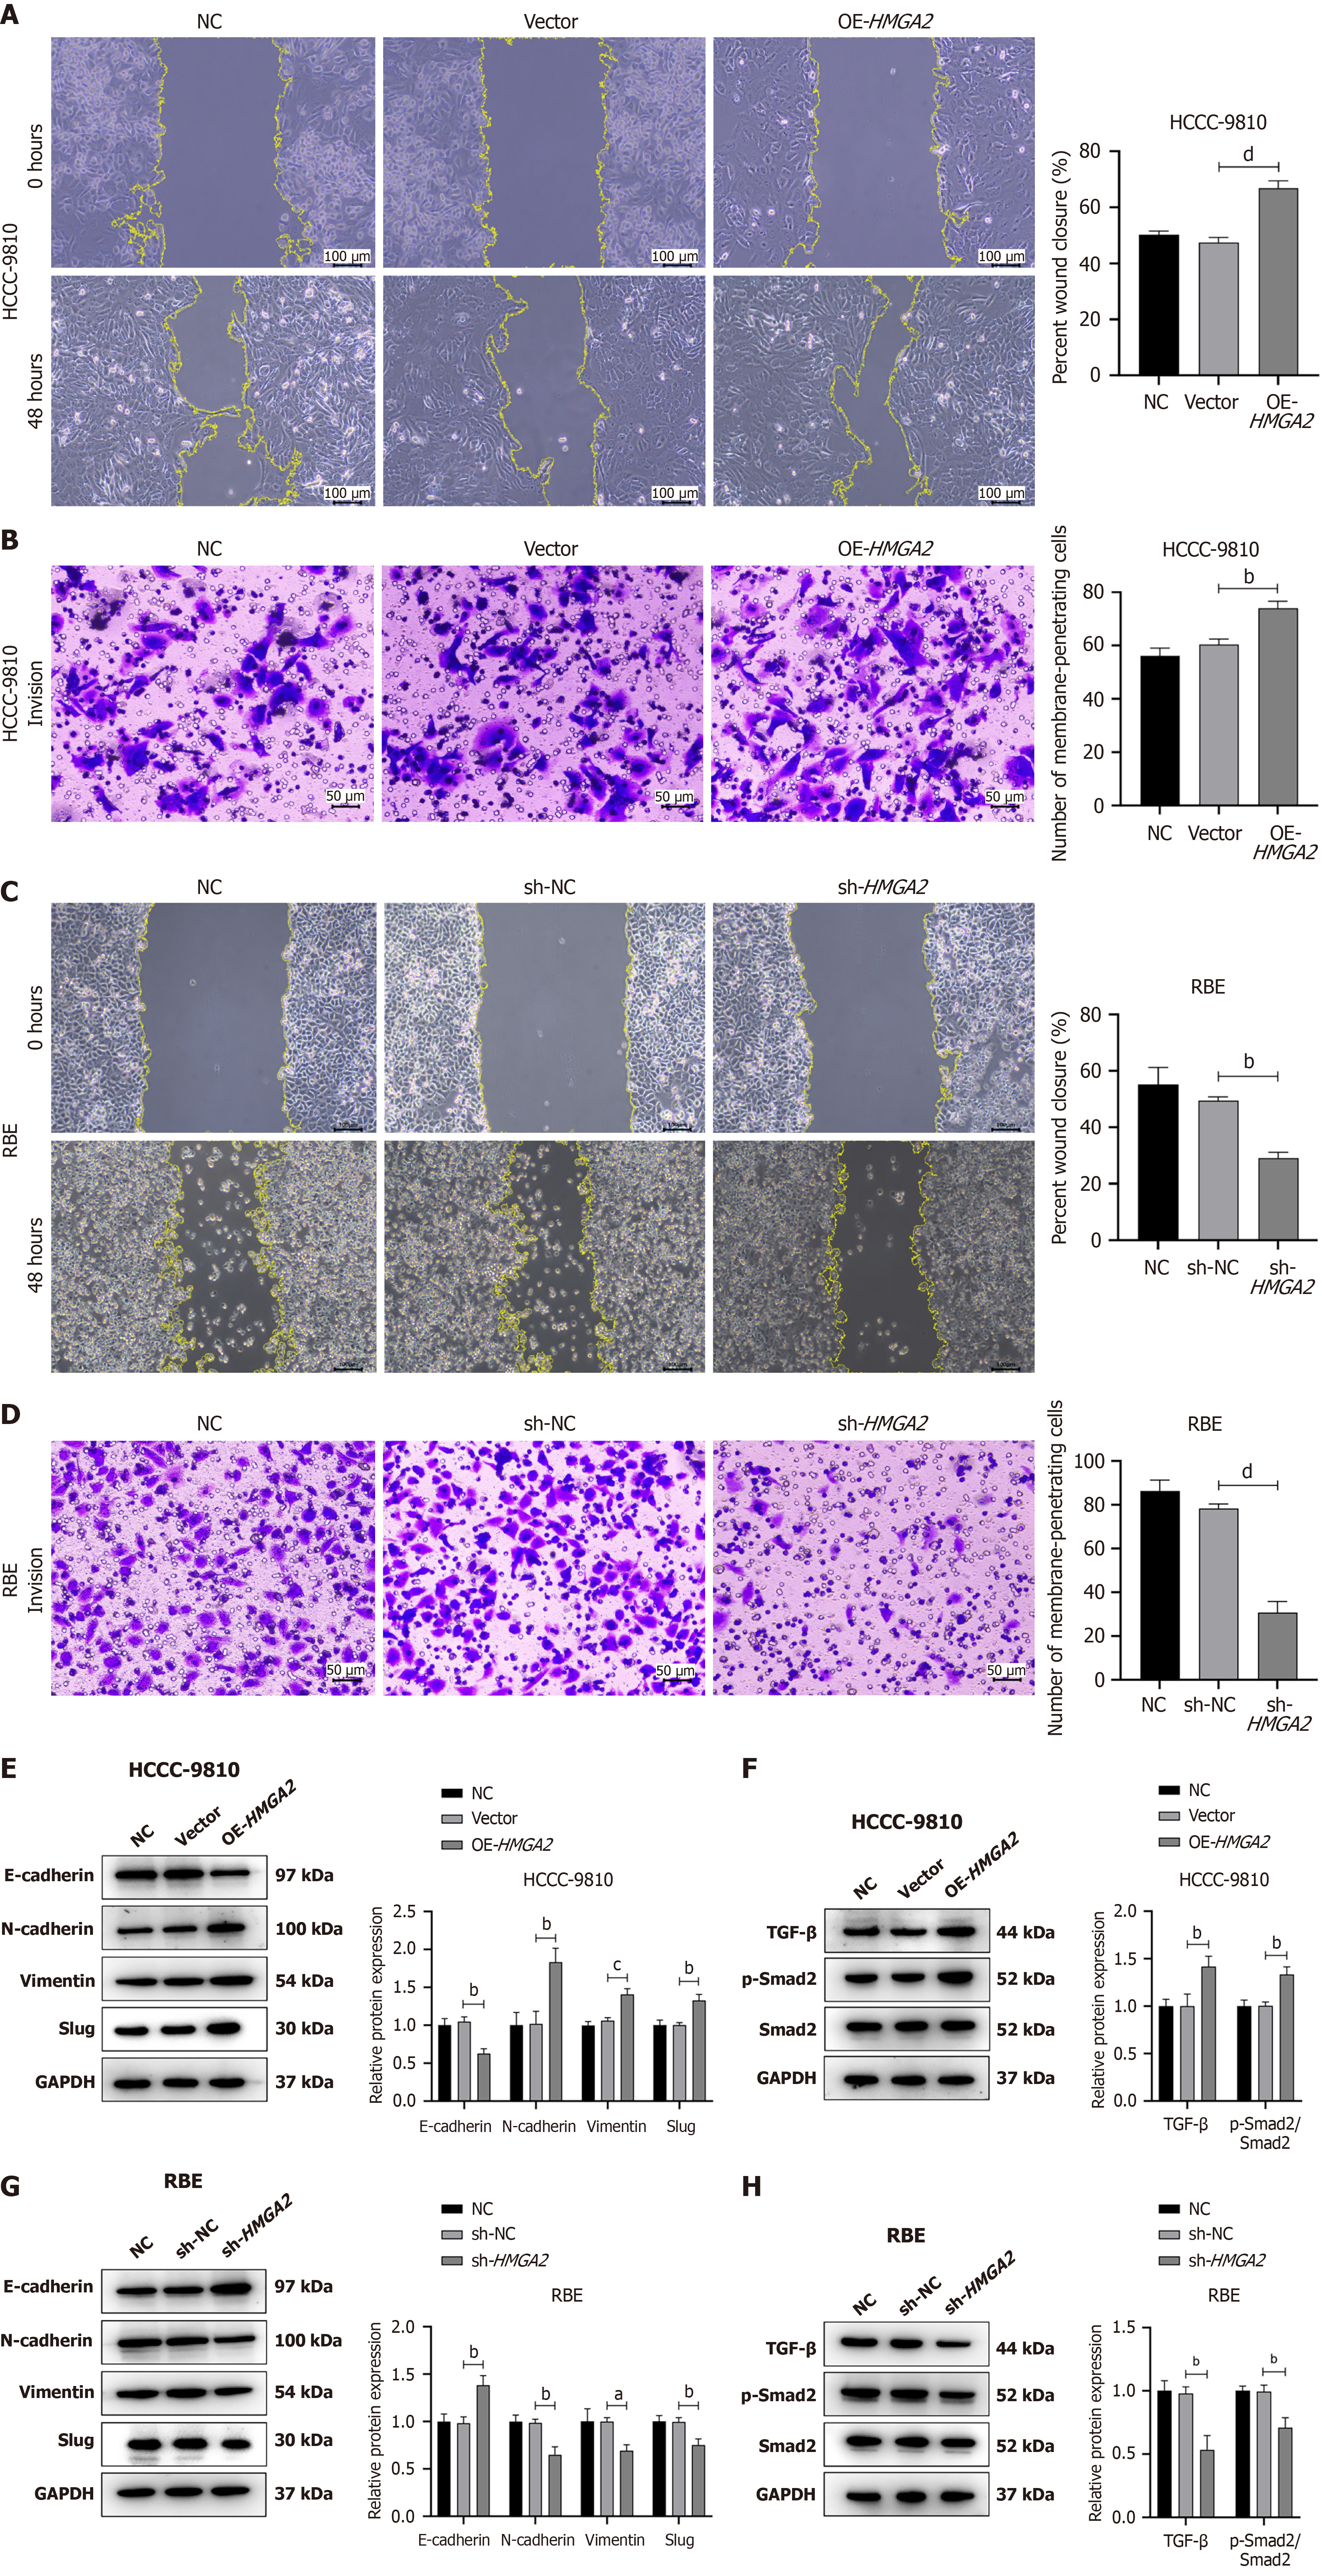
Figure 4 HMGA2 regulates the metastatic phenotype and epithelial-mesenchymal transition in intrahepatic cholangiocarcinoma cells.
A-D: Cell migration determined by cell scratch assay (A and C) and cell invasion evaluated by Transwell invasion assay (B and D); E-H: Expression of epithelial-mesenchymal transition-related markers analyzed by Western blot (WB) (E and G) and expression levels of transforming growth factor-β and phospho-small mothers against decapentaplegic 2 measured by WB (F and H). aP < 0.05. bP < 0.01. cP < 0.001. dP < 0.0001. NC: Negative control; OE-HMGA2: HMGA2 over-expression; sh-NC: Short hairpin RNA negative control; sh-HMGA2: Short hairpin RNA-mediated HMGA2 knockdown; GAPDH: Glyceraldehyde-3-phosphate dehydrogenase; TGF: Transforming growth factor; Smad2: Small mothers against decapentaplegic 2; p-Smad2: Phospho-small mothers against decapentaplegic 2.
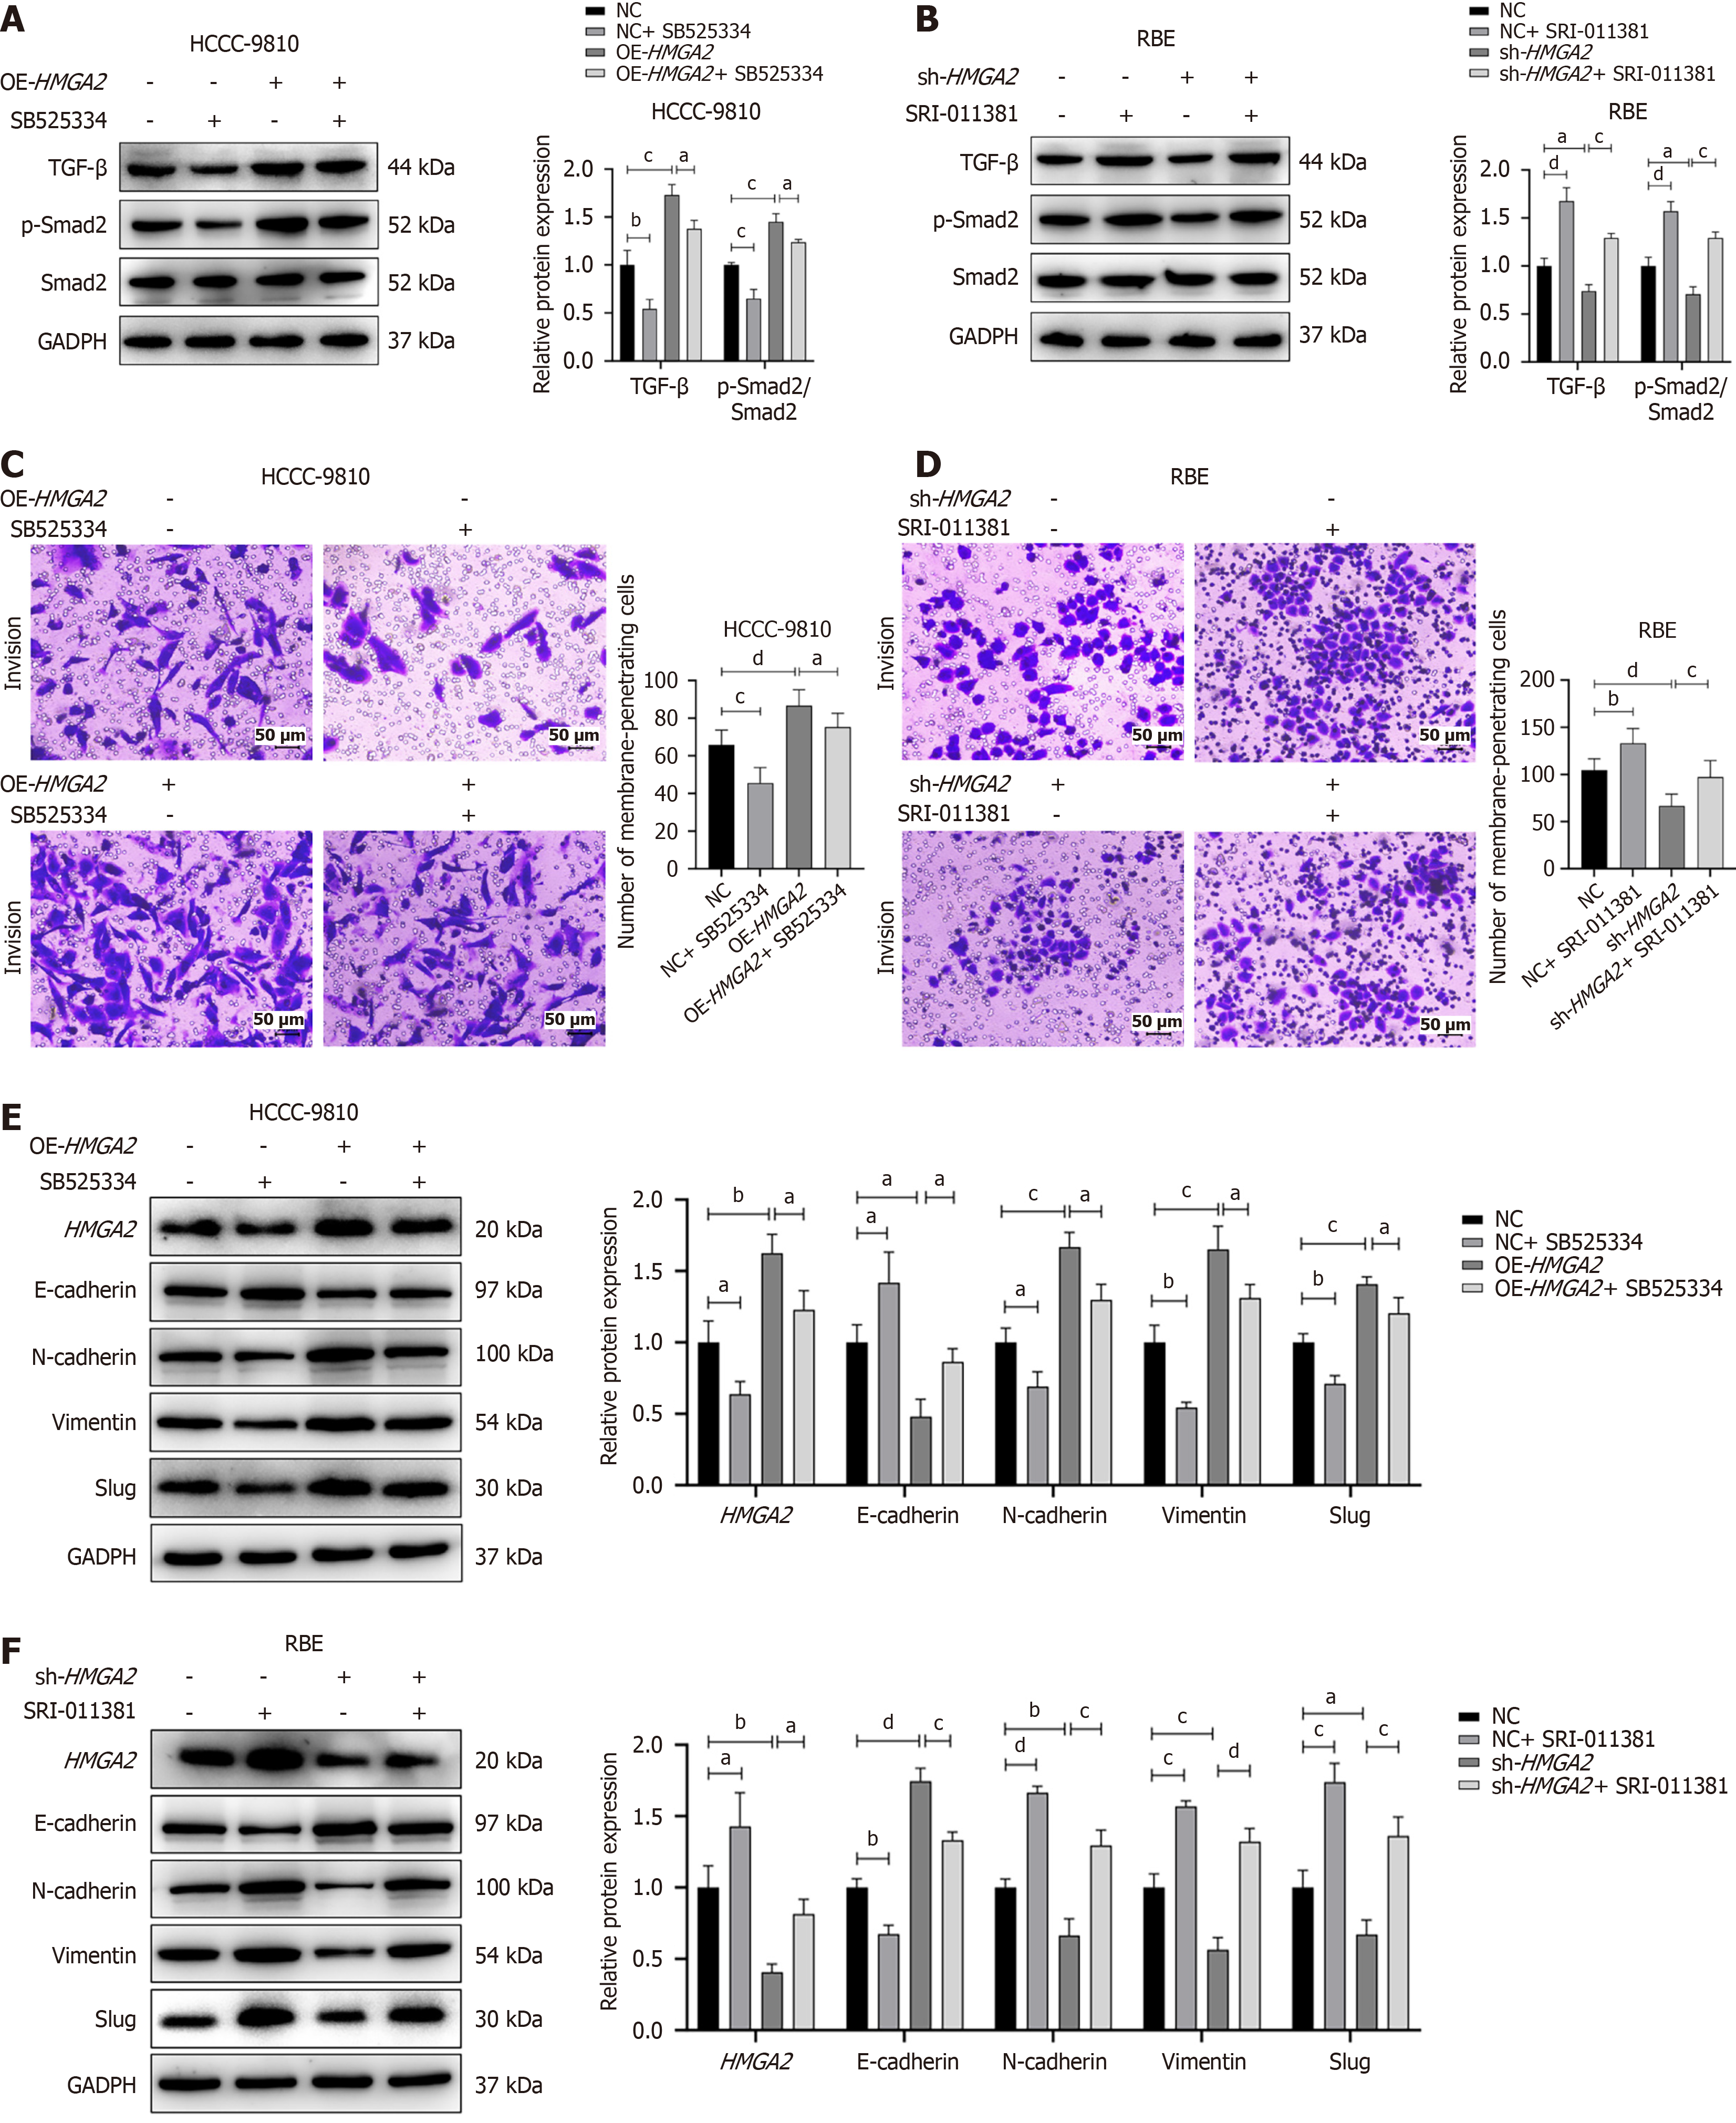
Figure 5 HMGA2 drives epithelial-mesenchymal transition and metastasis in cholangiocarcinoma cells via the transforming growth factor-β/small mothers against decapentaplegic 2 pathway.
A and B: Western blot (WB) analysis of transforming growth factor-β/small mothers against decapentaplegic 2 (TGF-β/Smad2) pathway intervention efficiency; C and D: Transwell assays showing the TGF-β/Smad2 pathway mediates HMGA2-egulated cell invasion; E and F: WB demonstrating that the TGF-β/Smad2 pathway mediates HMGA2-induced epithelial-mesenchymal transition. aP < 0.05. bP < 0.01. cP < 0.001. dP < 0.0001. NC: Negative control; OE-HMGA2: HMGA2 over-expression; sh-HMGA2: Short hairpin RNA-mediated HMGA2 knockdown; GAPDH: Glyceraldehyde-3-phosphate dehydrogenase; TGF: Transforming growth factor; Smad2: Small mothers against decapentaplegic 2; p-Smad2: Phospho-small mothers against decapentaplegic 2.
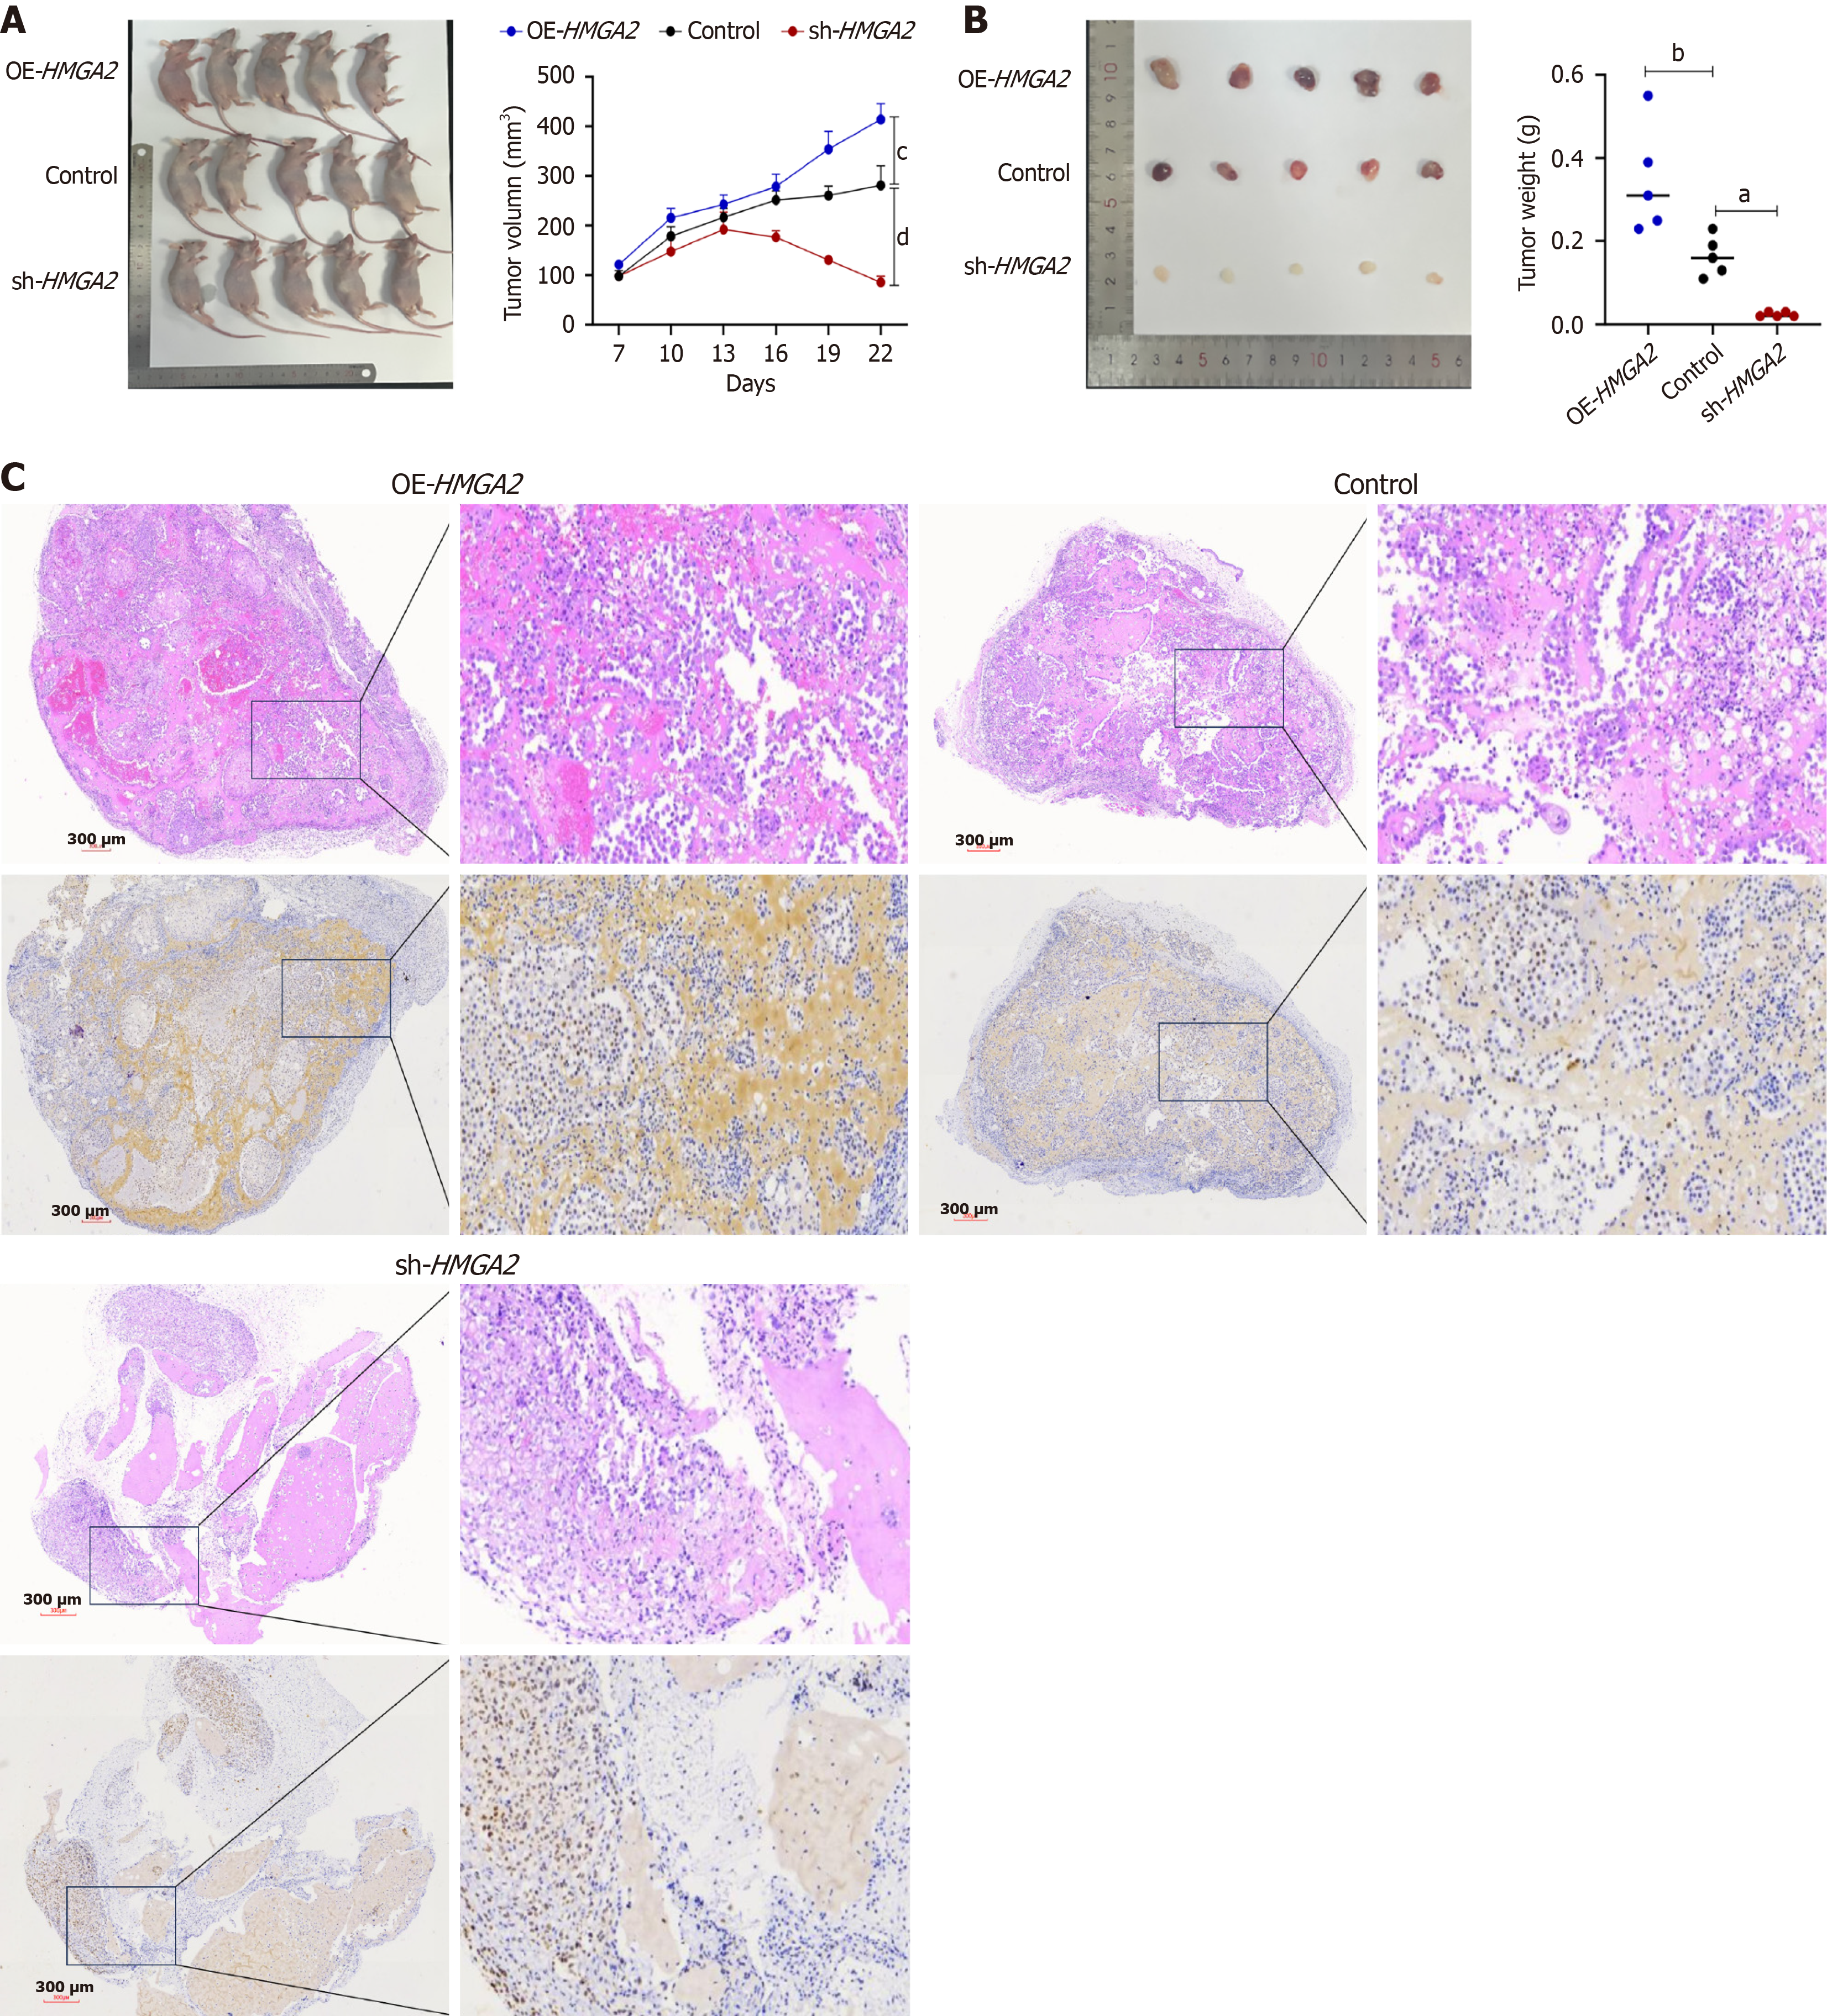
Figure 6 HMGA2 promotes intrahepatic cholangiocarcinoma cell growth in nude mice.
A: Images of xenograft tumors and tumor growth curves 3 weeks after implantation; B: Resected tumor tissues and tumor weight analysis; C: Immunohistochemical staining of HMGA2 in xenograft tumors. Original magnification, × 40; scale bar, 300 μm. aP < 0.05. bP < 0.01. cP < 0.001. dP < 0.0001. OE-HMGA2: HMGA2 over-expression; sh-HMGA2: Short hairpin RNA-mediated HMGA2 knockdown.
- Citation: Zhang YN, Hao JY, Lei X, Wang PF, Xu SC, Huang XJ. HMGA2 promotes epithelial-mesenchymal transition in intrahepatic cholangiocarcinoma via transforming growth factor-β/small mothers against decapentaplegic 2. World J Gastrointest Oncol 2026; 18(11): 121485
- URL: https://www.wjgnet.com/1948-5204/full/v18/i11/121485.htm
- DOI: https://dx.doi.org/10.4251/wjgo.121485