
















Copyright: ©Author(s) 2026.
World J Gastrointest Oncol. Oct 15, 2026; 18(10): 122497
Published online Oct 15, 2026. doi: 10.4251/wjgo.122497
Published online Oct 15, 2026. doi: 10.4251/wjgo.122497
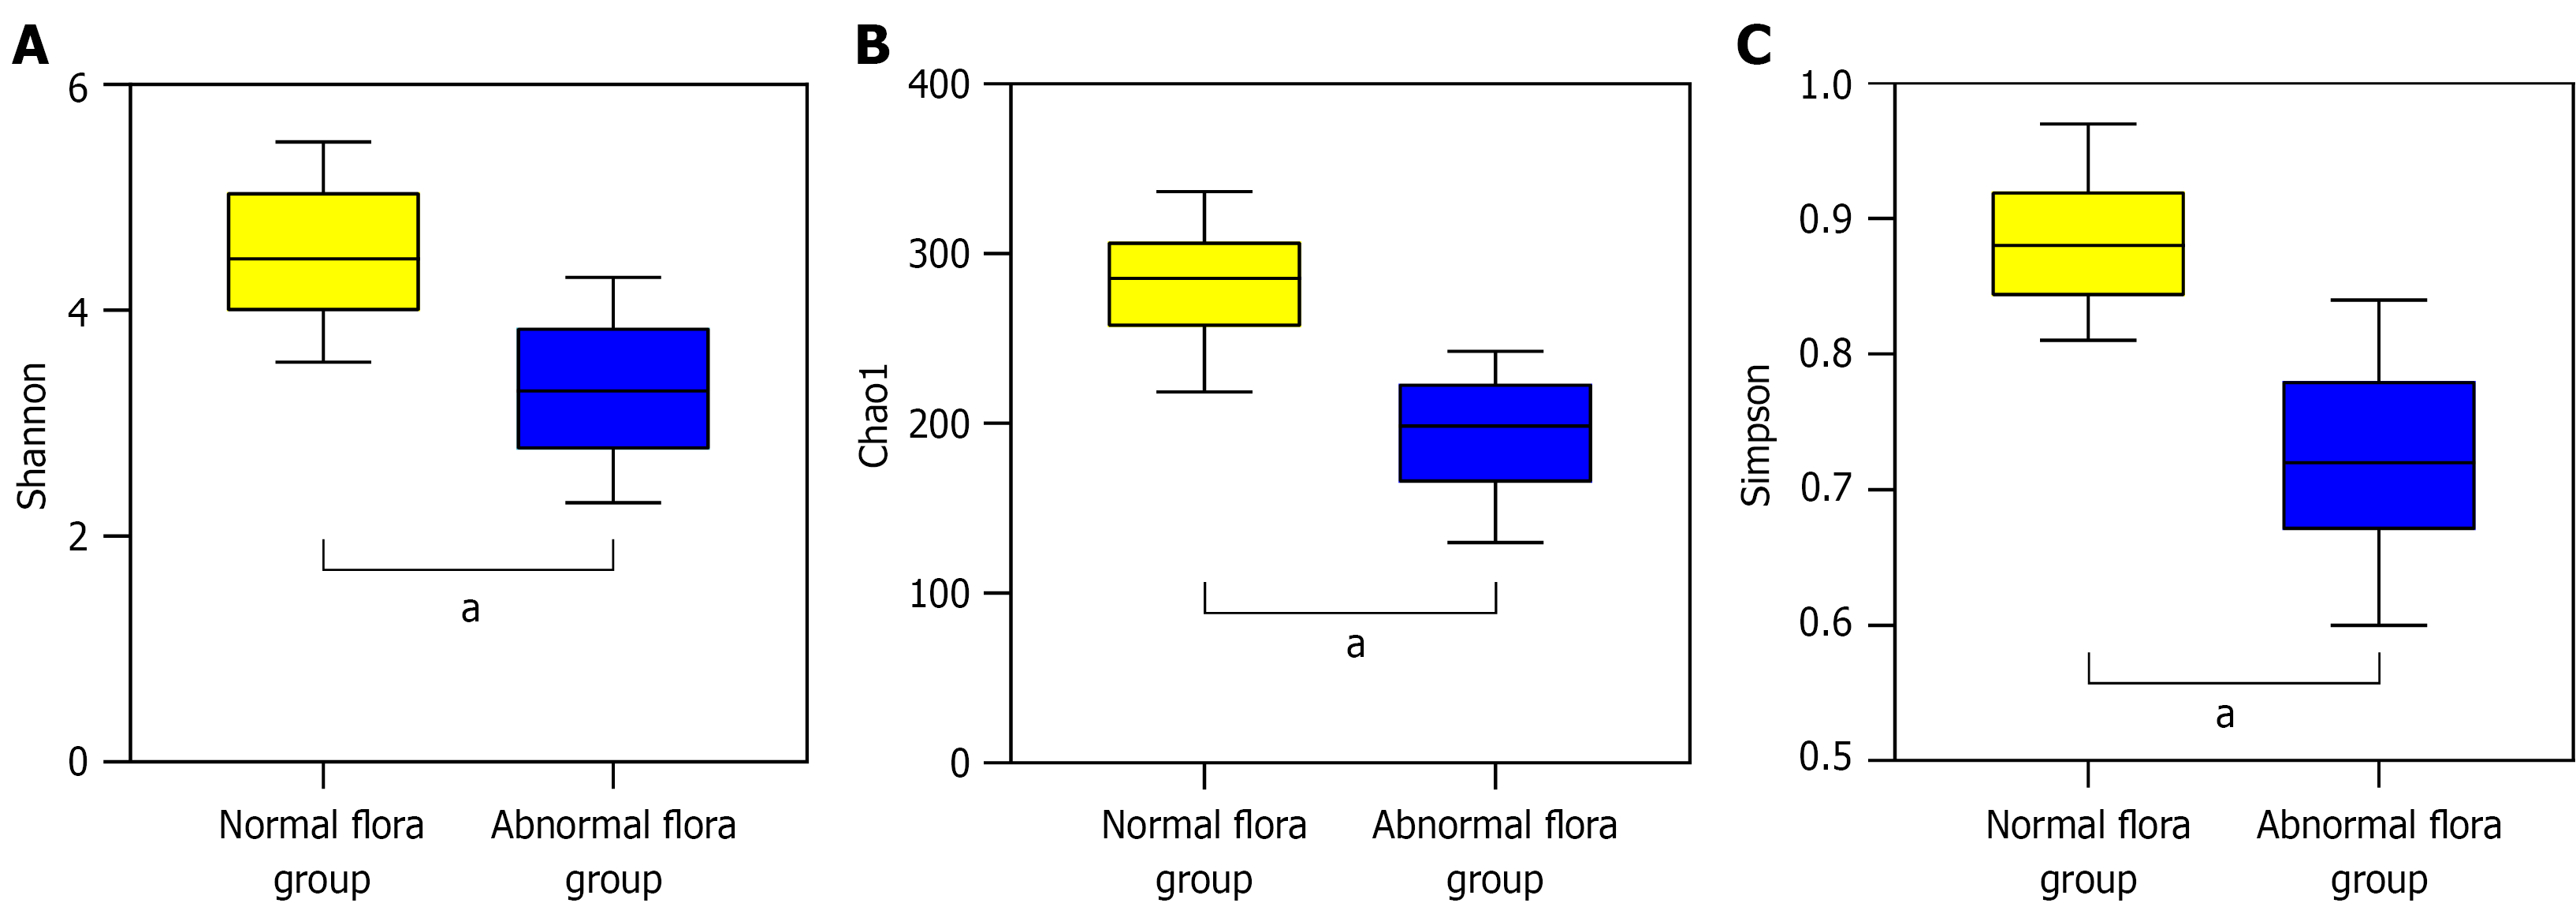
Figure 1 Comparison of gut microbiota α-diversity indices between the two groups.
A: Shannon index; B: Chao1 index; C: Simpson index.
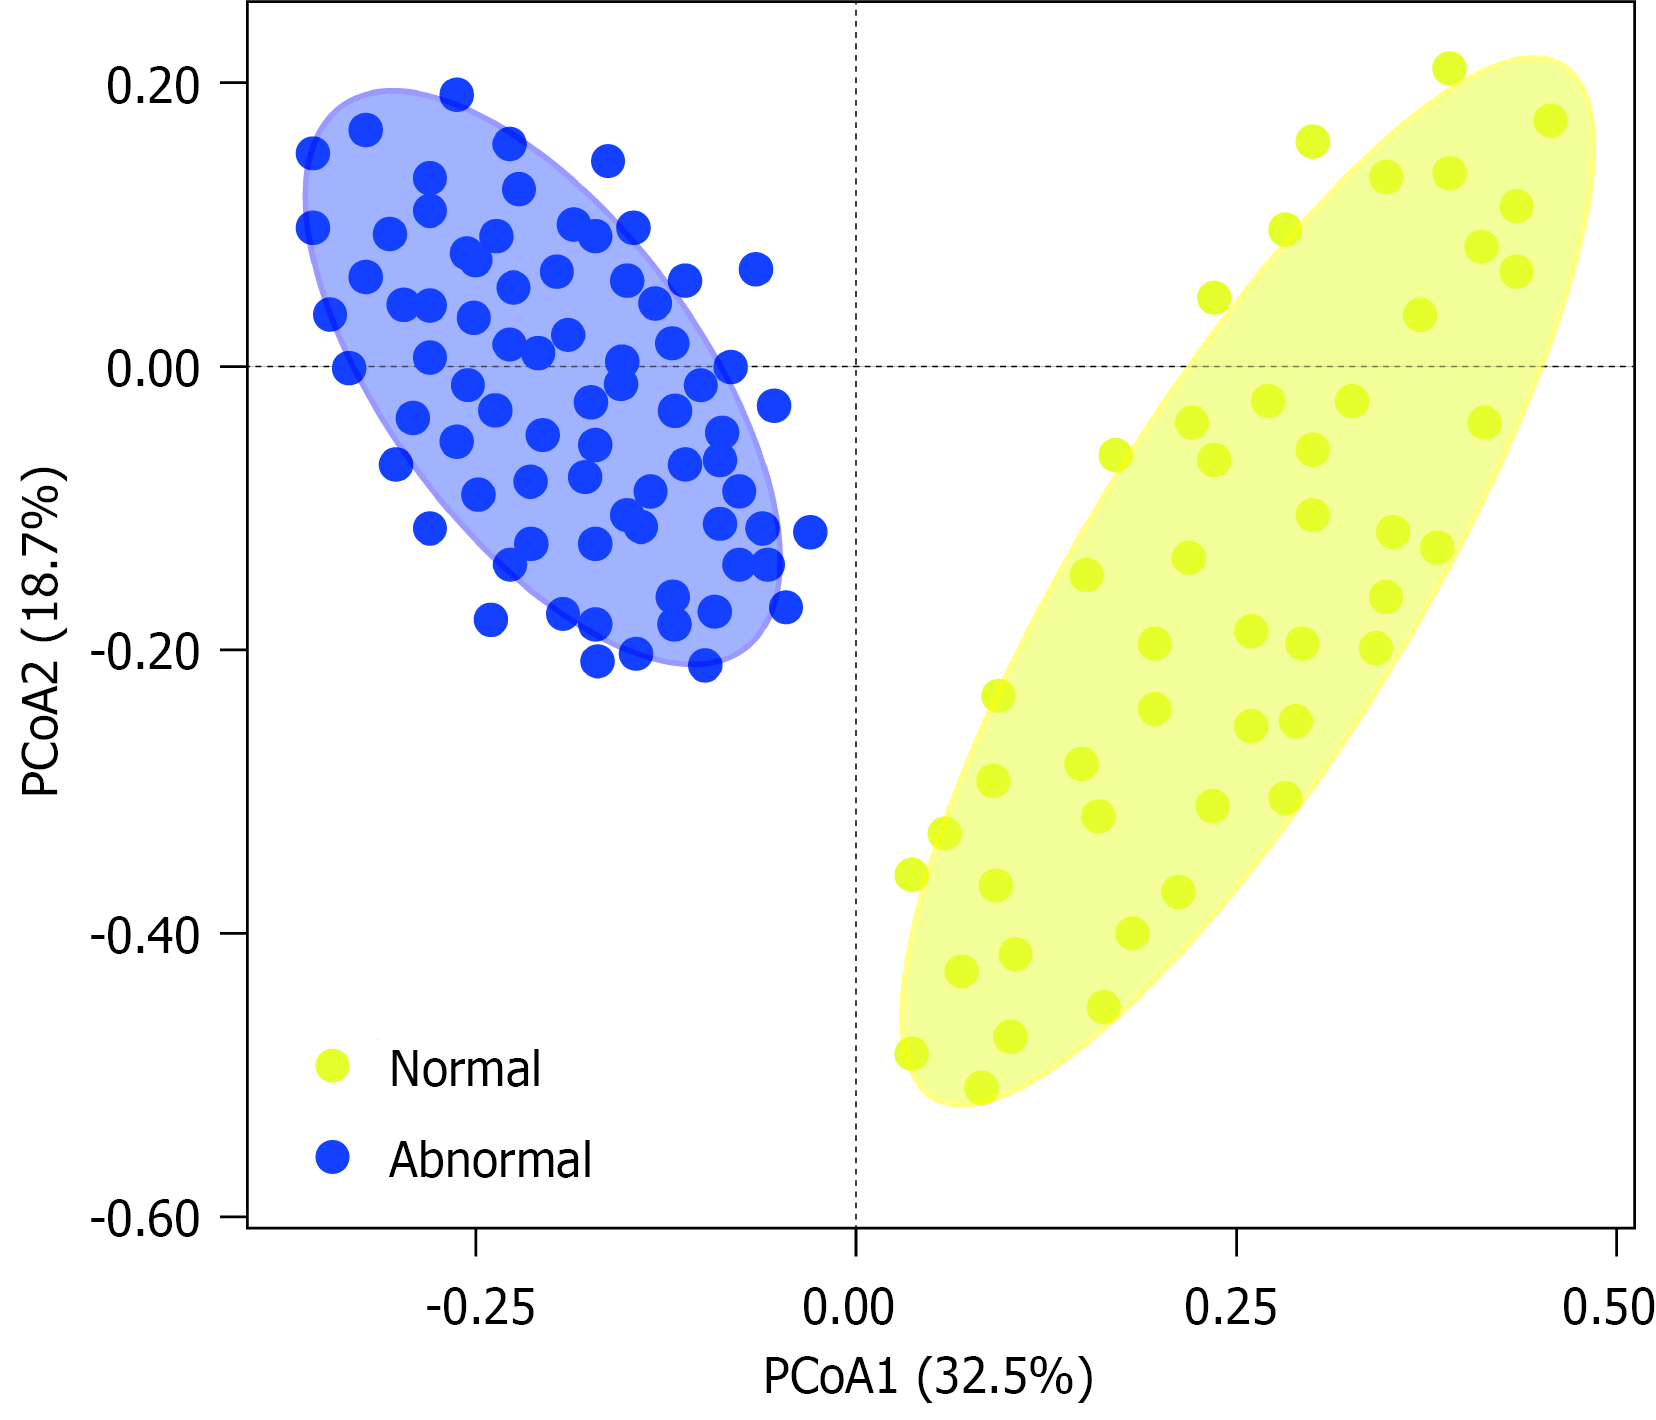
Figure 2 The β-diversity analysis of gut microbiota between the two groups.
PCoA2: Principal coordinate analysis 2.
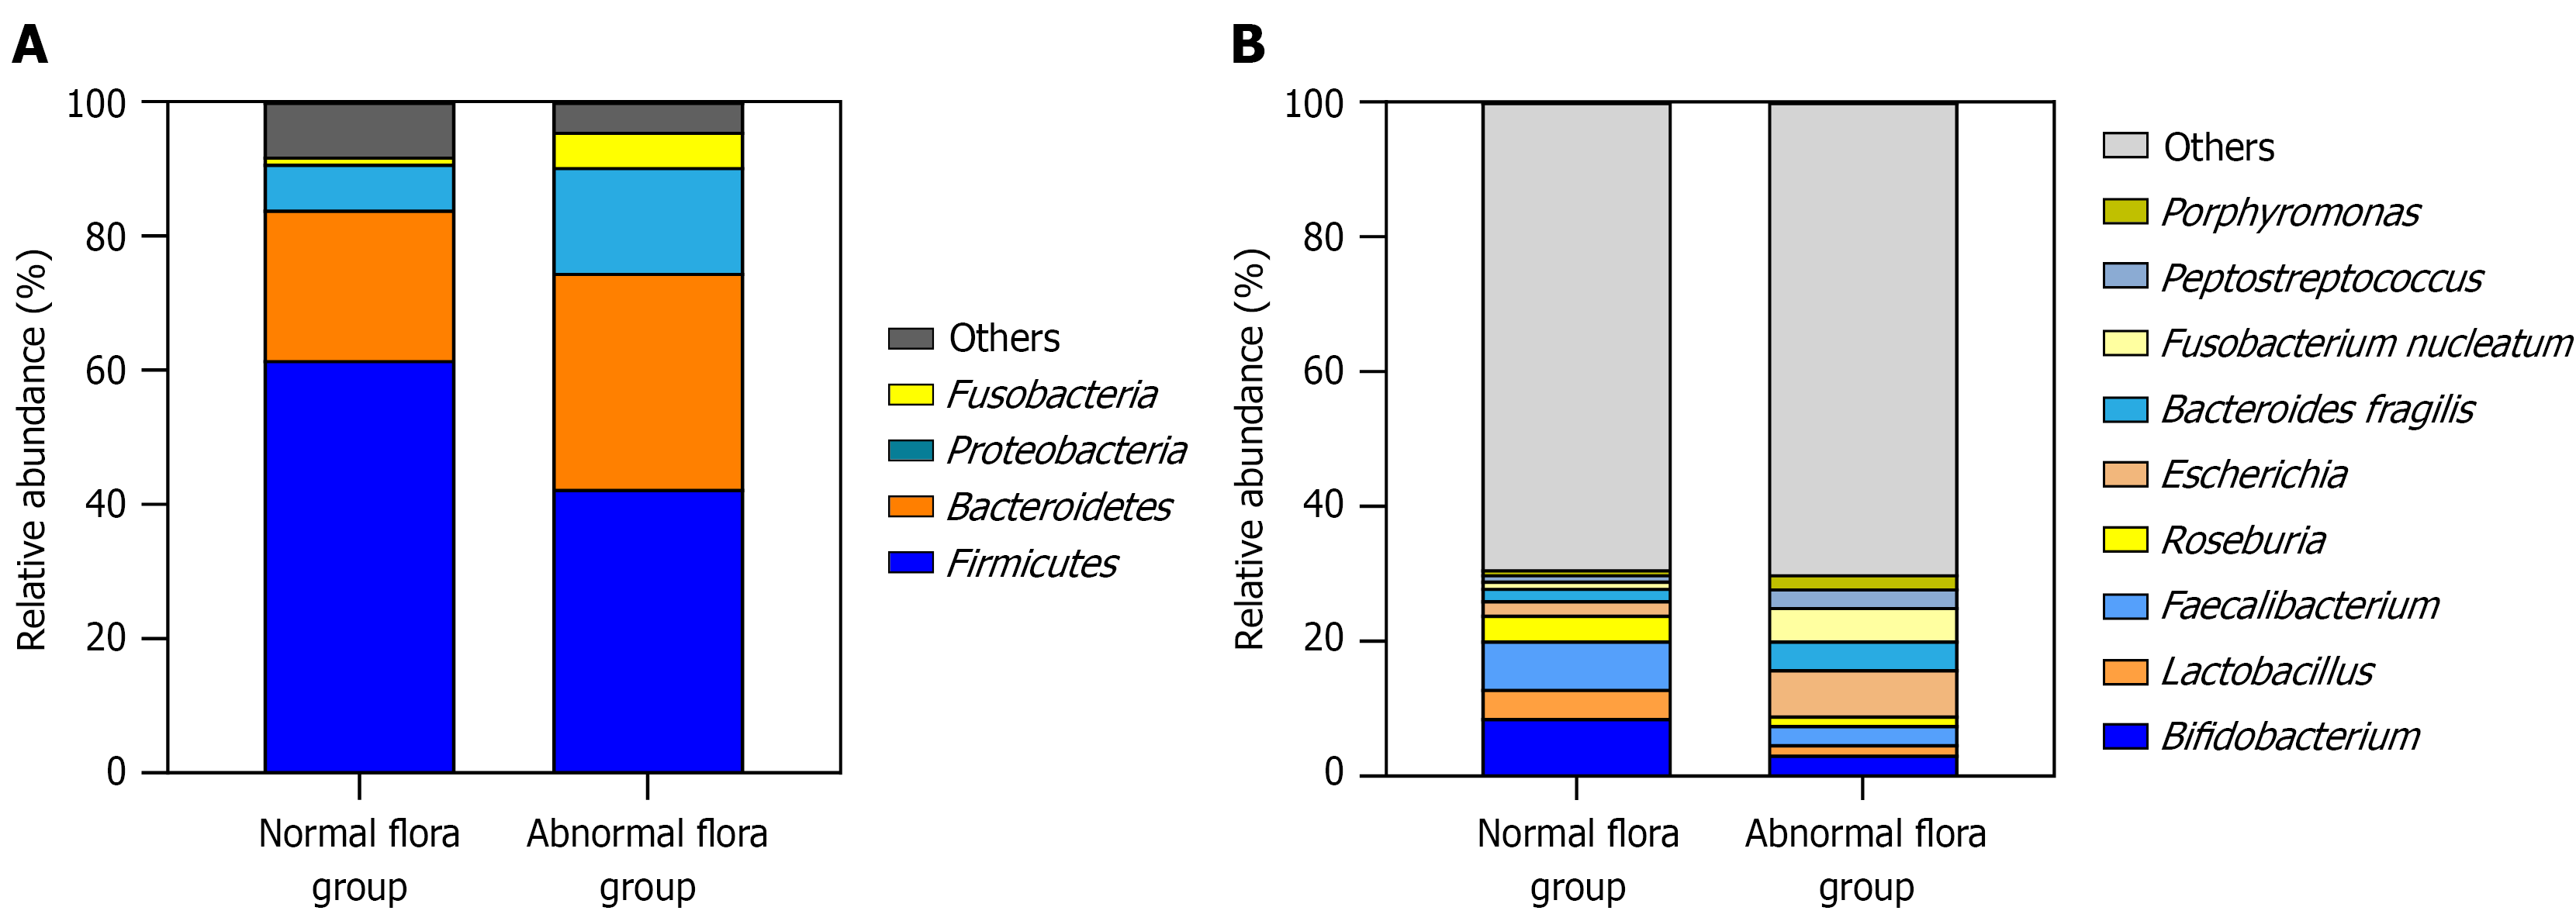
Figure 3 Stacked plots of relative abundance of gut microbiota between the two groups.
A: Phylum-level species composition; B: Genus-level species composition.
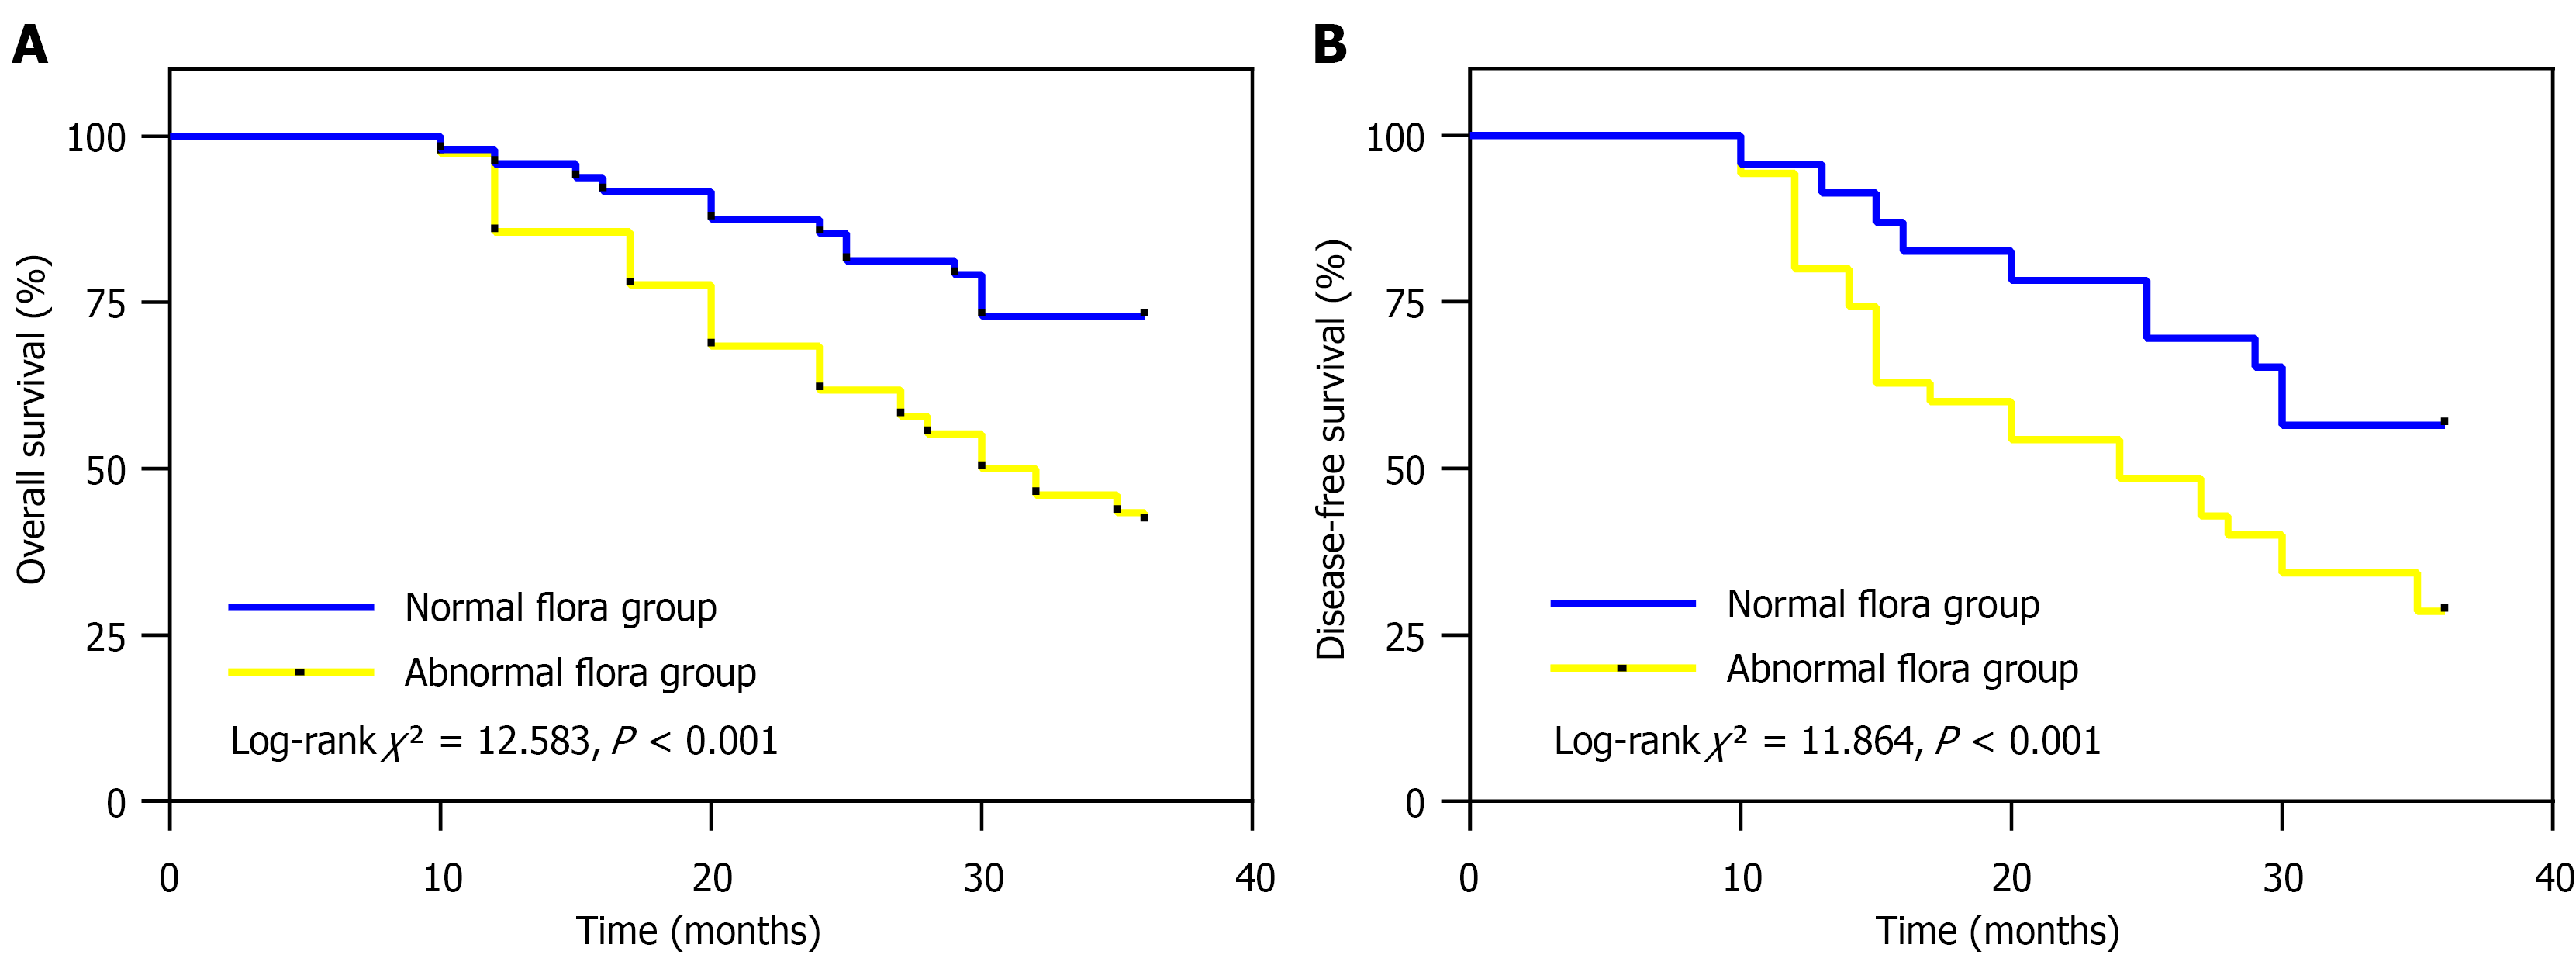
Figure 4 Kaplan-Meier survival curves of patients in the two groups.
A: Overall survival (n = 124); B: Disease-free survival (n = 72).
- Citation: Wang Y, Dong YW, Wang Y, Jin YY, Zhou YX, Li Y. Association between gut microbial dysbiosis and clinical prognosis of advanced colorectal cancer. World J Gastrointest Oncol 2026; 18(10): 122497
- URL: https://www.wjgnet.com/1948-5204/full/v18/i10/122497.htm
- DOI: https://dx.doi.org/10.4251/wjgo.122497