Copyright
©The Author(s) 2025.
World J Gastrointest Oncol. Aug 15, 2025; 17(8): 108484
Published online Aug 15, 2025. doi: 10.4251/wjgo.v17.i8.108484
Published online Aug 15, 2025. doi: 10.4251/wjgo.v17.i8.108484
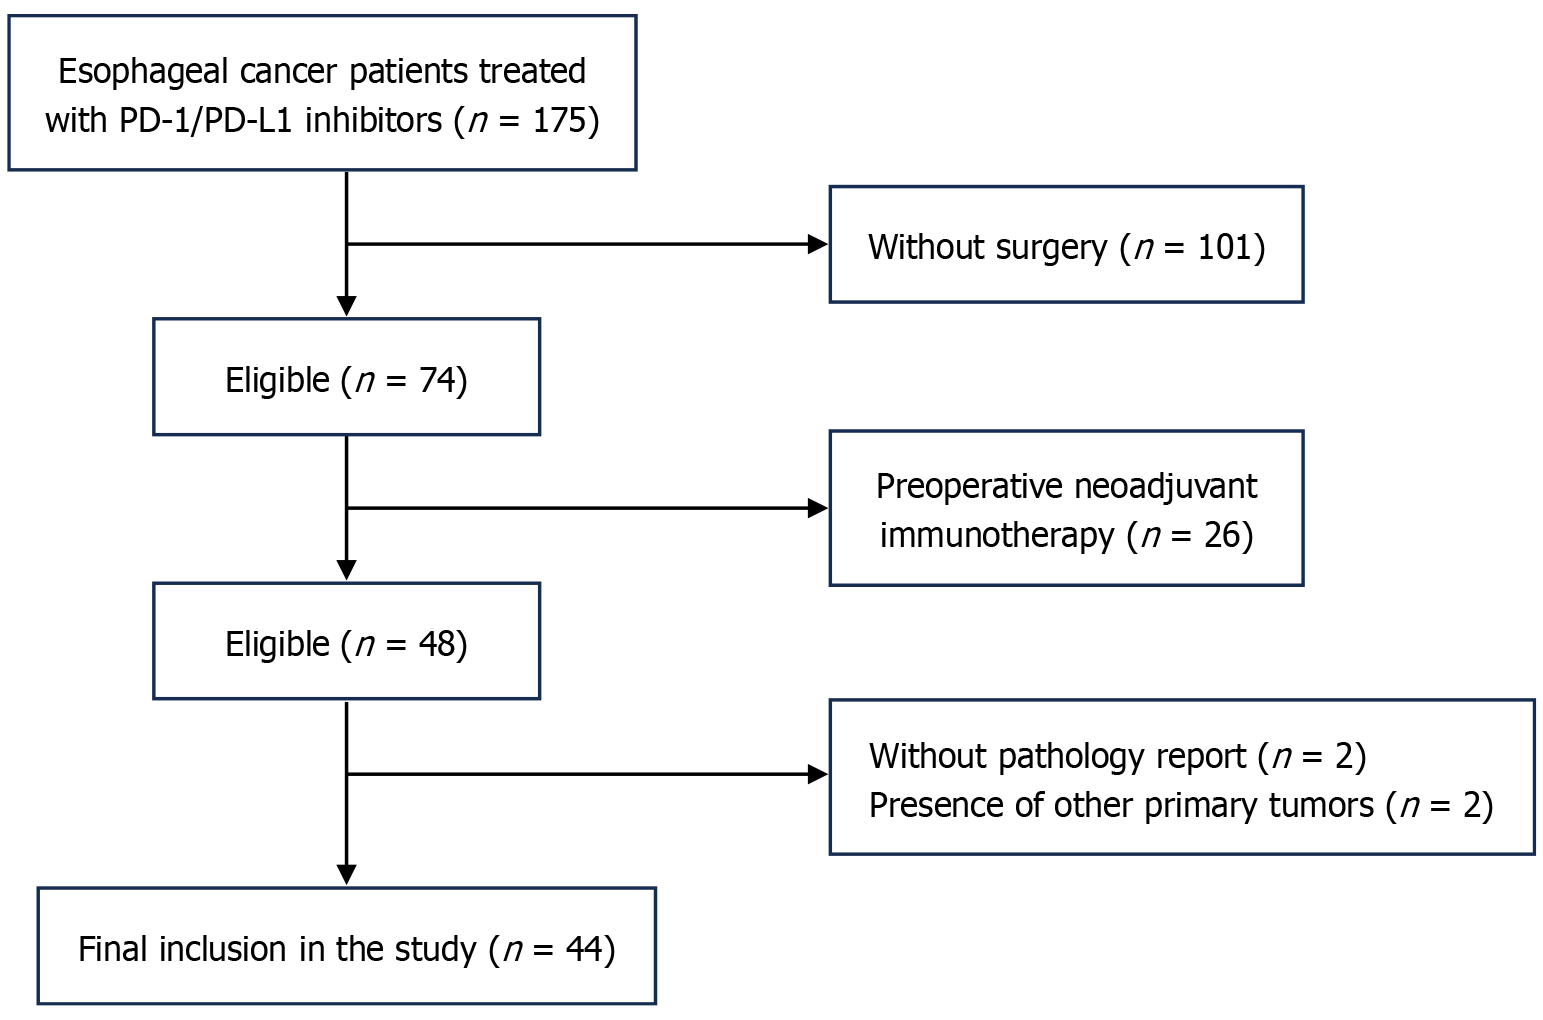
Figure 1
Patient screening flowchart.
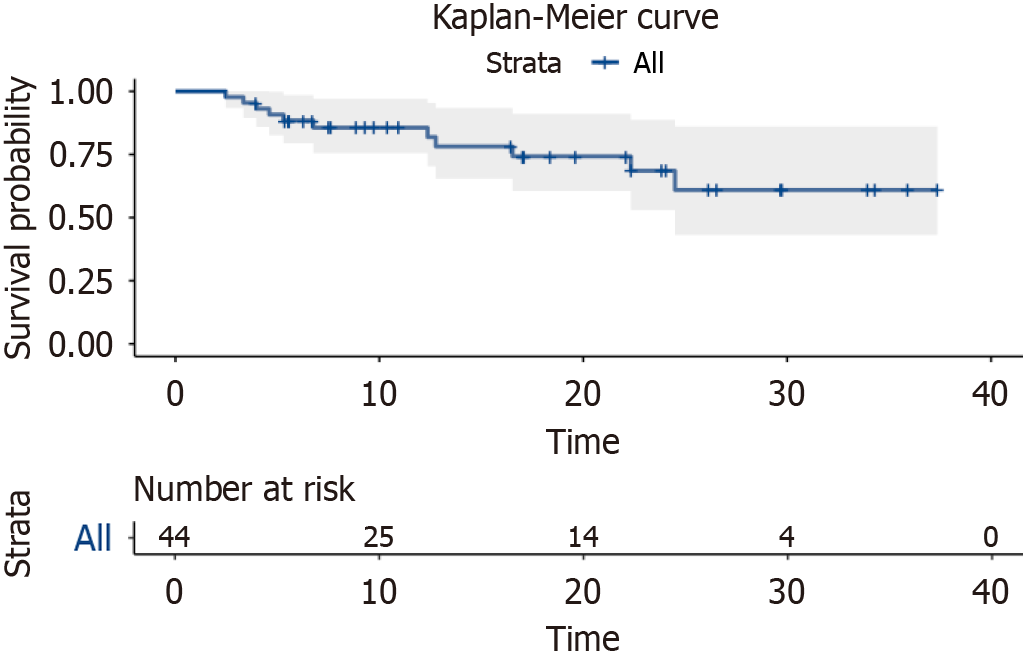
Figure 2
Kaplan-Meier curves for progression-free survival in the overall population.
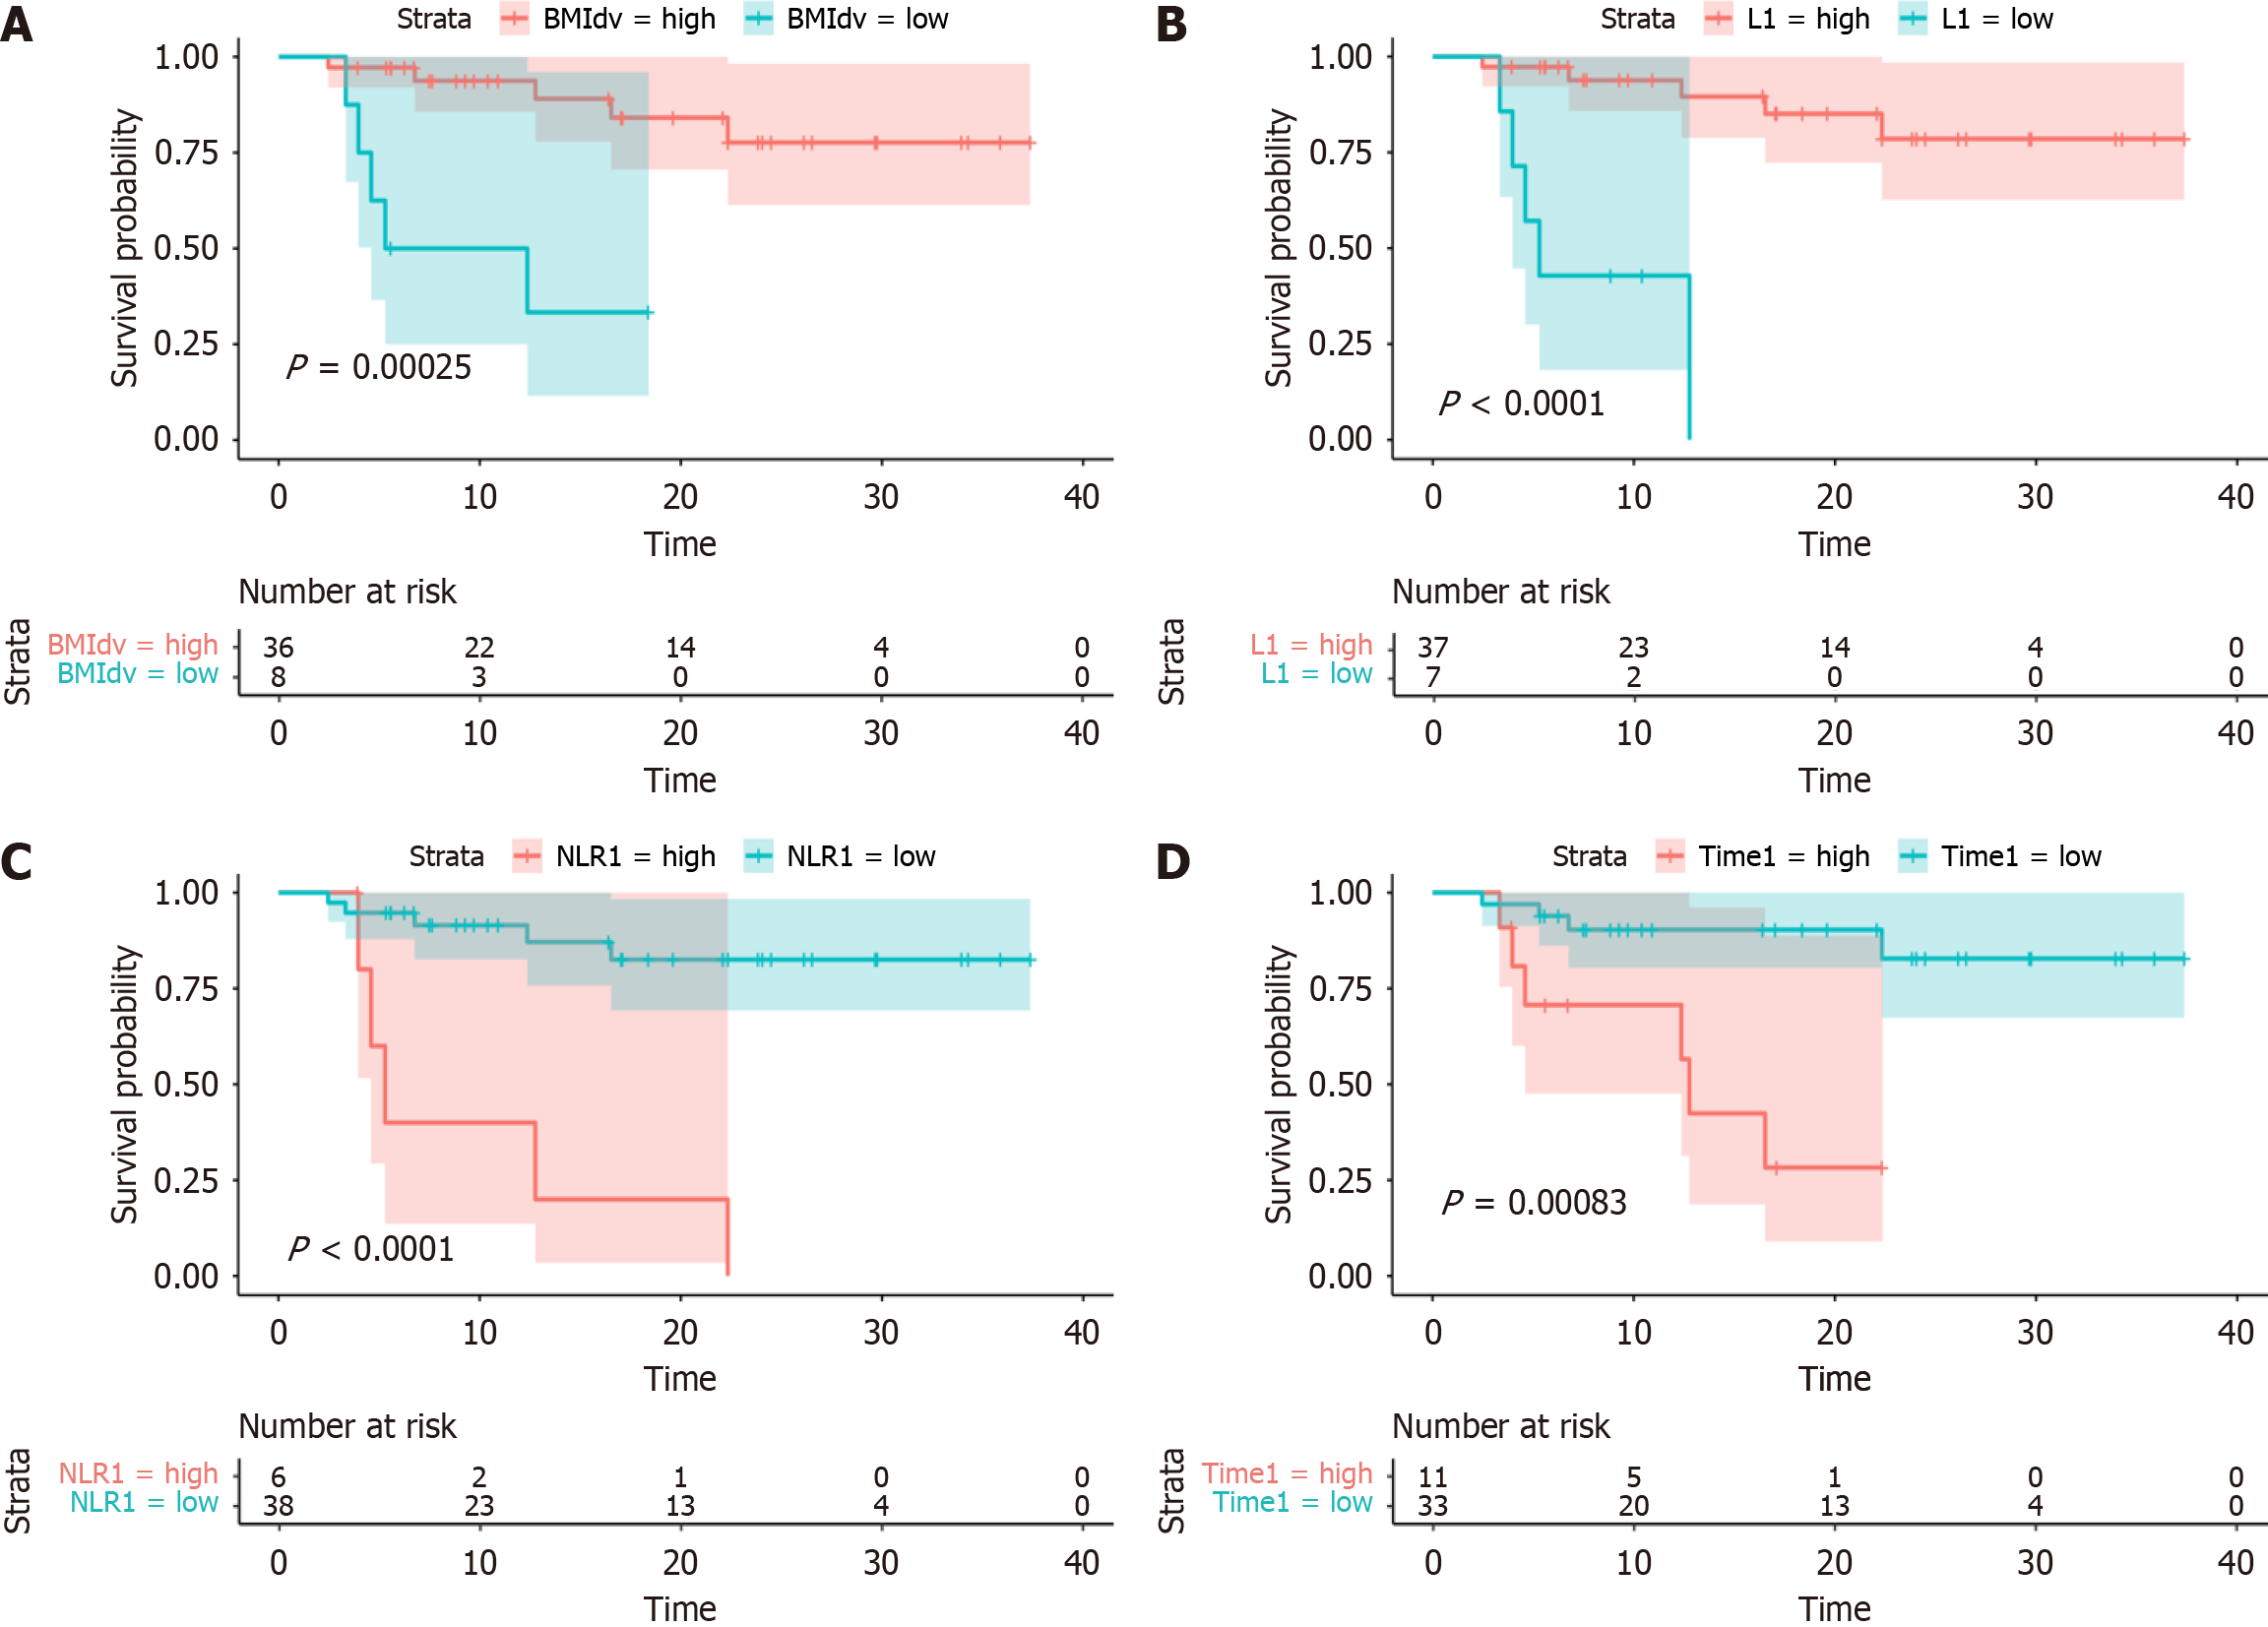
Figure 3 Progression-free survival curves for populations of each variable.
A: Body mass index difference; B: Preoperative lymphocyte count; C: Preoperative neutrophil-to-lymphocyte ratio; D: Time interval between surgery and start of first immunotherapy. NLR: Ratio of neutrophils to lymphocytes; L1: Preoperative lymphocyte count; dv: Difference between the index at the beginning of the first immunotherapy minus the index before surgery; BMI: Body mass index.
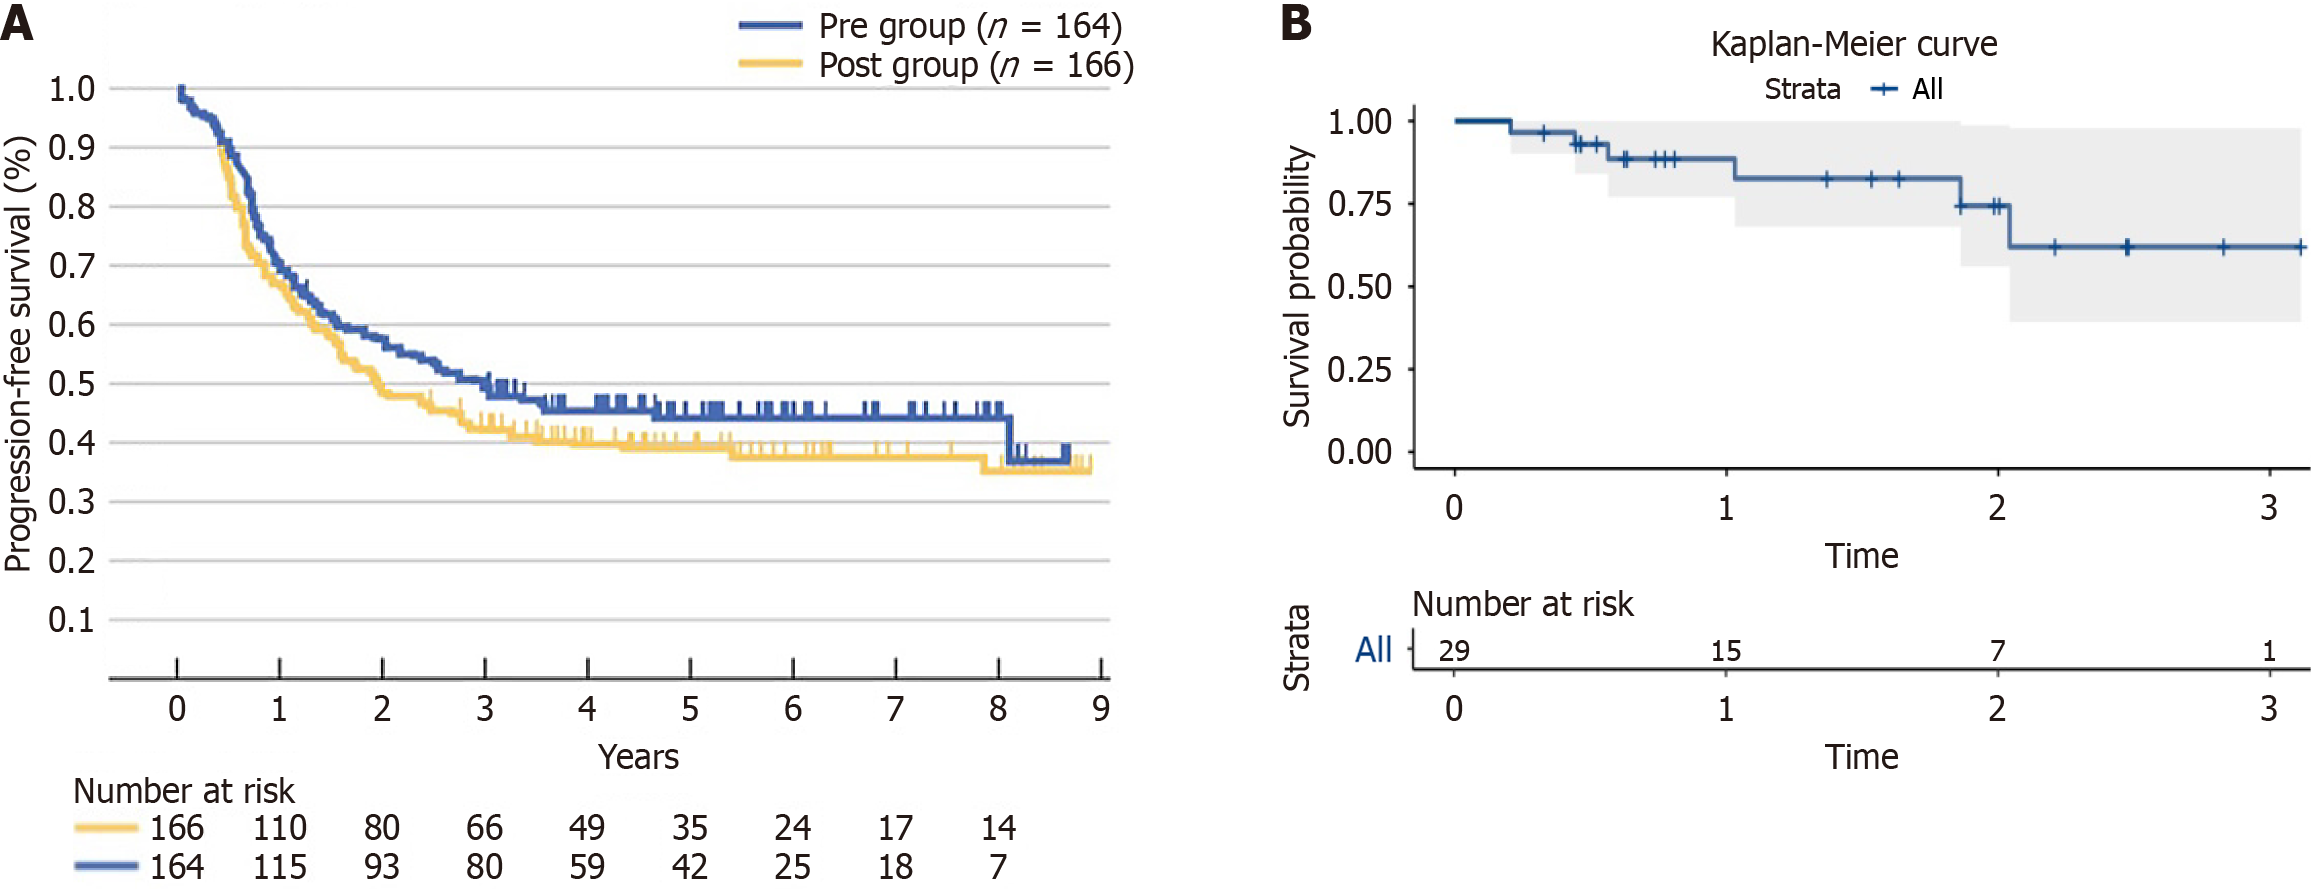
Figure 4 Kaplan-Meier curve comparison.
A: JCOG9907 trail; B: This study.
- Citation: Li LY, Zhang MQ, Ying WM, Zhang WZ, Jiang WJ, Xiong TJ, Wang FM, Fu ZC. Postoperative adjuvant PD-1 immunotherapy survival and body-mass-index dynamics in esophageal cancer: A real-world retrospective study. World J Gastrointest Oncol 2025; 17(8): 108484
- URL: https://www.wjgnet.com/1948-5204/full/v17/i8/108484.htm
- DOI: https://dx.doi.org/10.4251/wjgo.v17.i8.108484


