Copyright
©The Author(s) 2025.
World J Gastrointest Oncol. Aug 15, 2025; 17(8): 106783
Published online Aug 15, 2025. doi: 10.4251/wjgo.v17.i8.106783
Published online Aug 15, 2025. doi: 10.4251/wjgo.v17.i8.106783
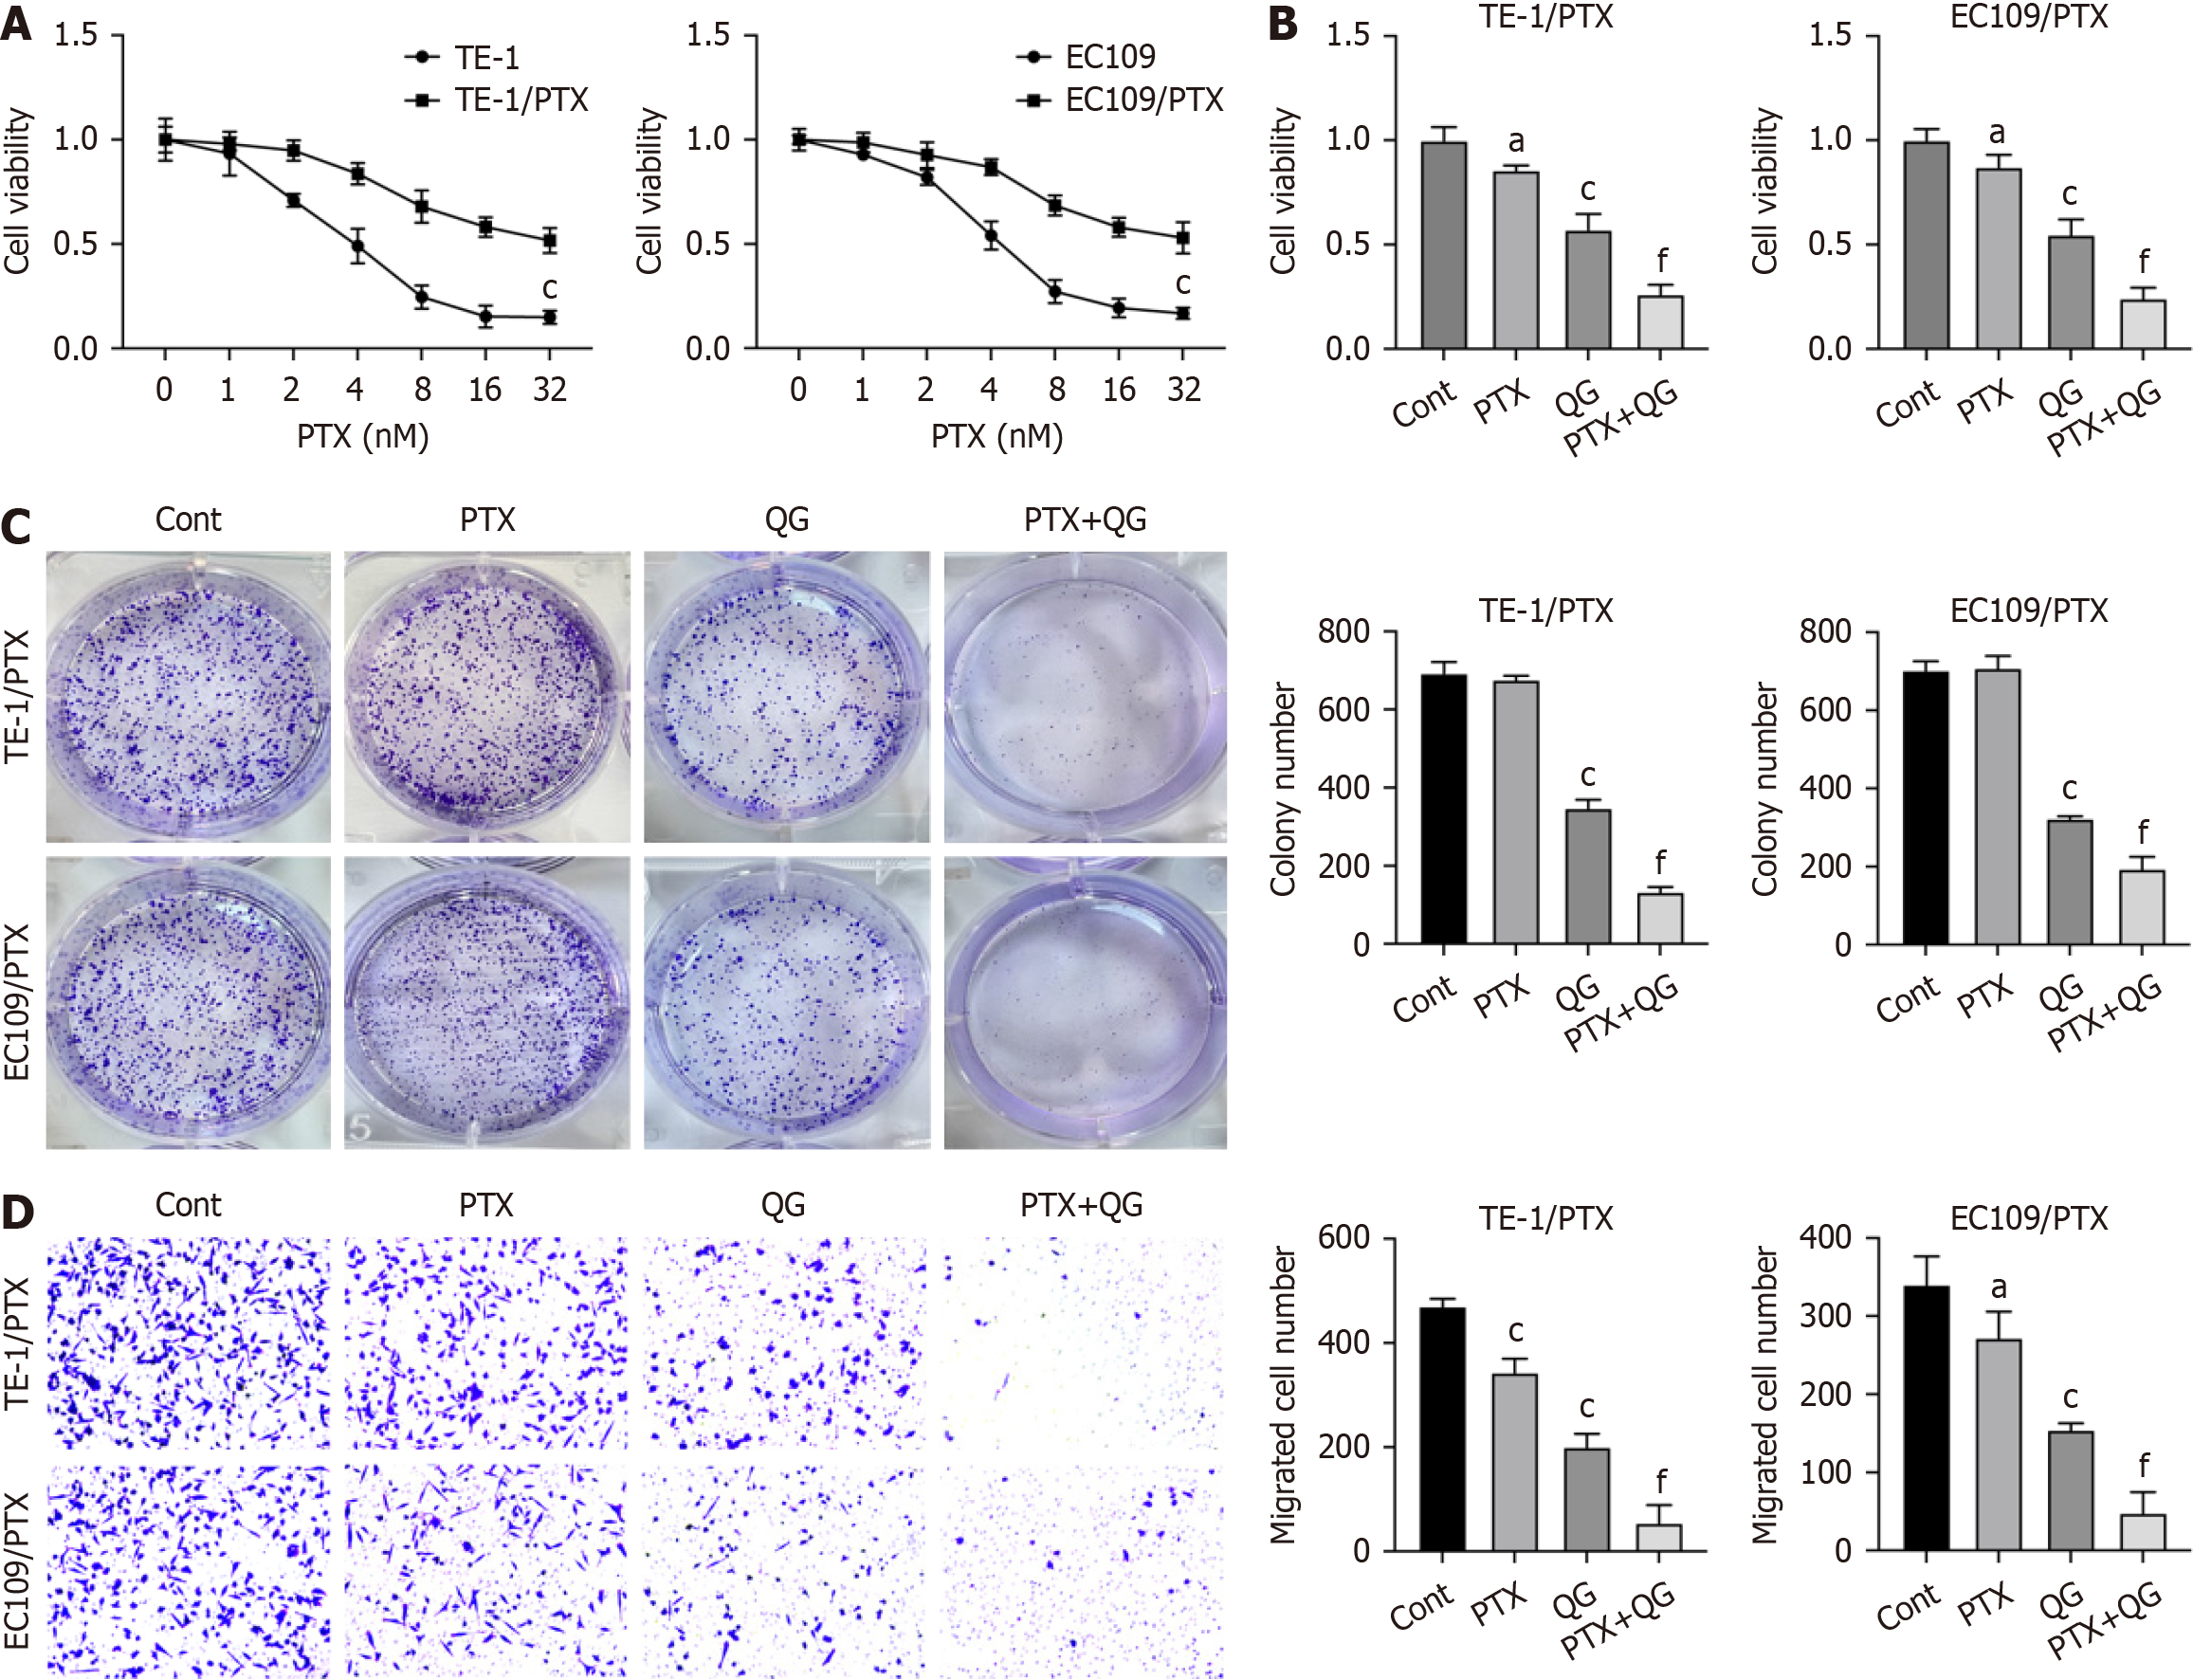
Figure 1 Qige San regulated paclitaxel resistance in esophageal cancer.
A: The viability of TE-1/paclitaxel (PTX) and EC109/PTX and parental cancer cells treated with PTX; B: Viability of TE-1/PTX and EC109/PTX cells that treated with PTX and Qige San (QG); C: Proliferation of TE-1/PTX and EC109/PTX cells that treated with PTX and QG; D: Migration of TE-1/PTX and EC109/PTX cells that treated with PTX and QG. Data are mean ± standard error of the mean (n = 3). aP < 0.05; cP < 0.001 vs control; fP < 0.001 vs QG (one-way analysis of variance with Tukey’s test); QG: Qige San; PTX: Paclitaxel; Cont: Control.
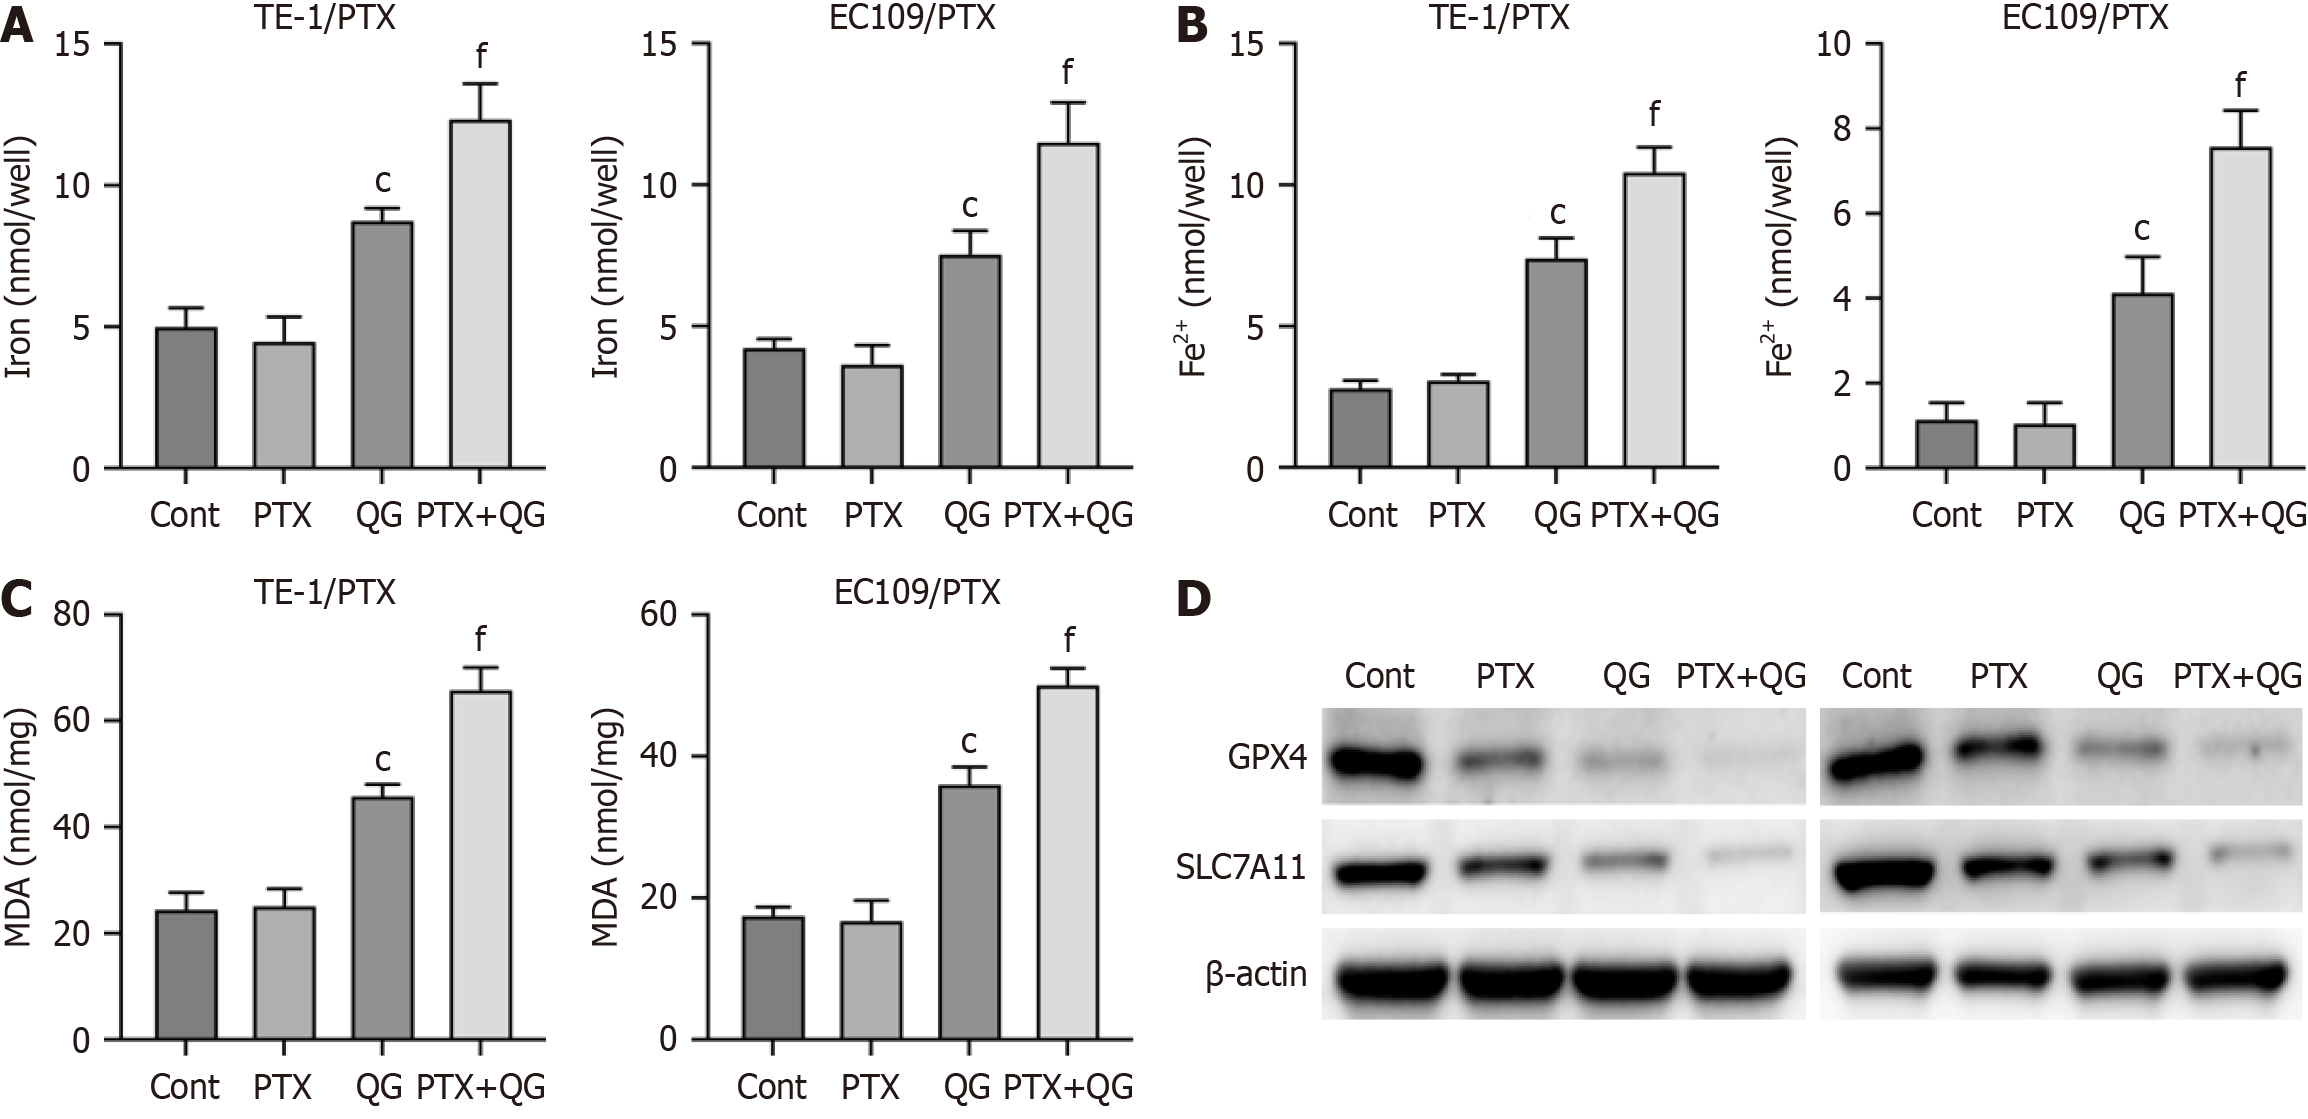
Figure 2 Qige San regulates ferroptosis in esophageal cancer.
A: Level of total iron; B: Level of Fe2+; C: Level of malondialdehyde; D: Protein expression of glutathione peroxidase 4 and SLC7A11. Data are mean ± standard error of the mean (n = 3). cP < 0.001 vs control; fP < 0.001 vs Qige San (one-way analysis of variance with Tukey’s test); QG: Qige San; PTX: Paclitaxel; Cont: Control; MDA: Malondialdehyde; GPX4: Glutathione peroxidase 4.
Figure 3 Network pharmacological analysis of potential targeted signaling pathways of Qige San in esophageal cancer.
A: Active compounds and target genes identified by Traditional Chinese Medicine Systems Pharmacology database; B: Overlapped genes of disease targets from GeneCards, Therapeutic Target Database, and Online Mendelian Inheritance in Man database; C: Overlapped genes of disease targets and drug targets; D: Gene Ontology analysis of the overlapped genes; E: Kyoto Encyclopedia of Genes and Genomes analysis of the overlapped genes; F: HALLMARK analysis of the overlapped genes; G: REACTOME analysis of the overlapped genes; H: Protein-protein interaction analysis of the overlapped genes; I: Gene Ontology analysis of the connected genes; J: Kyoto Encyclopedia of Genes and Genomes analysis of the connected genes; K: HALLMARK analysis of the connected genes; L: REACTOME analysis of the connected genes.
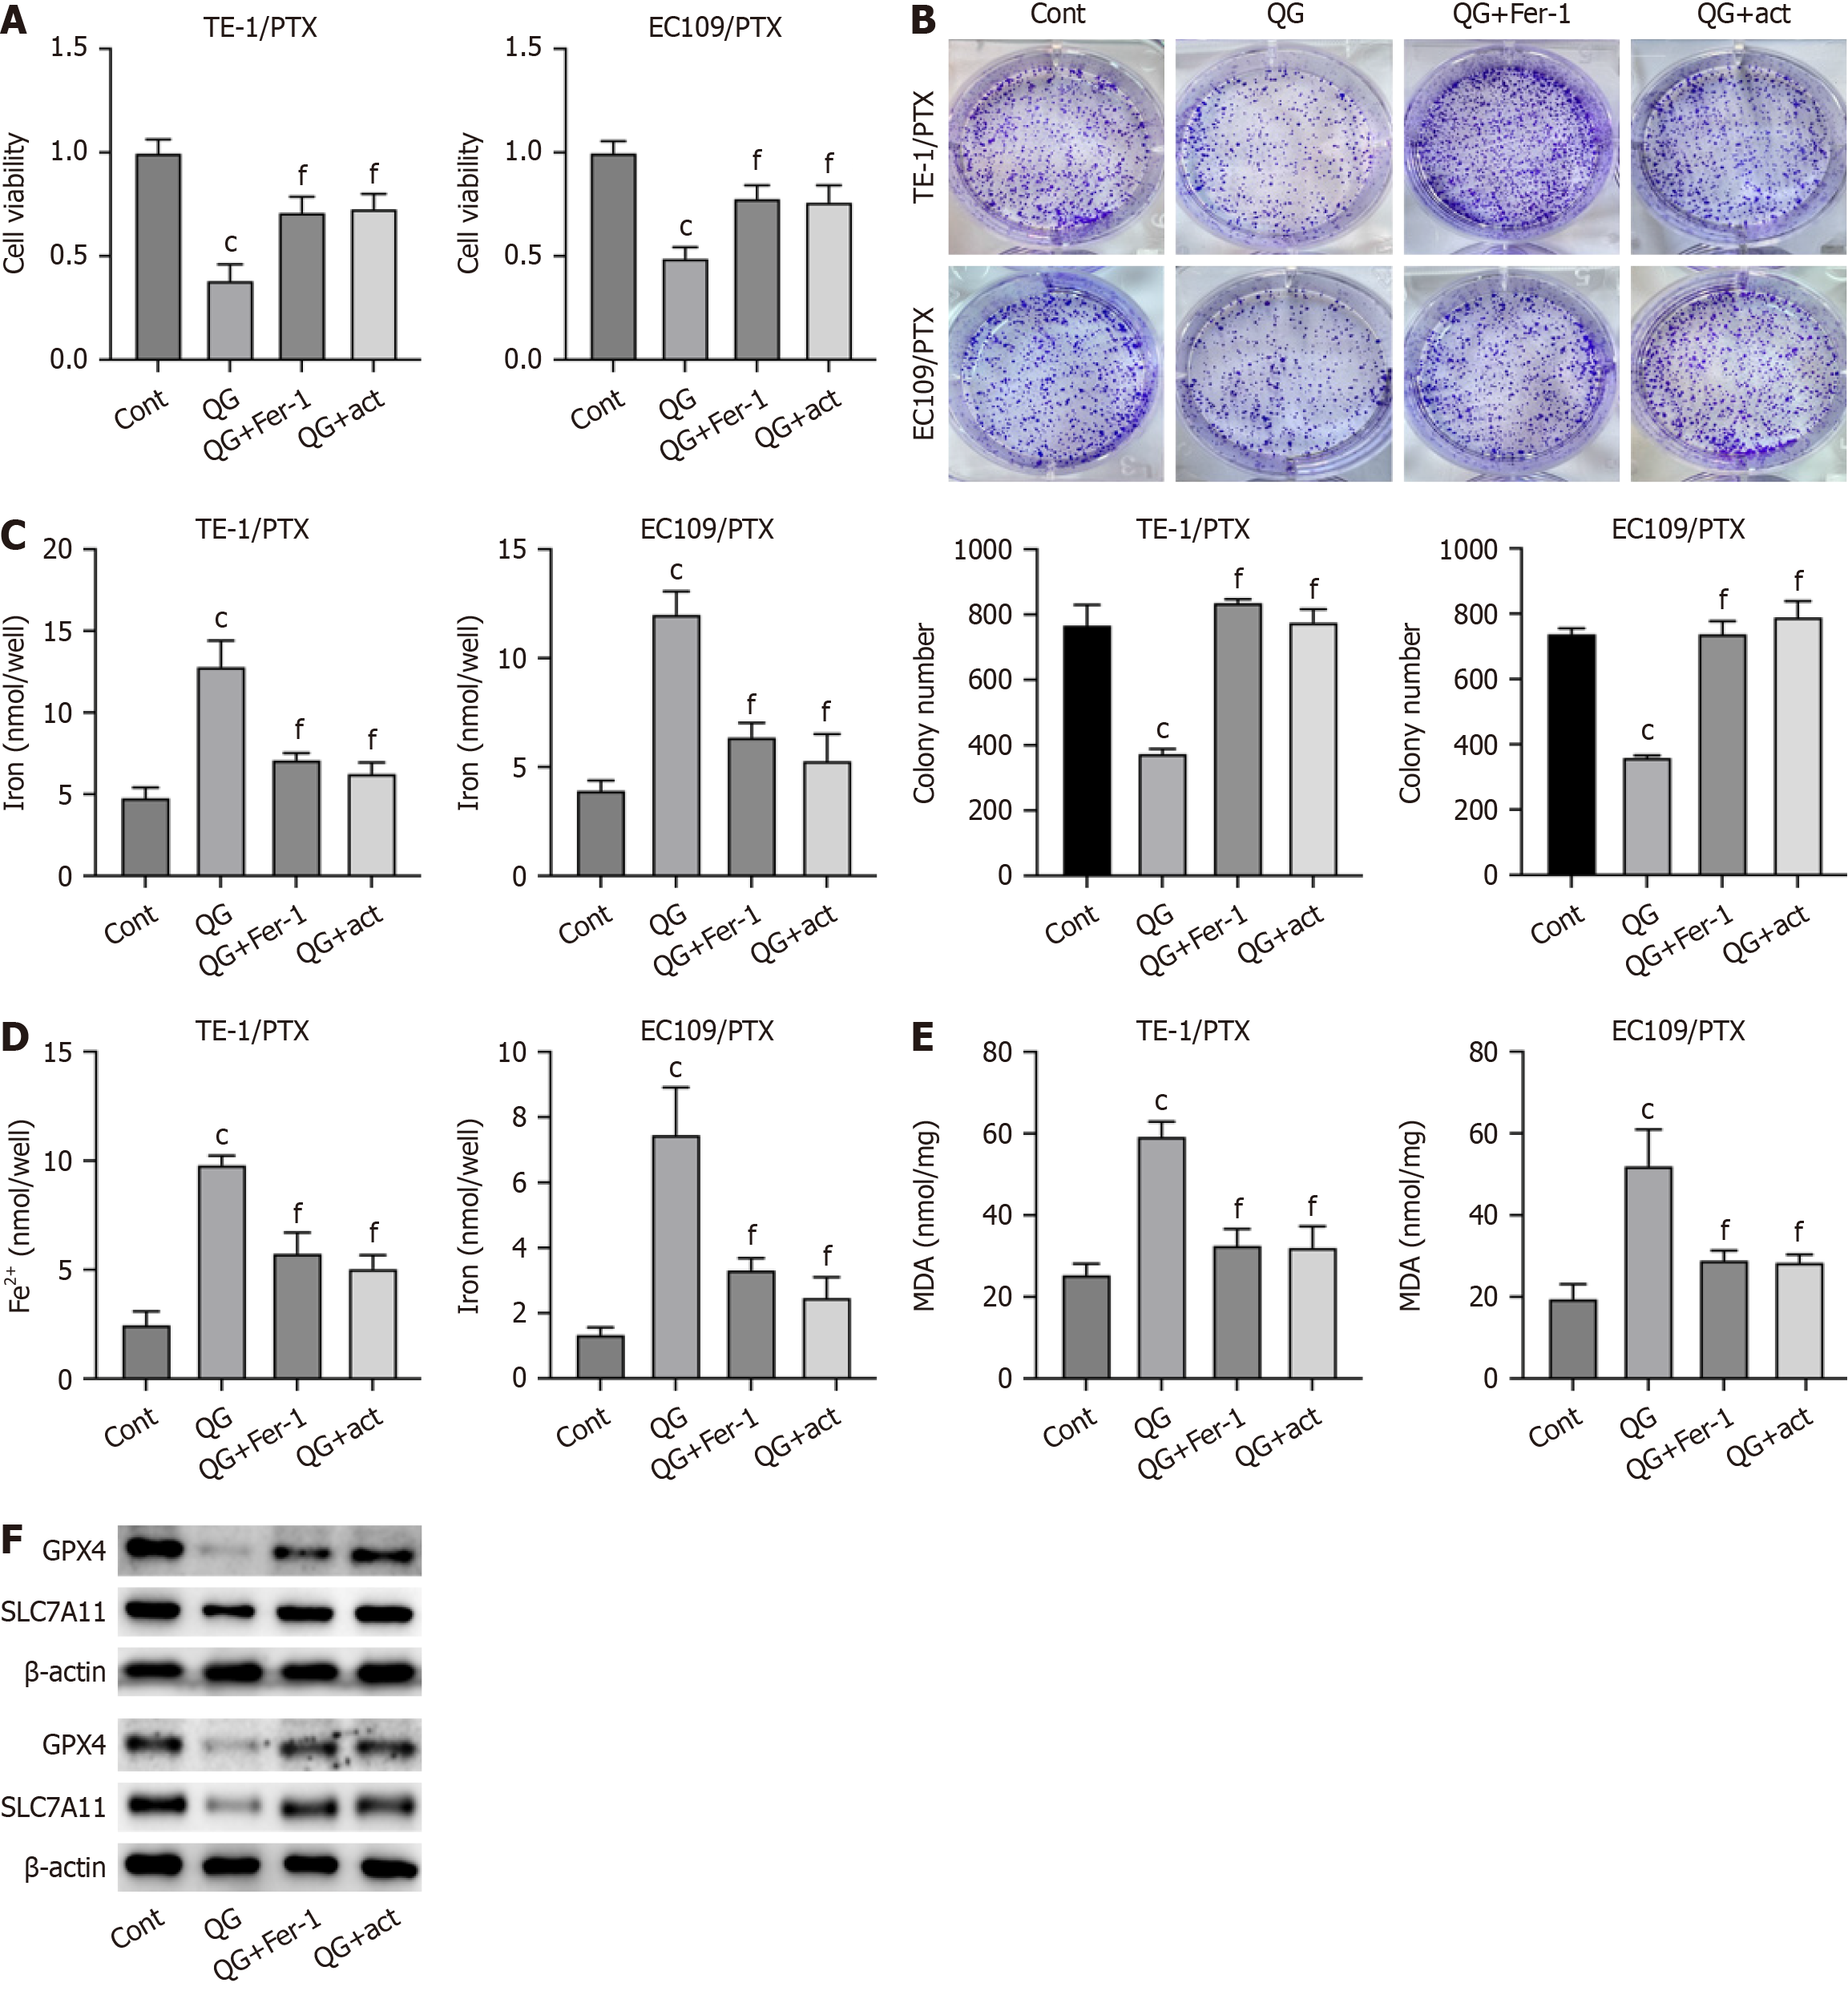
Figure 4 Qige San regulated paclitaxel resistance in esophageal cancer cells by targeting ferroptosis through the Akt signaling pathway.
A: Cell viability was detected by the Cell Counting Kit-8; B: Cell proliferation measured by colony formation assay; C and D: Total iron and Fe2+ level in paclitaxel-resistant esophageal cancer cells; E: Malondialdehyde production in paclitaxel-resistant esophageal cancer cells; F: Protein expression of glutathione peroxidase 4 and SLC7A11. Data are mean ± standard error of the mean (n = 3). cP < 0.001 vs control; fP < 0.001 vs Qige San (one-way analysis of variance with Tukey’s test); QG: Qige San; PTX: Paclitaxel; Cont: Control; MDA: Malondialdehyde; Fer-1: Ferroptosis inhibitor; act: PI3K activator; GPX4: Glutathione peroxidase 4.
- Citation: Song J, Guo WY, Sun LB. Qige San regulates paclitaxel resistance in esophageal cancer by targeting ferroptosis. World J Gastrointest Oncol 2025; 17(8): 106783
- URL: https://www.wjgnet.com/1948-5204/full/v17/i8/106783.htm
- DOI: https://dx.doi.org/10.4251/wjgo.v17.i8.106783


