Copyright
©The Author(s) 2025.
World J Gastrointest Oncol. Jul 15, 2025; 17(7): 105723
Published online Jul 15, 2025. doi: 10.4251/wjgo.v17.i7.105723
Published online Jul 15, 2025. doi: 10.4251/wjgo.v17.i7.105723
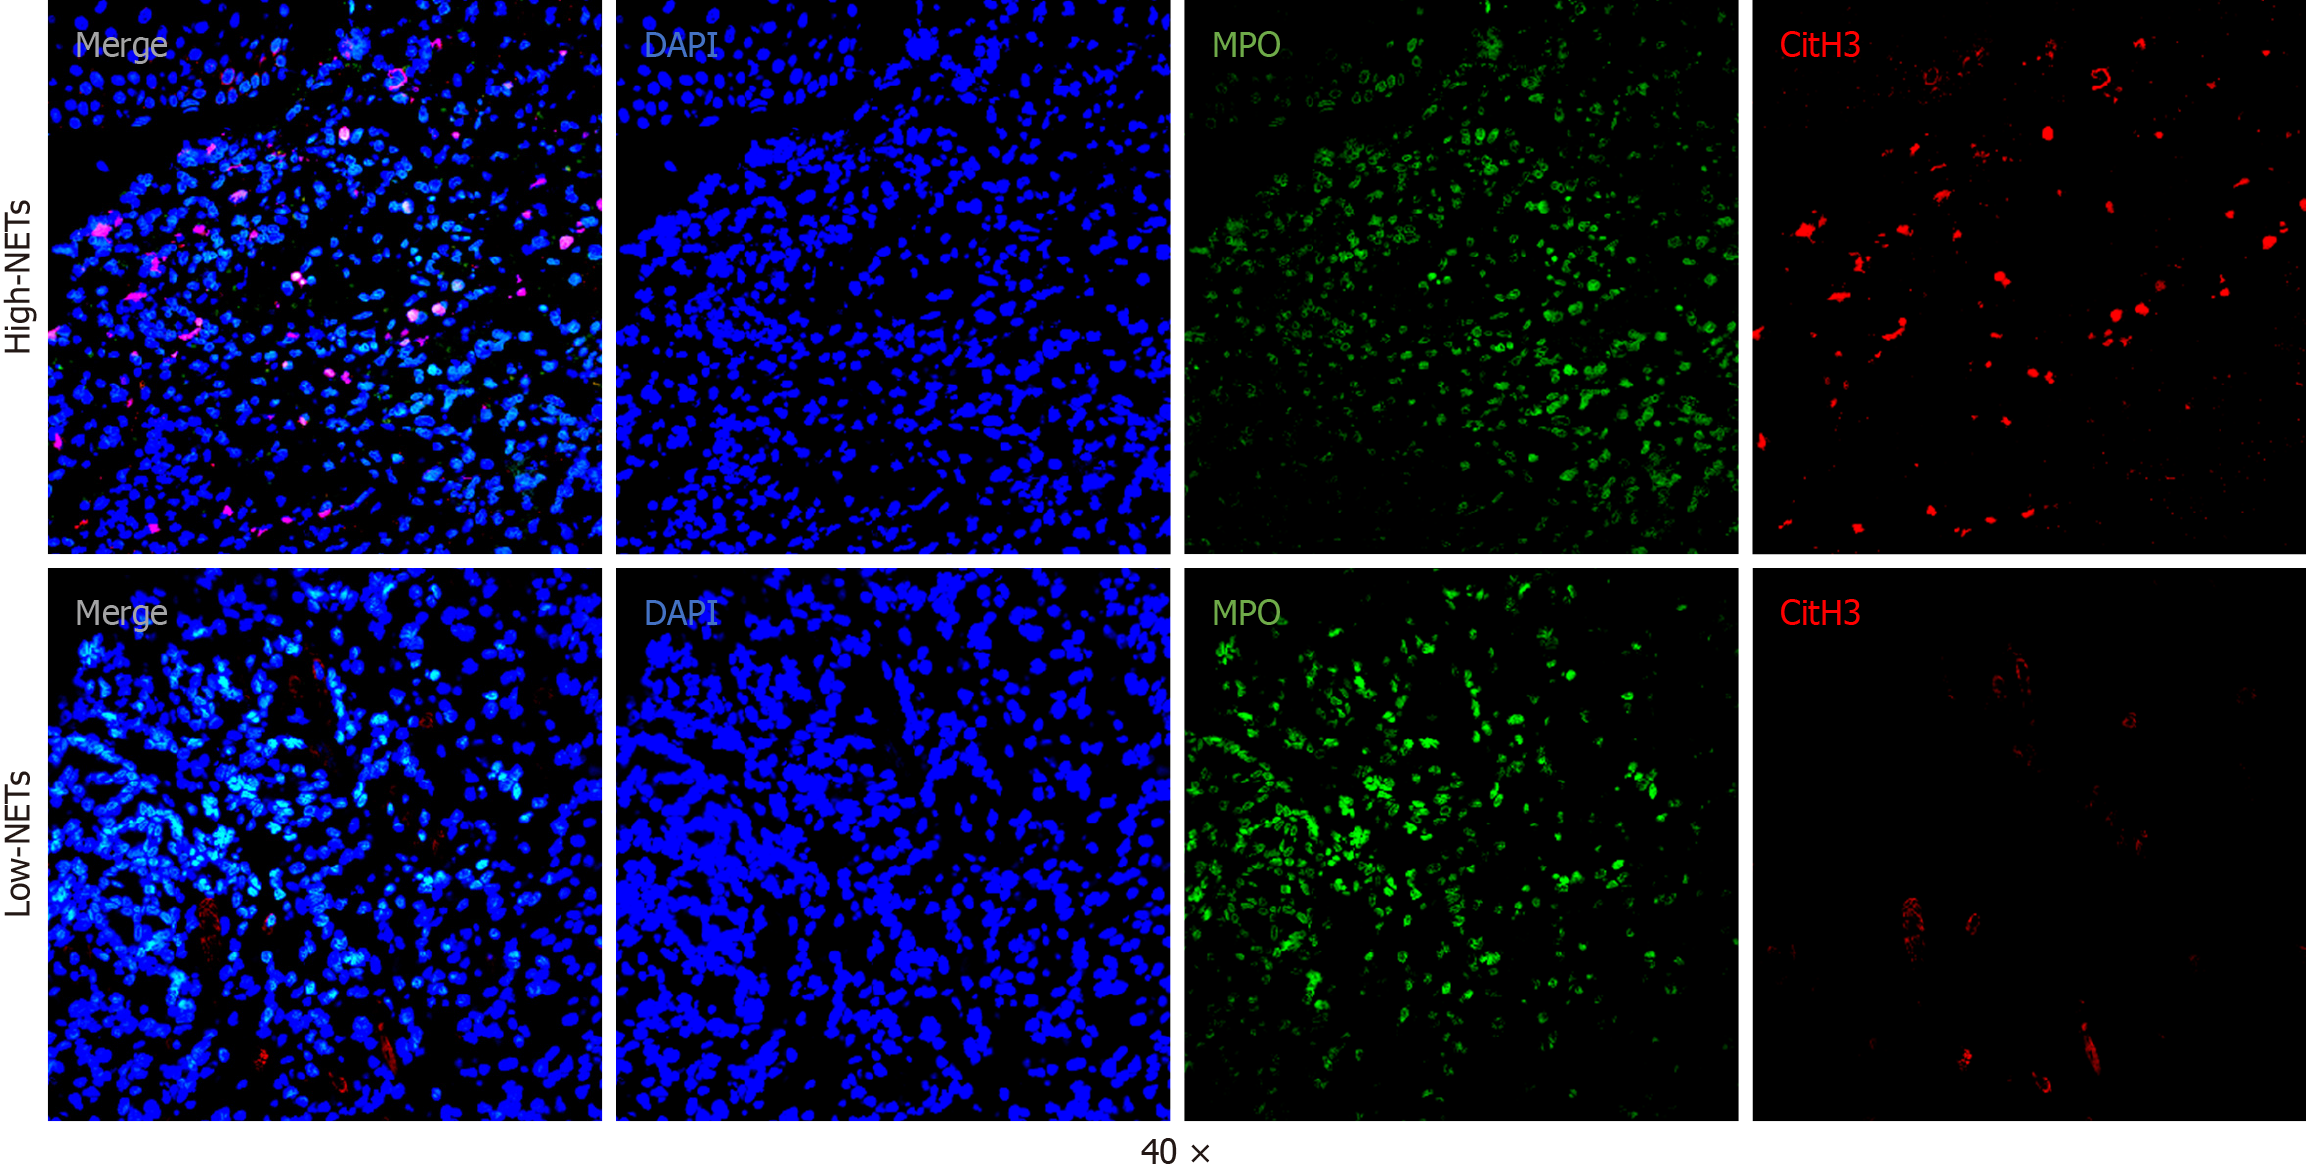
Figure 1 Representative images of immunofluorescence staining of high neutrophil extracellular trap density (upper panel) and low neutrophil extracellular trap density (lower panel) in locally advanced gastric cancer samples without neoadjuvant therapy.
Magnification 40 ×. DAPI, Blue; MPO, Green; CitH3, Red. NET: Neutrophil extracellular trap; MPO: Myeloperoxidase.
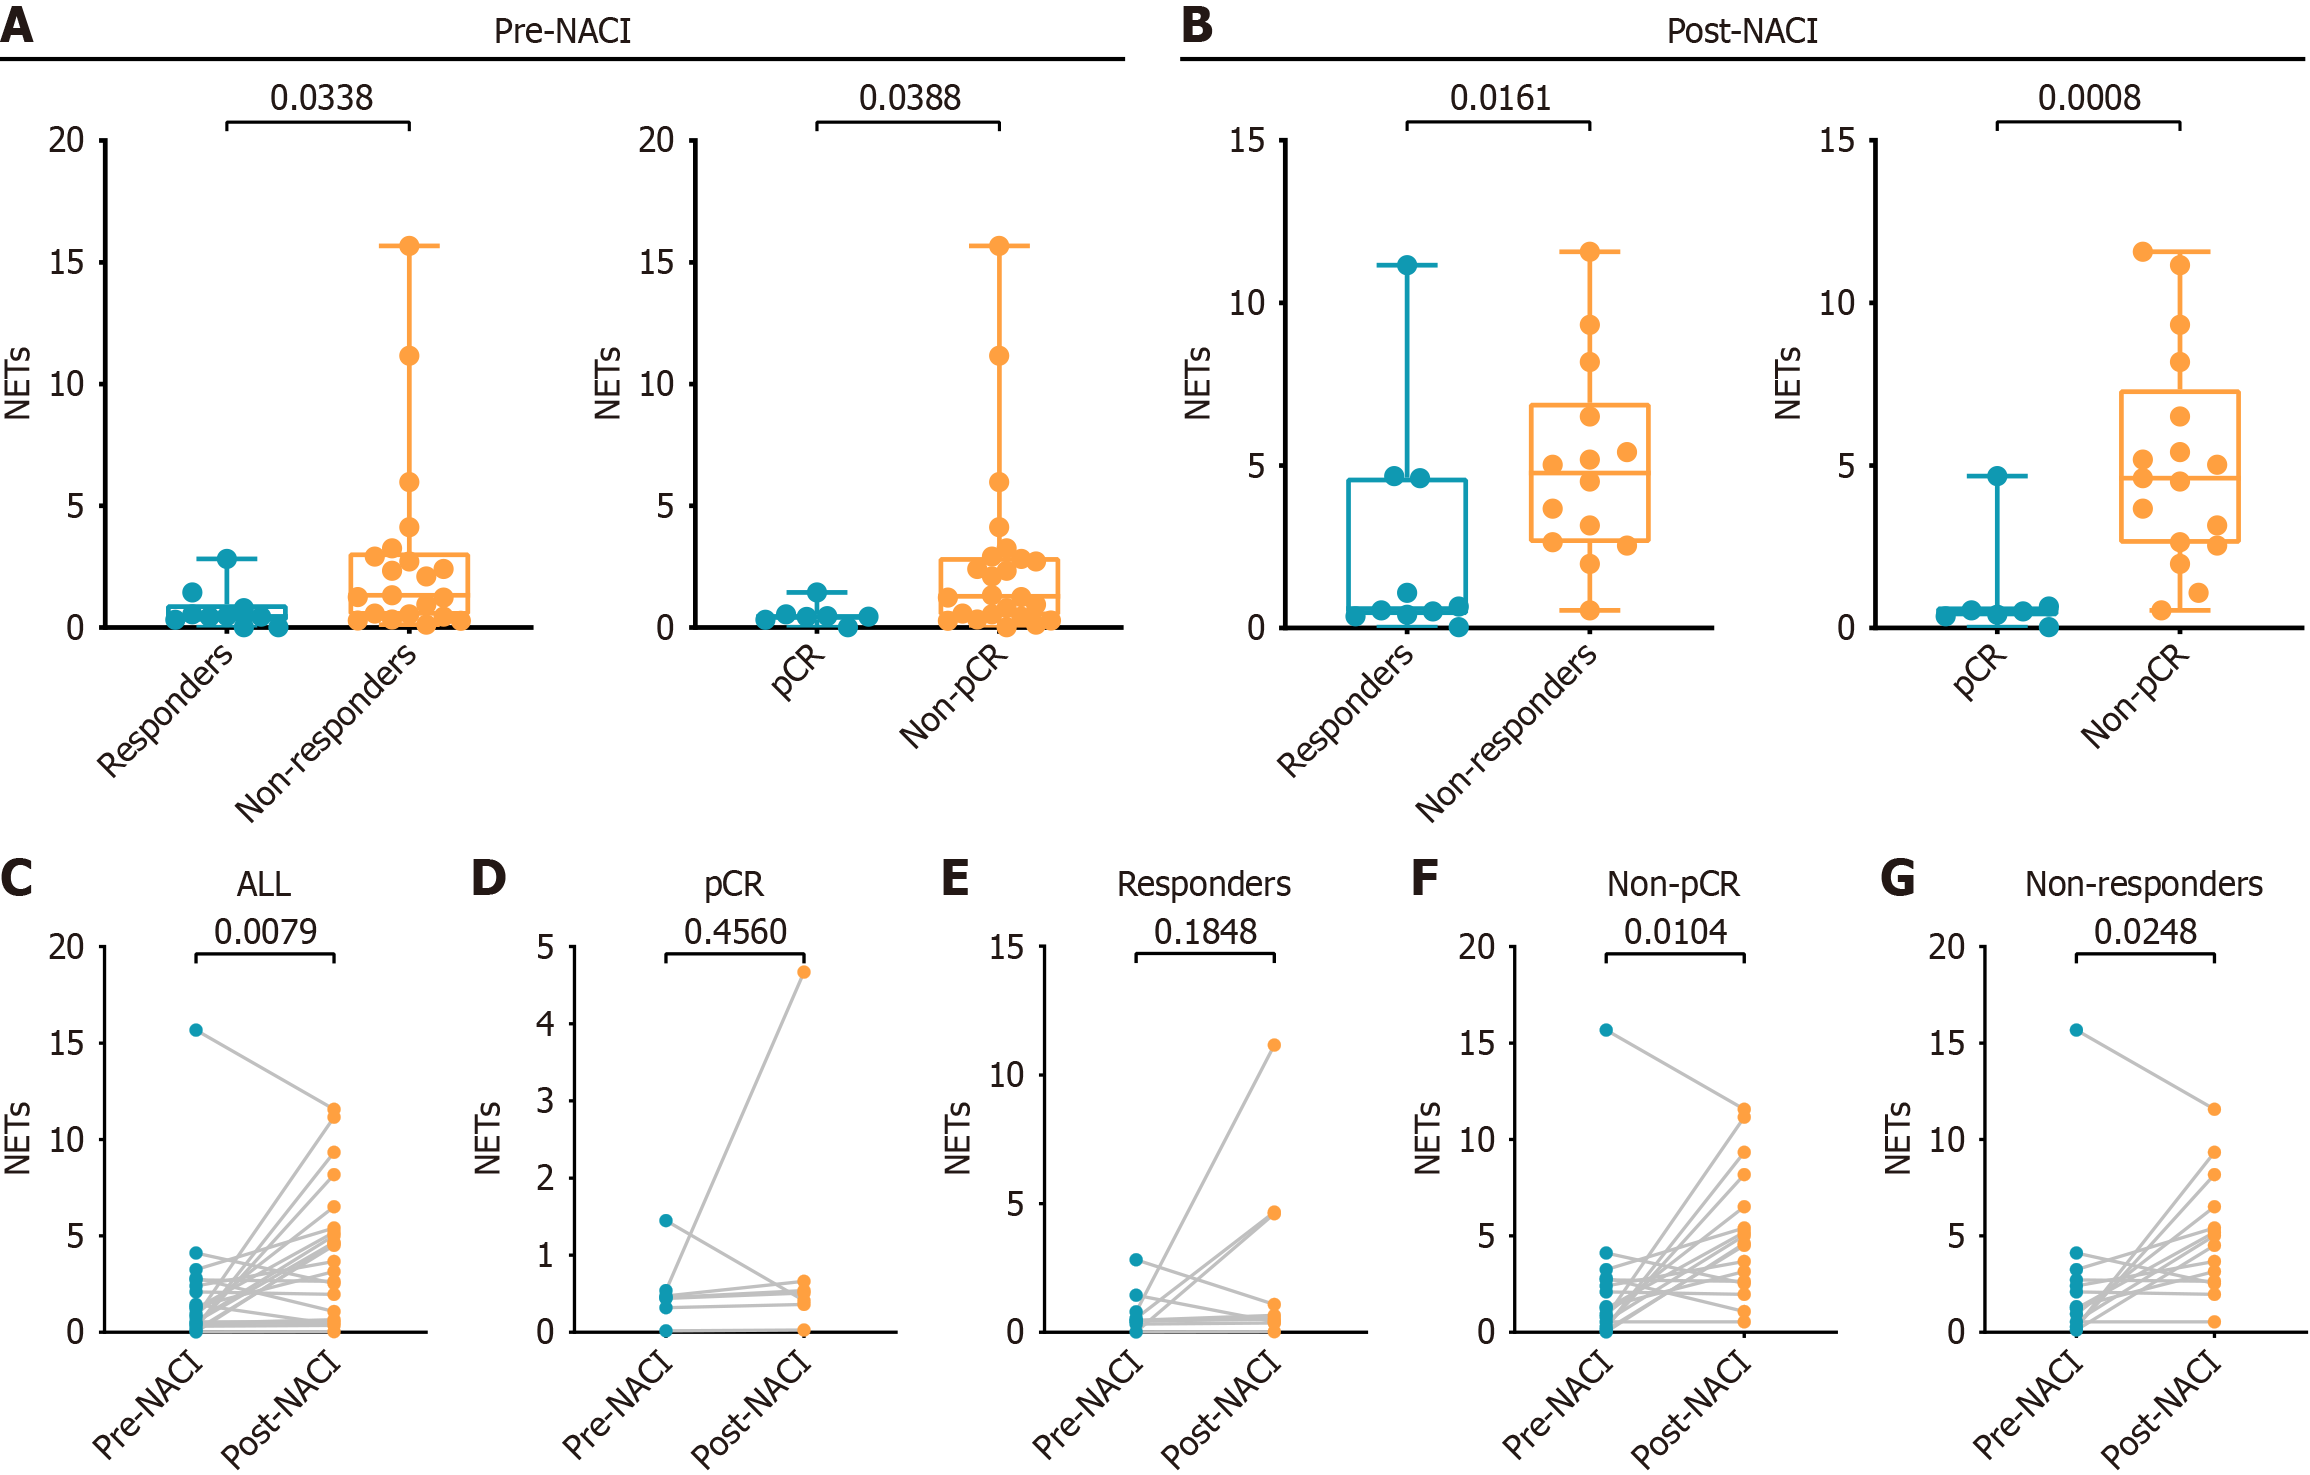
Figure 2 Evaluation of pre-neoadjuvant chemotherapy combined with immunotherapy and post-neoadjuvant chemotherapy combined with immunotherapy neutrophil extracellular traps in association with response to neoadjuvant chemotherapy combined with immunotherapy in locally advanced gastric cancer patients.
A and B: Pre-neoadjuvant chemotherapy combined with immunotherapy (NACI) neutrophil extracellular trap (NETs) and post-NACI NETs according to response to NETs in locally advanced gastric cancer patients treated with NACI; C-G: Differences between pre-NACI NETs and post-NACI NETs between NET-treated responder, nonresponder, pathological complete response (pCR) and non-pCR groups. The plotted values encompass the range from minimum to maximum, with the inclusion of the median. NET: Neutrophil extracellular trap; NACI: Neoadjuvant chemotherapy combined with immunotherapy; pCR: Pathological complete response.
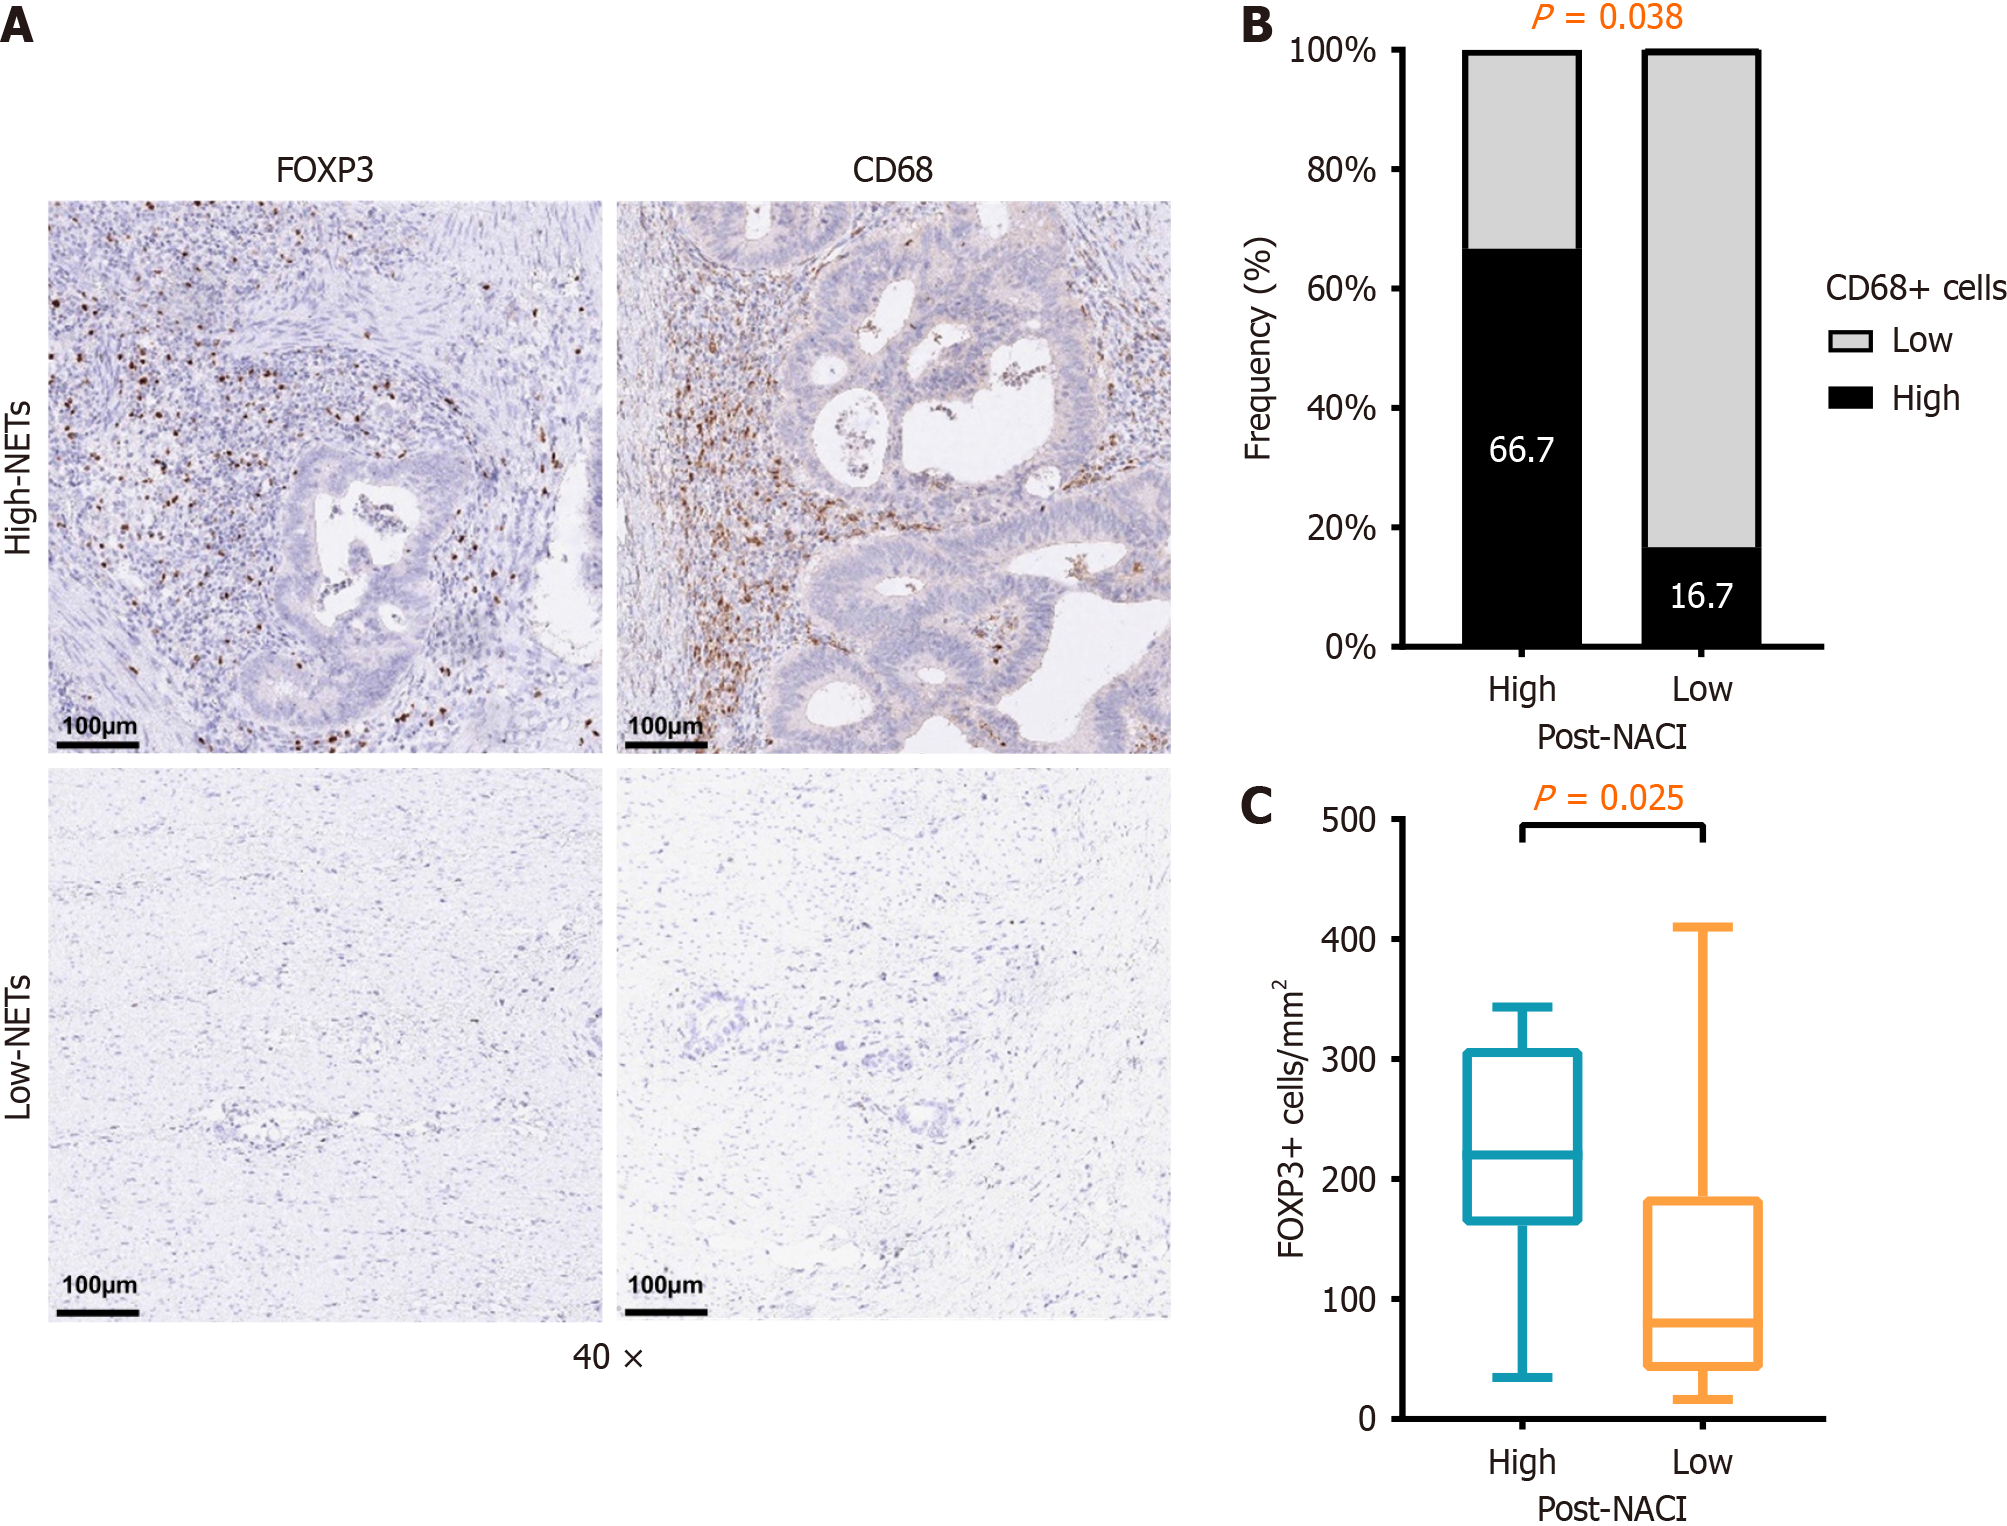
Figure 3 Analysis of the correlation between post-neoadjuvant chemotherapy combined with immunotherapy neutrophil extracellular traps and immunosuppressive cells in locally advanced gastric cancer patients.
A: Representative images of CD68+ macrophages and FOXP3+ regulatory T cells (Tregs) in the High post-neoadjuvant chemotherapy combined with immunotherapy (NACI) and Low post-NACI groups, respectively; B: Comparison of CD68+ macrophage expression levels between the high post-NACI and low post-NACI groups; C: Differences in FOXP3+ Treg expression between the two groups. In the graphs, the plotted values encompass the range from the minimum to the maximum, with the inclusion of the median. NET: Neutrophil extracellular trap; NACI: Neoadjuvant chemotherapy combined with immunotherapy.
- Citation: Lv Y, Li WX, Sun L, Xin LP, Li T, Zhong WT, Zhu HY, An R, Liu AJ, Chen L. Neutrophil extracellular traps predict sensitivity to neoadjuvant chemotherapy combined with immunotherapy in locally advanced gastric cancer. World J Gastrointest Oncol 2025; 17(7): 105723
- URL: https://www.wjgnet.com/1948-5204/full/v17/i7/105723.htm
- DOI: https://dx.doi.org/10.4251/wjgo.v17.i7.105723


