Copyright
©The Author(s) 2025.
World J Gastrointest Oncol. Jun 15, 2025; 17(6): 103198
Published online Jun 15, 2025. doi: 10.4251/wjgo.v17.i6.103198
Published online Jun 15, 2025. doi: 10.4251/wjgo.v17.i6.103198
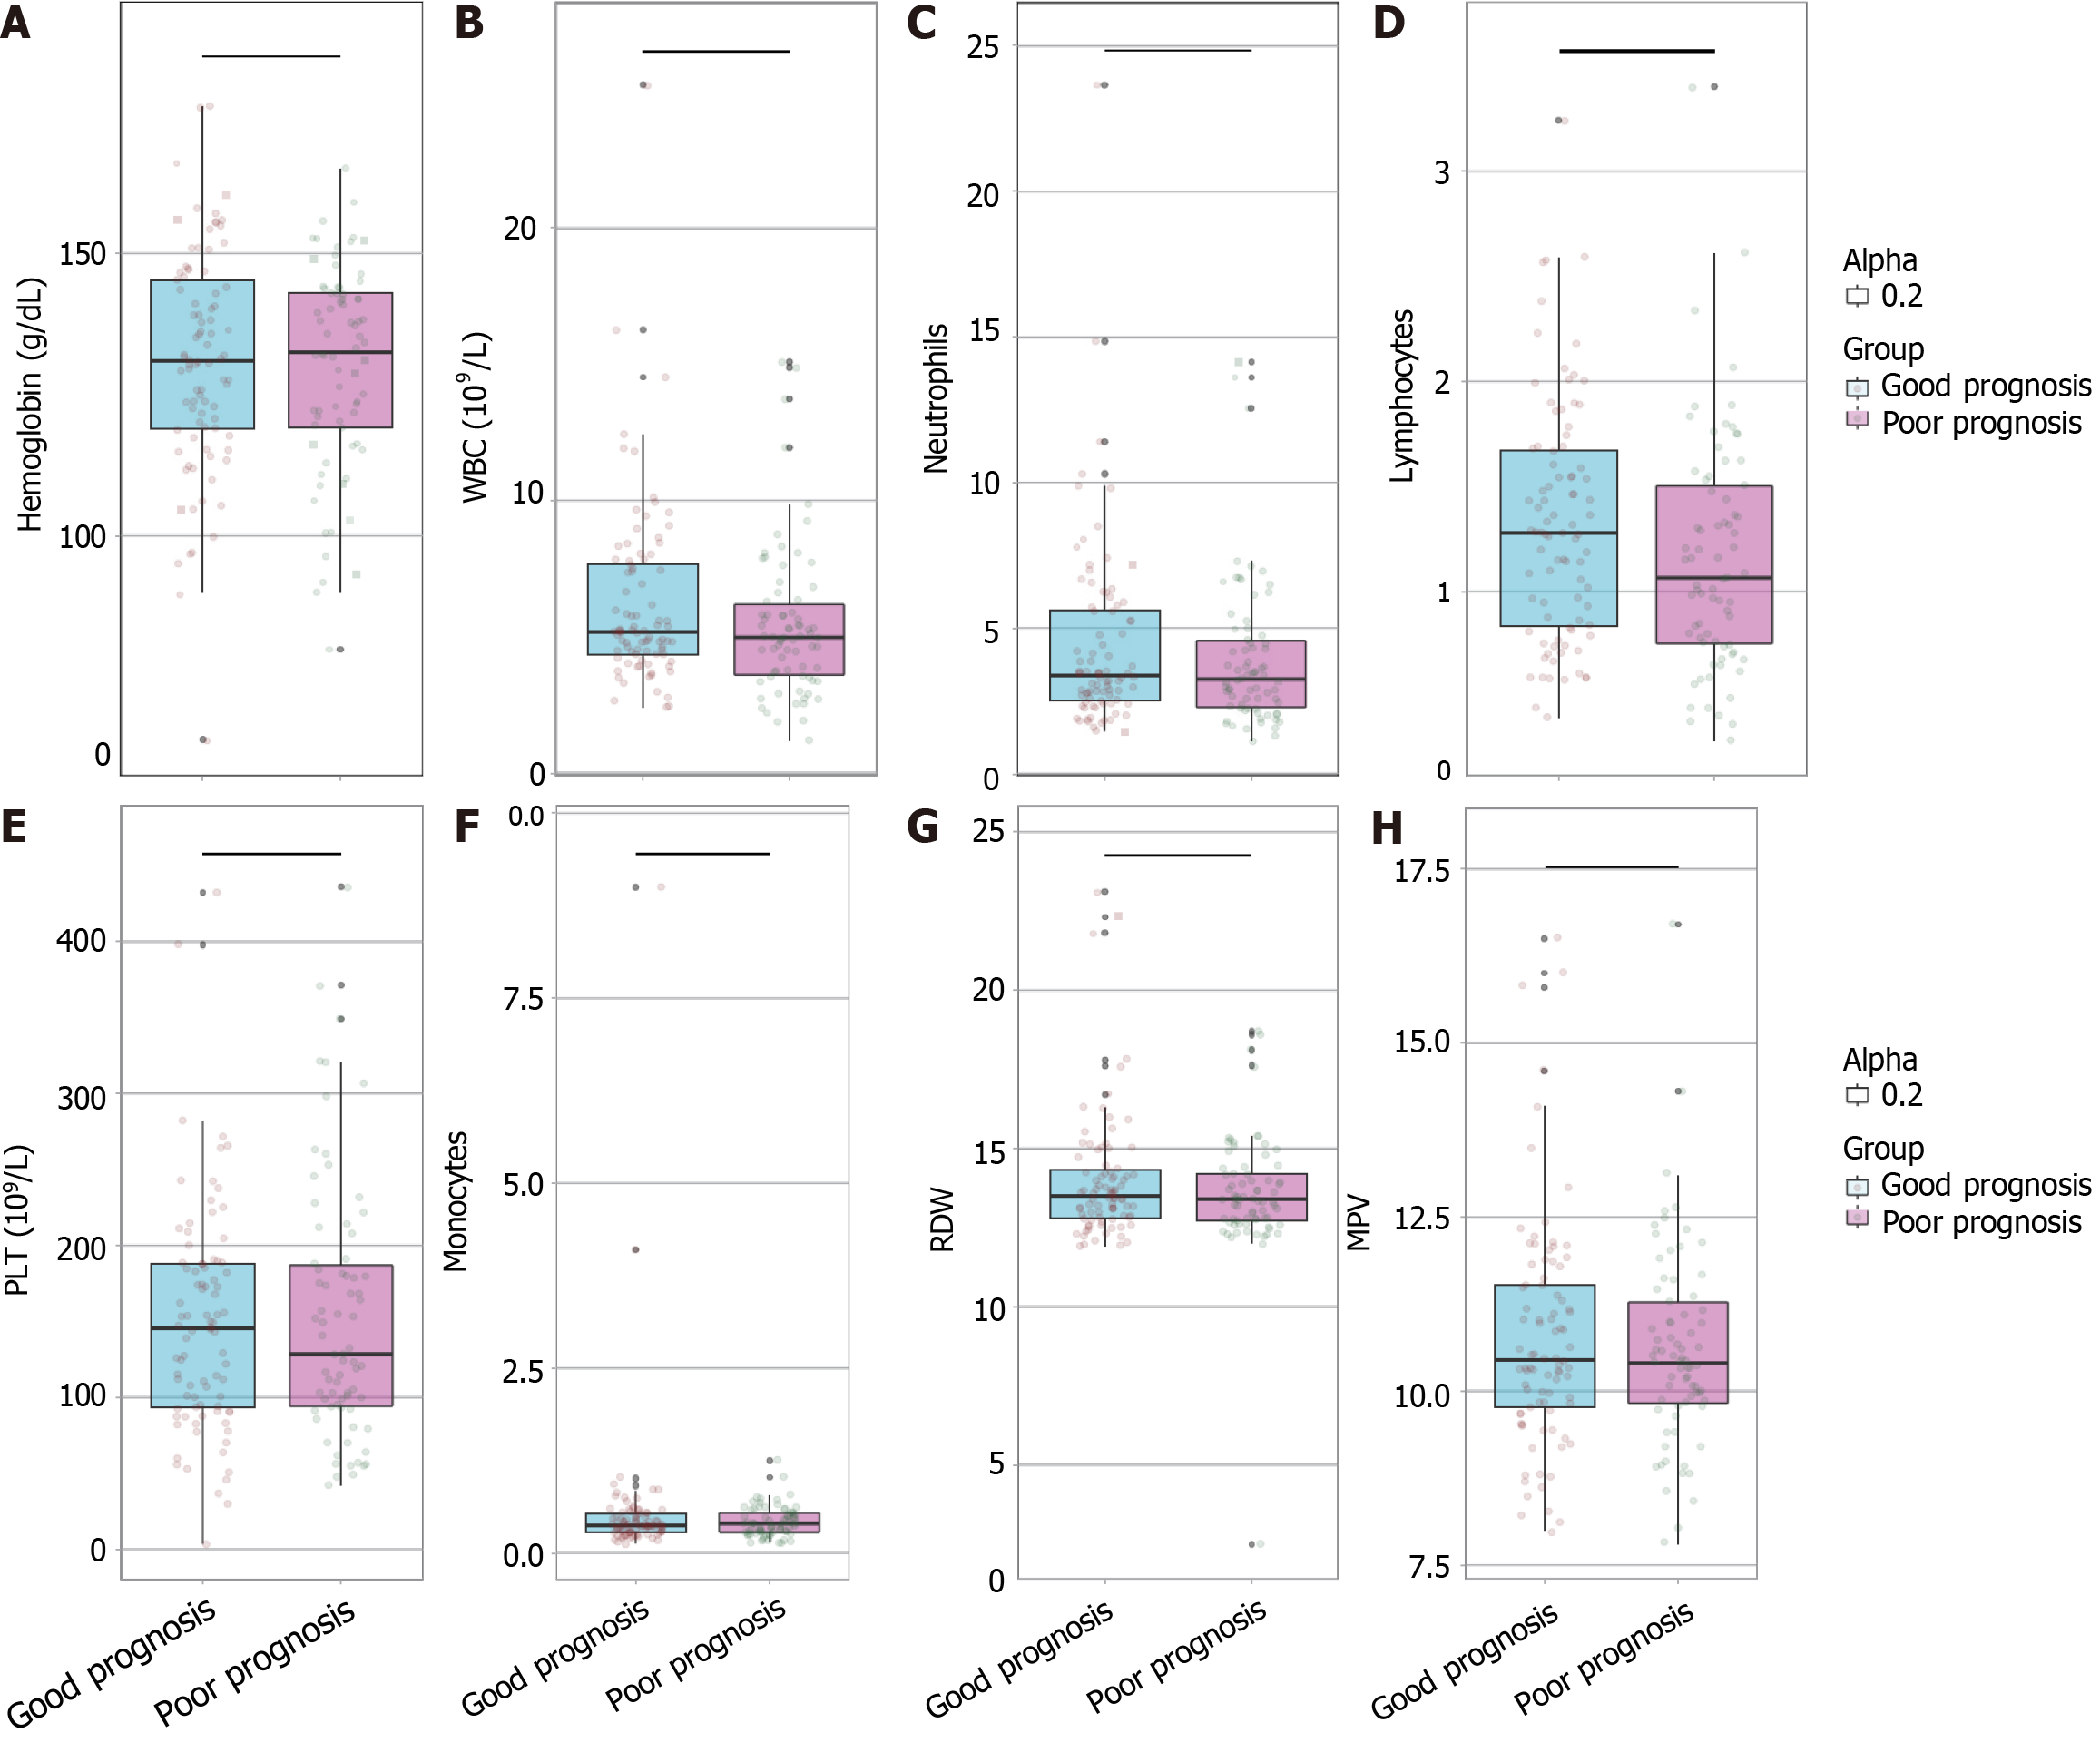
Figure 1 Comparison of blood test results between the two groups.
A: Hemoglobin; B: White blood cell (WBC); C: Neutrophils; D: Lymphocytes; E: Platelet (PLT); F: Monocytes; G: Red cell distribution width (RDW); H: Mean platelet volume (MPV).
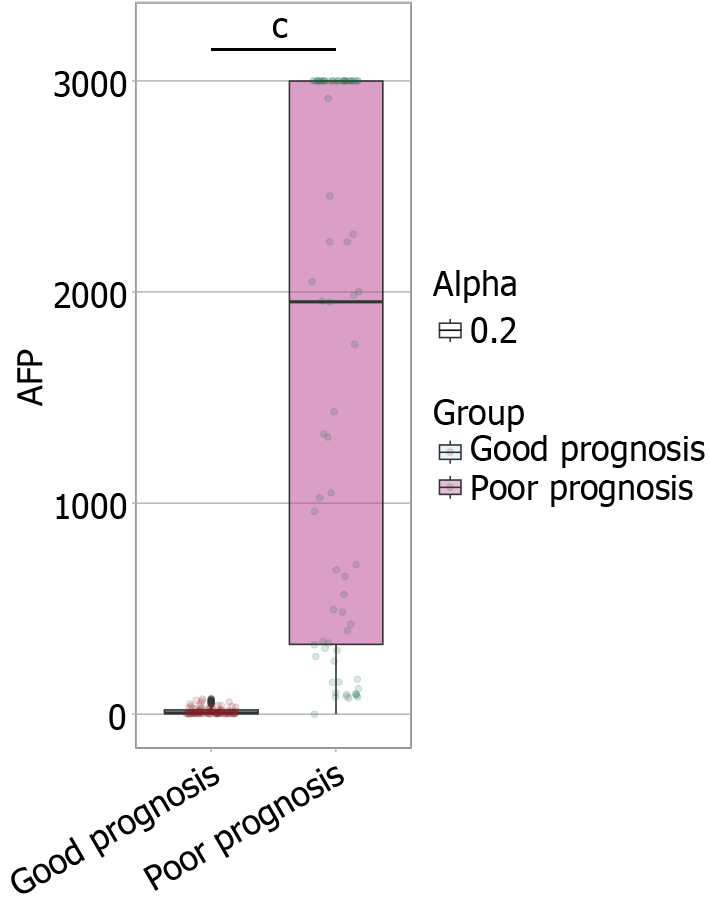
Figure 2 Comparison of alpha-fetoprotein before transarterial chemoembolization between the two groups.
cP < 0.001; AFP: Alpha-fetoprotein.
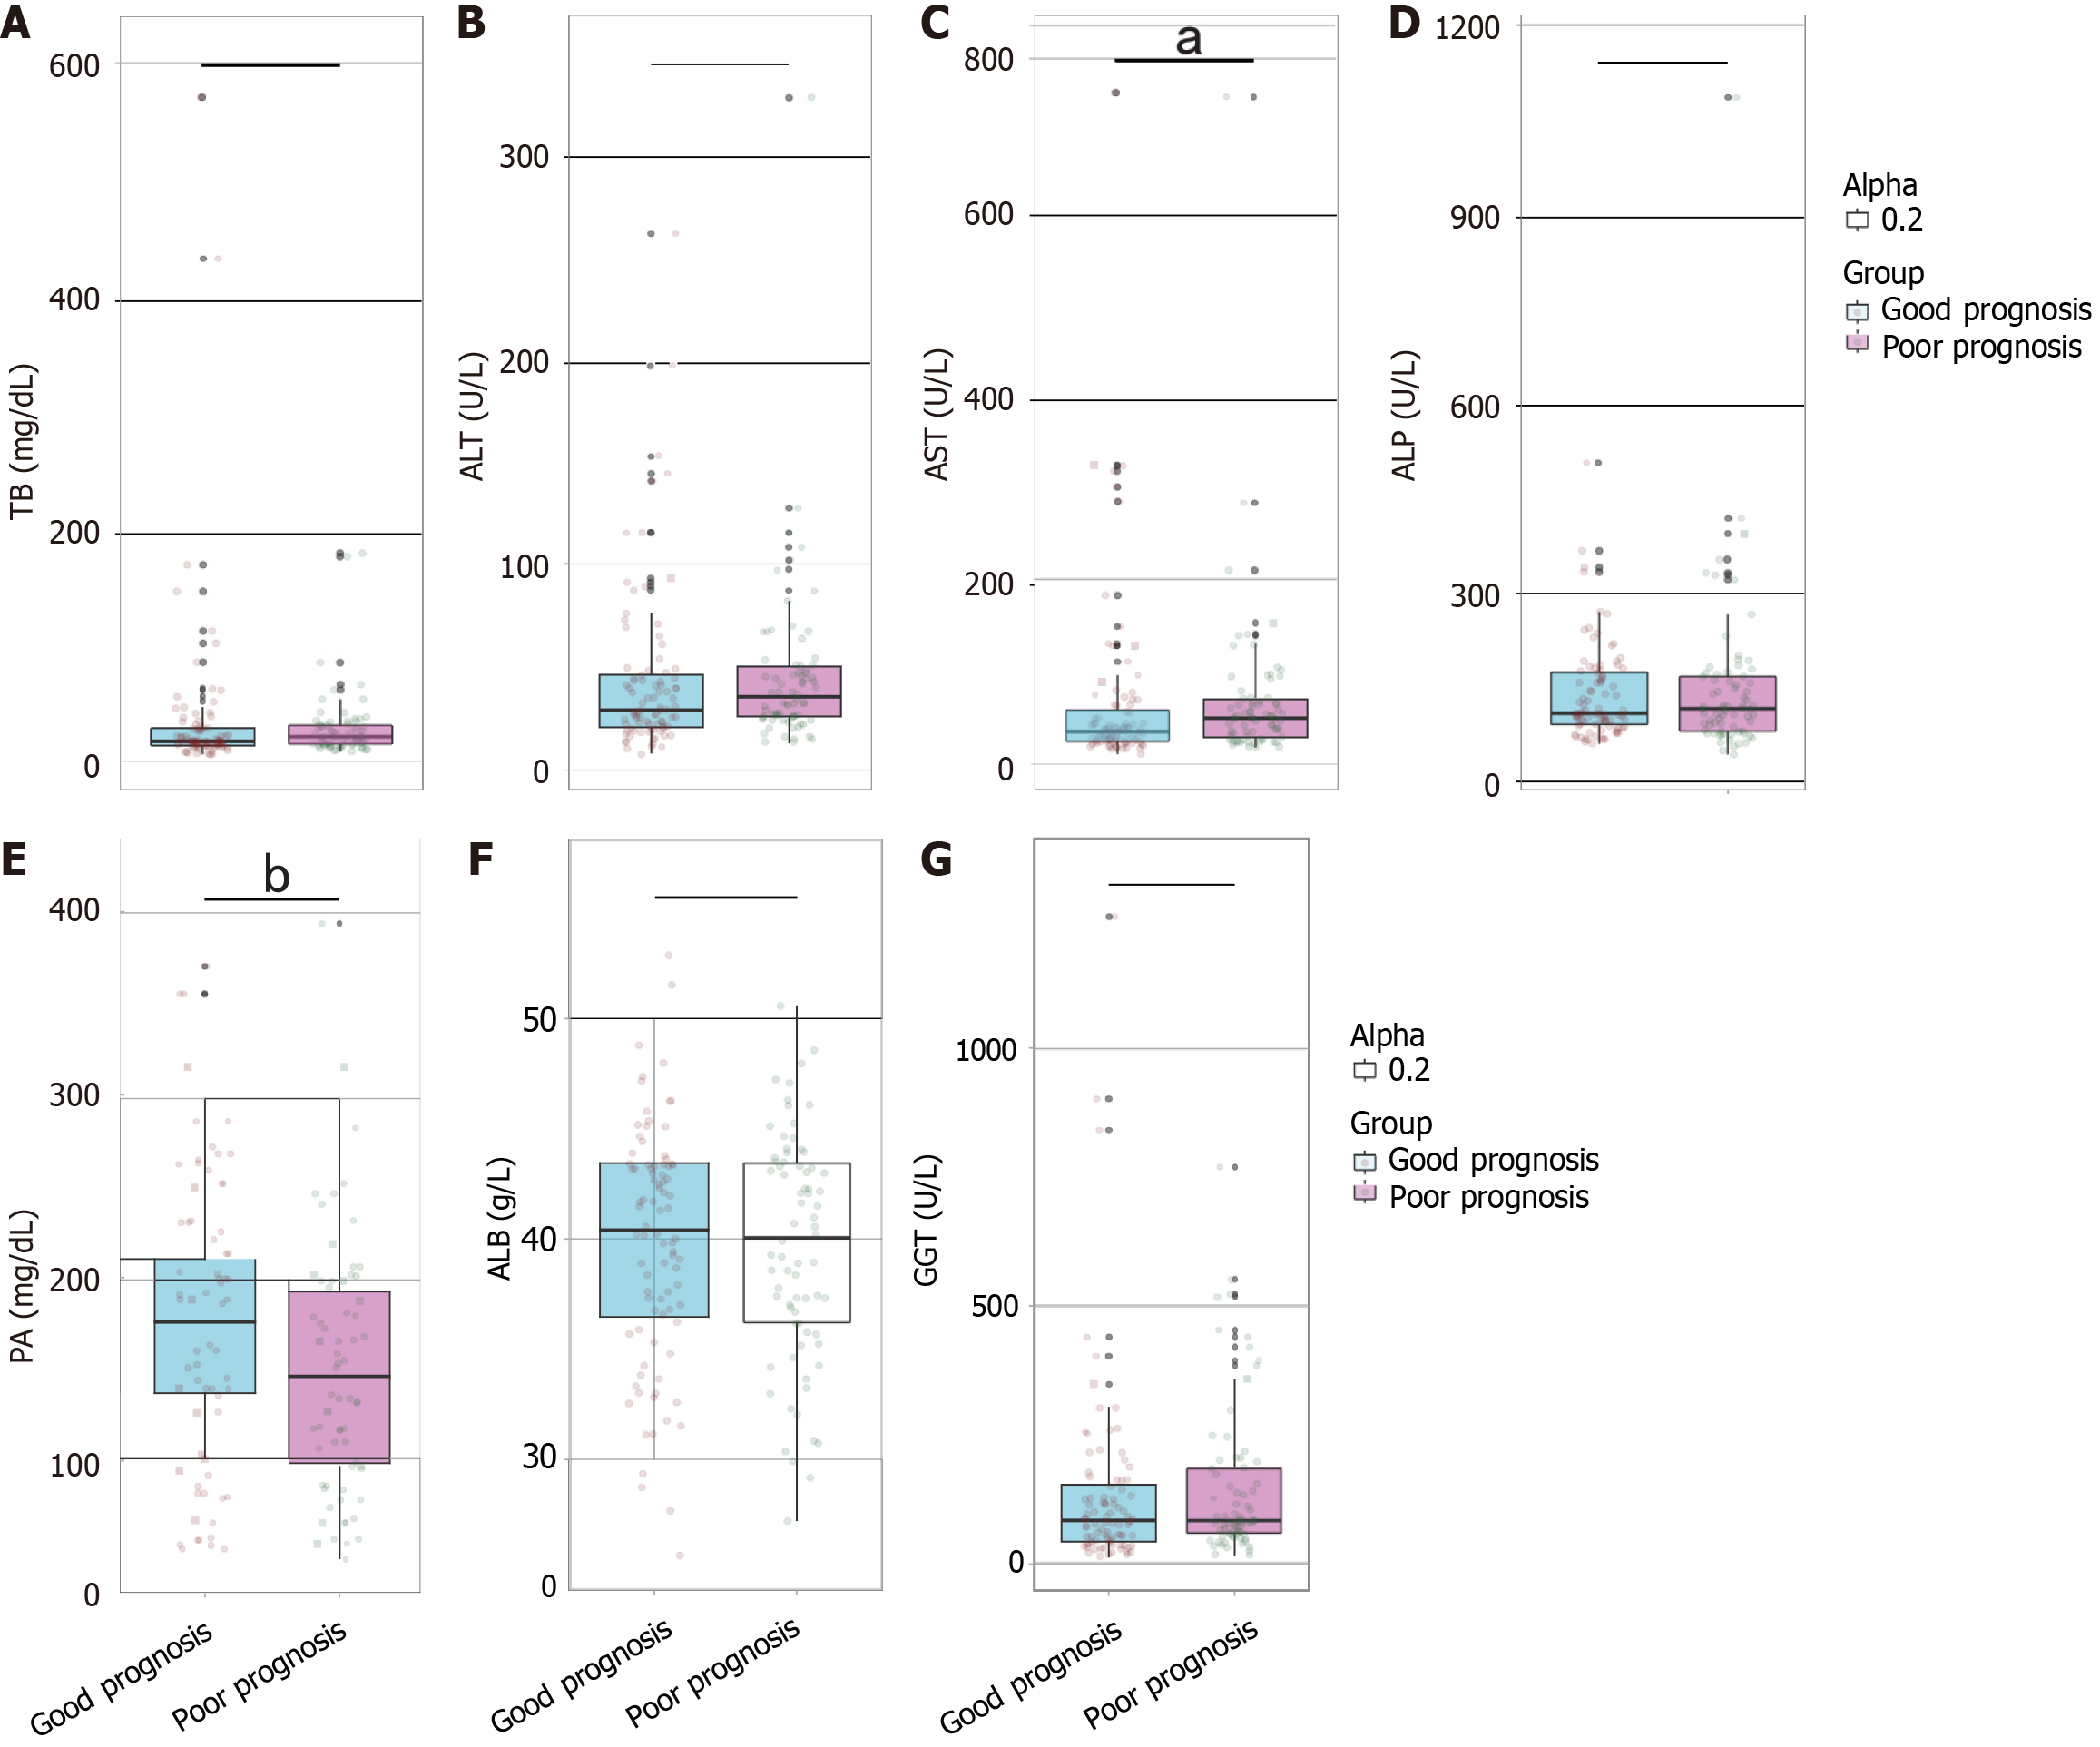
Figure 3 Comparison of liver function indicators between the two groups.
A: Total Bilirubin; B: Alanine aminotransferase; C: Aspartate aminotransferase; D: Alkaline phosphatase; E: Prealbumin; F: Albumin; G: Gamma-glutamyl transferase. aP < 0.05; bP < 0.01; ALB: Albumin; ALP: Alkaline phosphatase; ALT: Alanine aminotransferase; AST: Aspartate aminotransferase; GGT: Gamma-glutamyl transferase; PA: Prealbumin; TB: Total bilirubin.
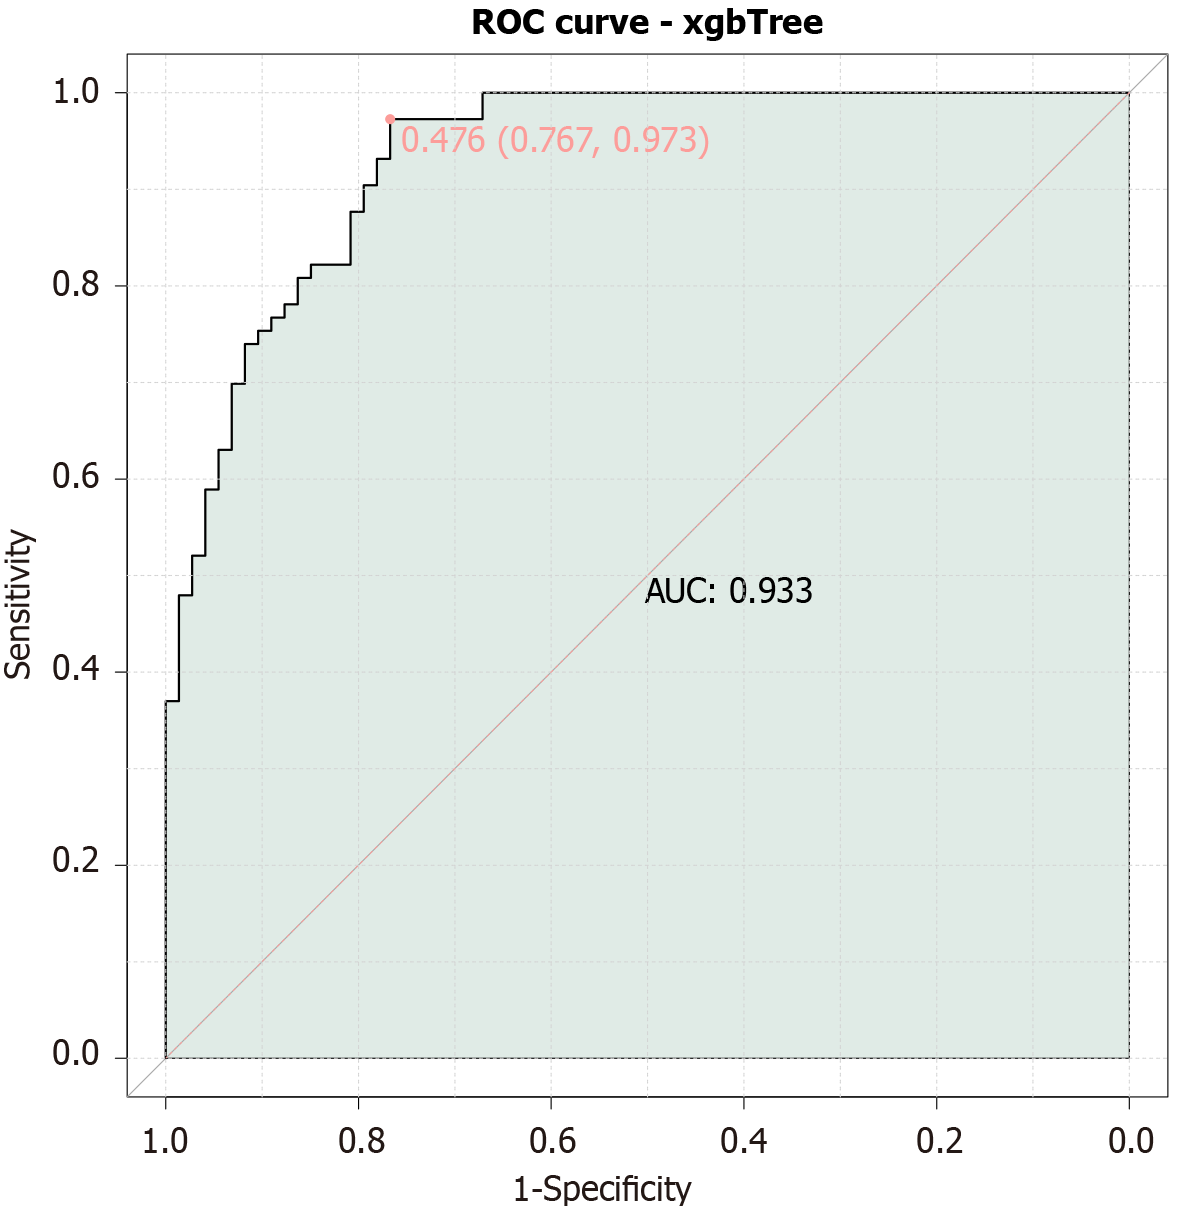
Figure 4 Prognostic value of preoperative biomarkers in the treatment of primary liver cancer.
AUC: Area under the curve; ROC: Receiver operating characteristic.
- Citation: Liu QQ, Li YD, Chen JX, Zhang LL, Guan RC, Zhao W, Meng LY. Prognostic value of preoperative fibrinogen, neutrophil-to-lymphocyte ratio, serum alpha-fetoprotein, and prealbumin for patients with primary liver cancer undergoing transarterial chemoembolization. World J Gastrointest Oncol 2025; 17(6): 103198
- URL: https://www.wjgnet.com/1948-5204/full/v17/i6/103198.htm
- DOI: https://dx.doi.org/10.4251/wjgo.v17.i6.103198


