Copyright
©The Author(s) 2025.
World J Gastrointest Oncol. May 15, 2025; 17(5): 106244
Published online May 15, 2025. doi: 10.4251/wjgo.v17.i5.106244
Published online May 15, 2025. doi: 10.4251/wjgo.v17.i5.106244
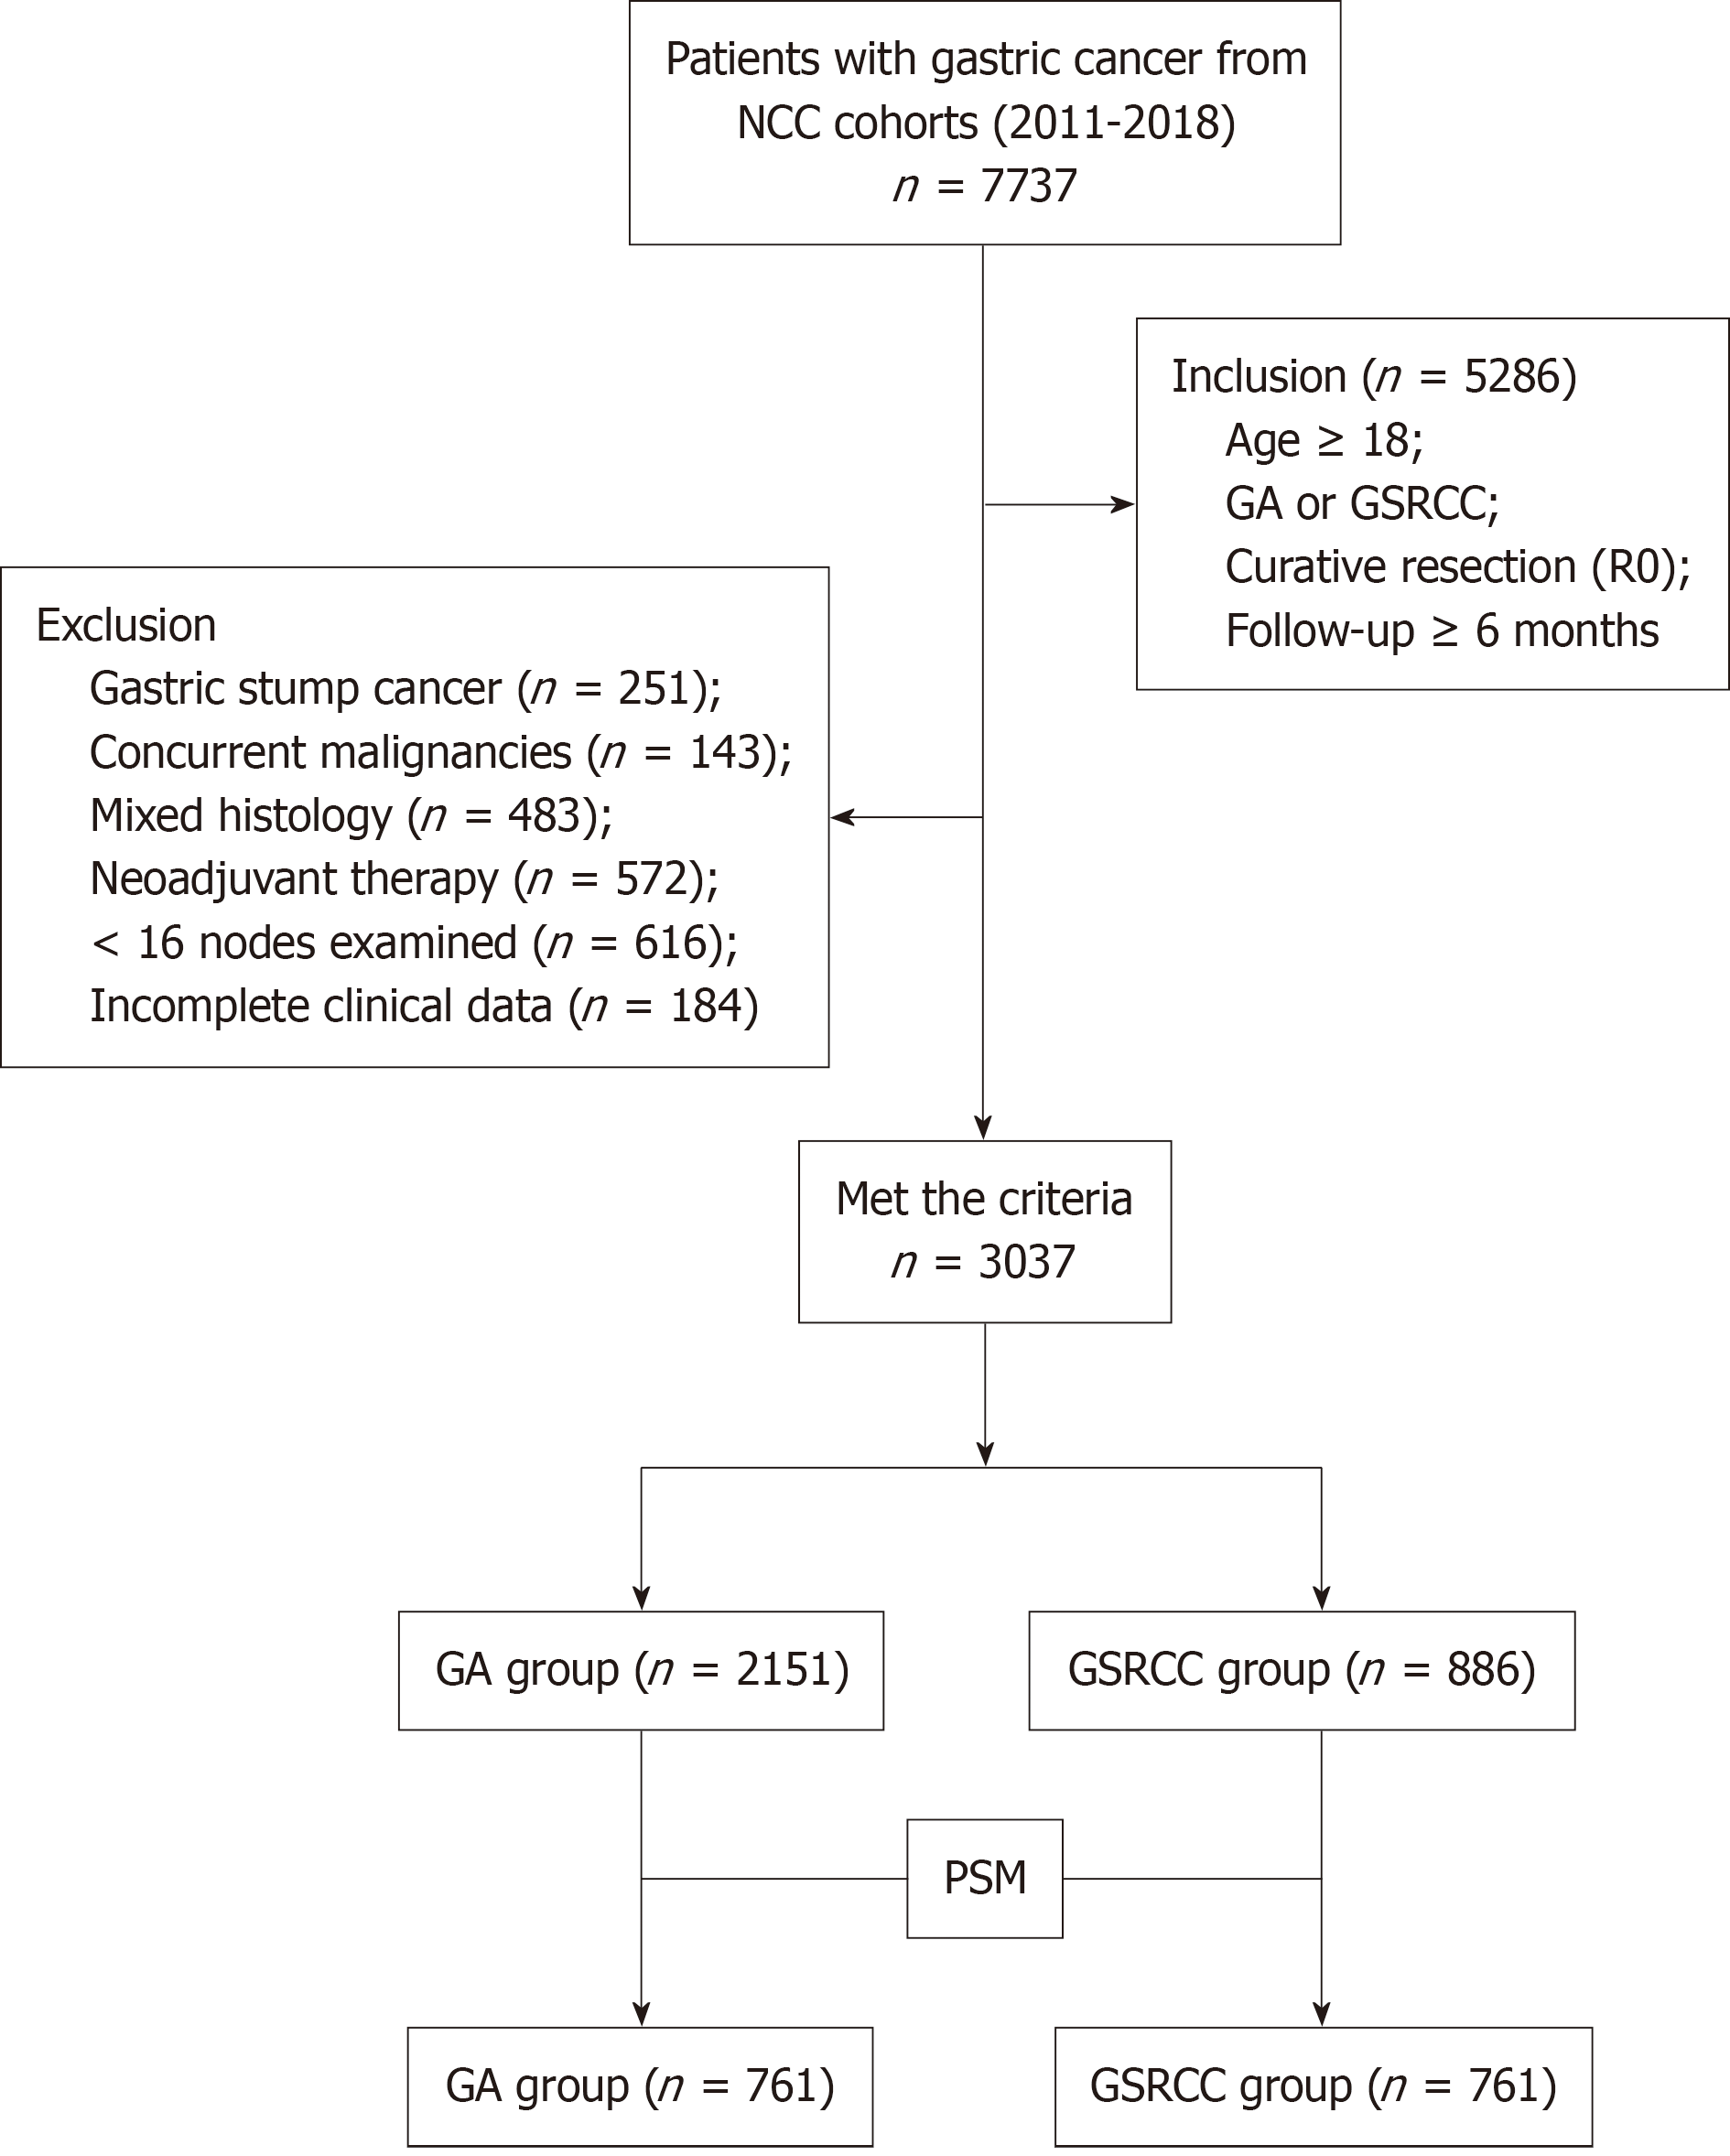
Figure 1 Flow diagram showing the study design and population.
NCC: National Cancer Cener; GA: Gastric adenocarcinoma; GSRCC: Gastric signet ring cell carcinoma; PSM: Propensity score matching.
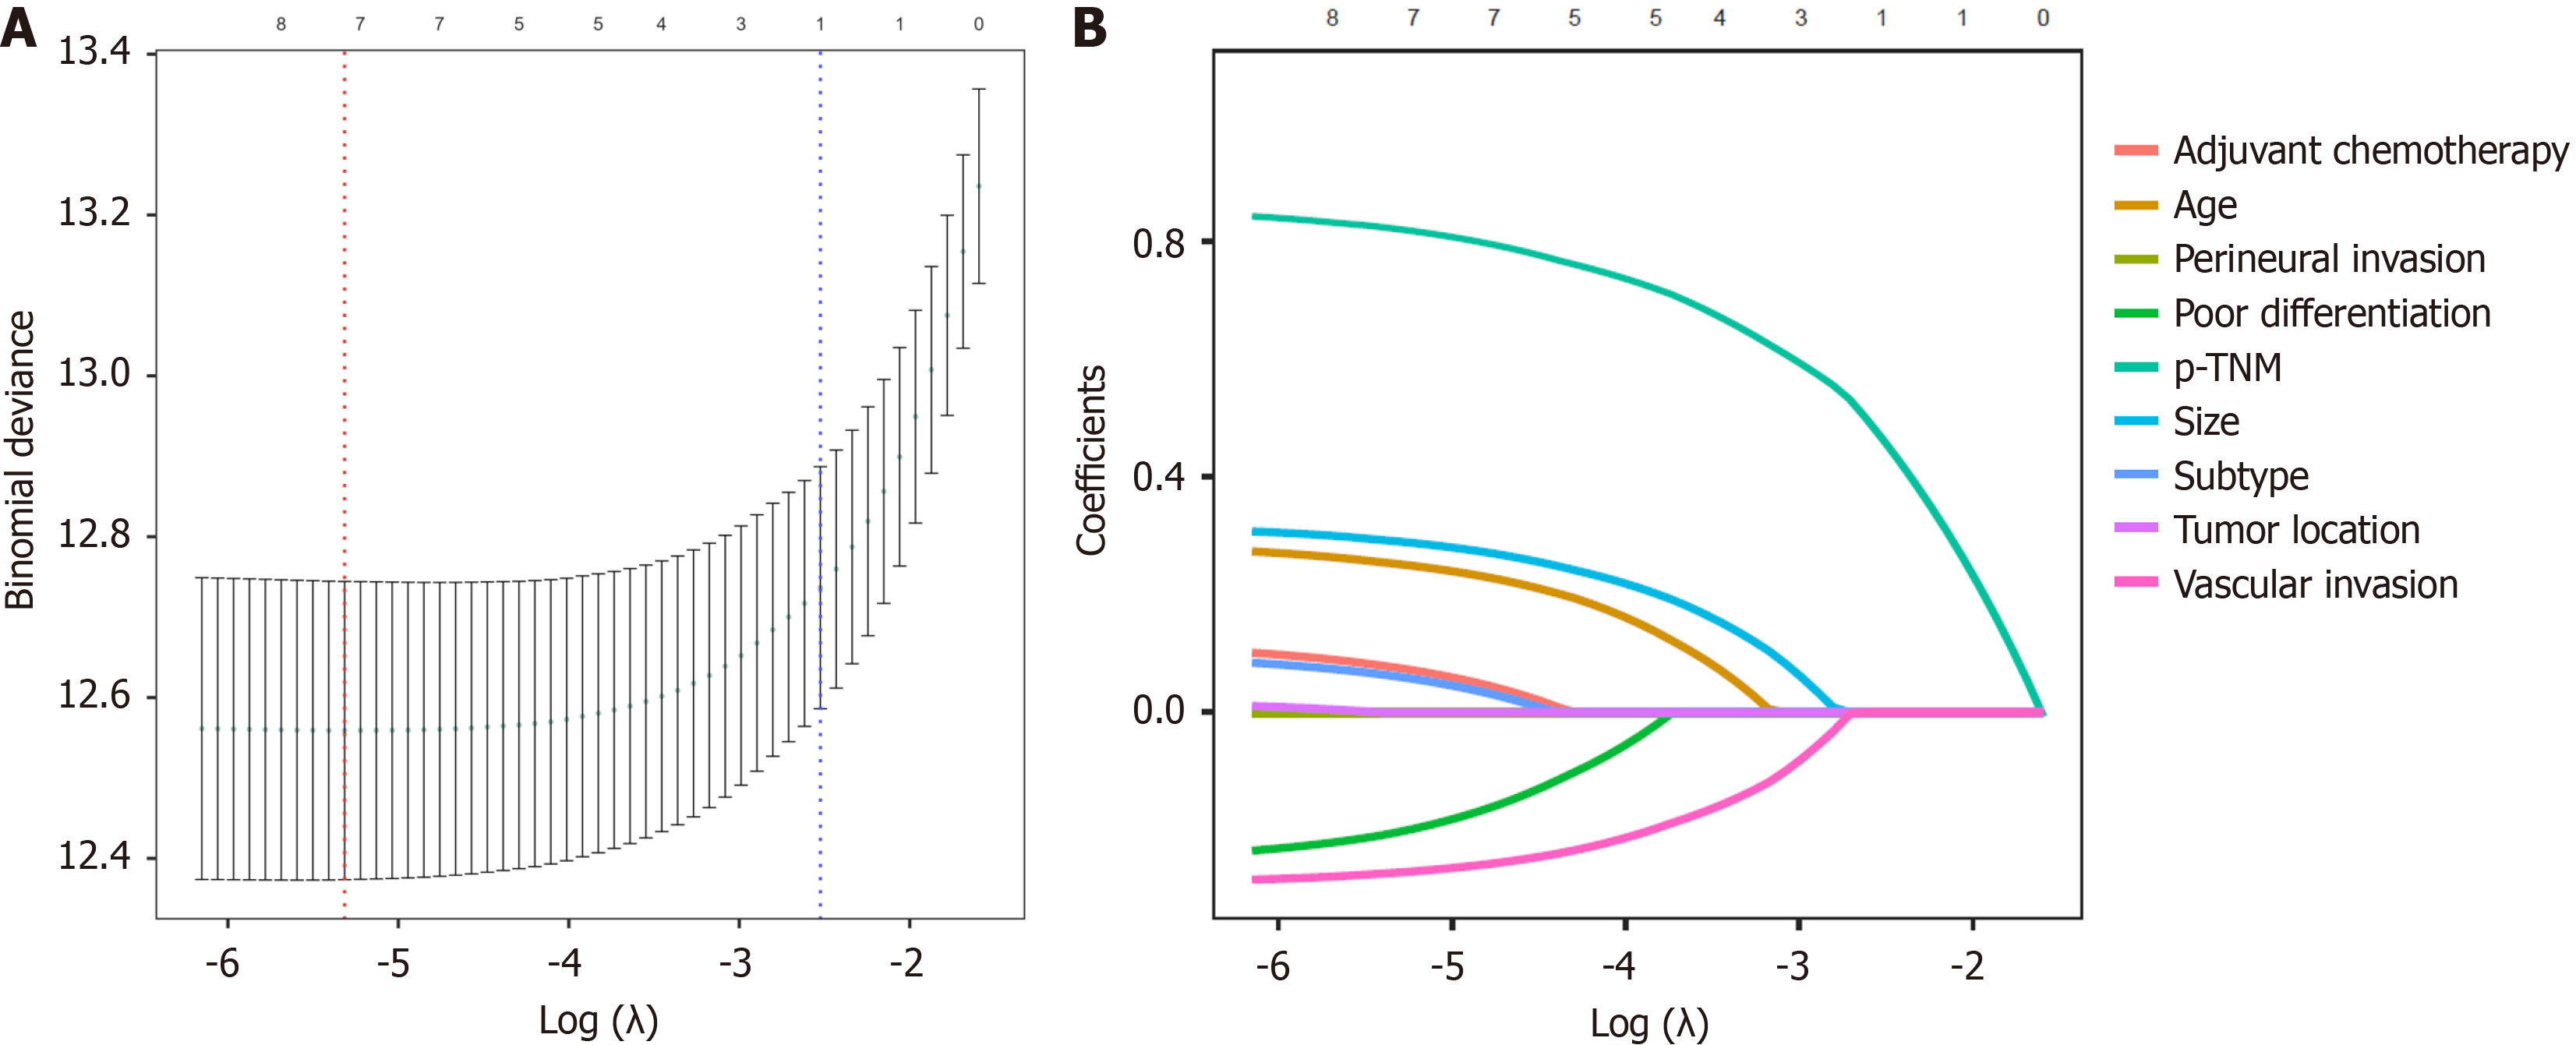
Figure 2 Variable selection via least absolute shrinkage and selection operator Cox regression.
A: Coefficient profiles of clinicopathological variables in the least absolute shrinkage and selection operator model. The upper x-axis indicates the number of non-zero coefficients, while the y-axis represents coefficient magnitudes. Nine variables were evaluated, including subtype, age, tumor location, tumor size, poor differentiation, perineural invasion, vascular invasion, post-treatment nodal margin stage, and adjuvant chemotherapy; B: Optimal lambda (λ) selection using 10-fold cross-validation (minimum criterion). The vertical dashed lines correspond to λminimum (left, minimizing cross-validated error) and λ1se (right, within one standard error of the minimum). The upper x-axis denotes retained variables after shrinkage. pTNM: Post-treatment nodal margin.
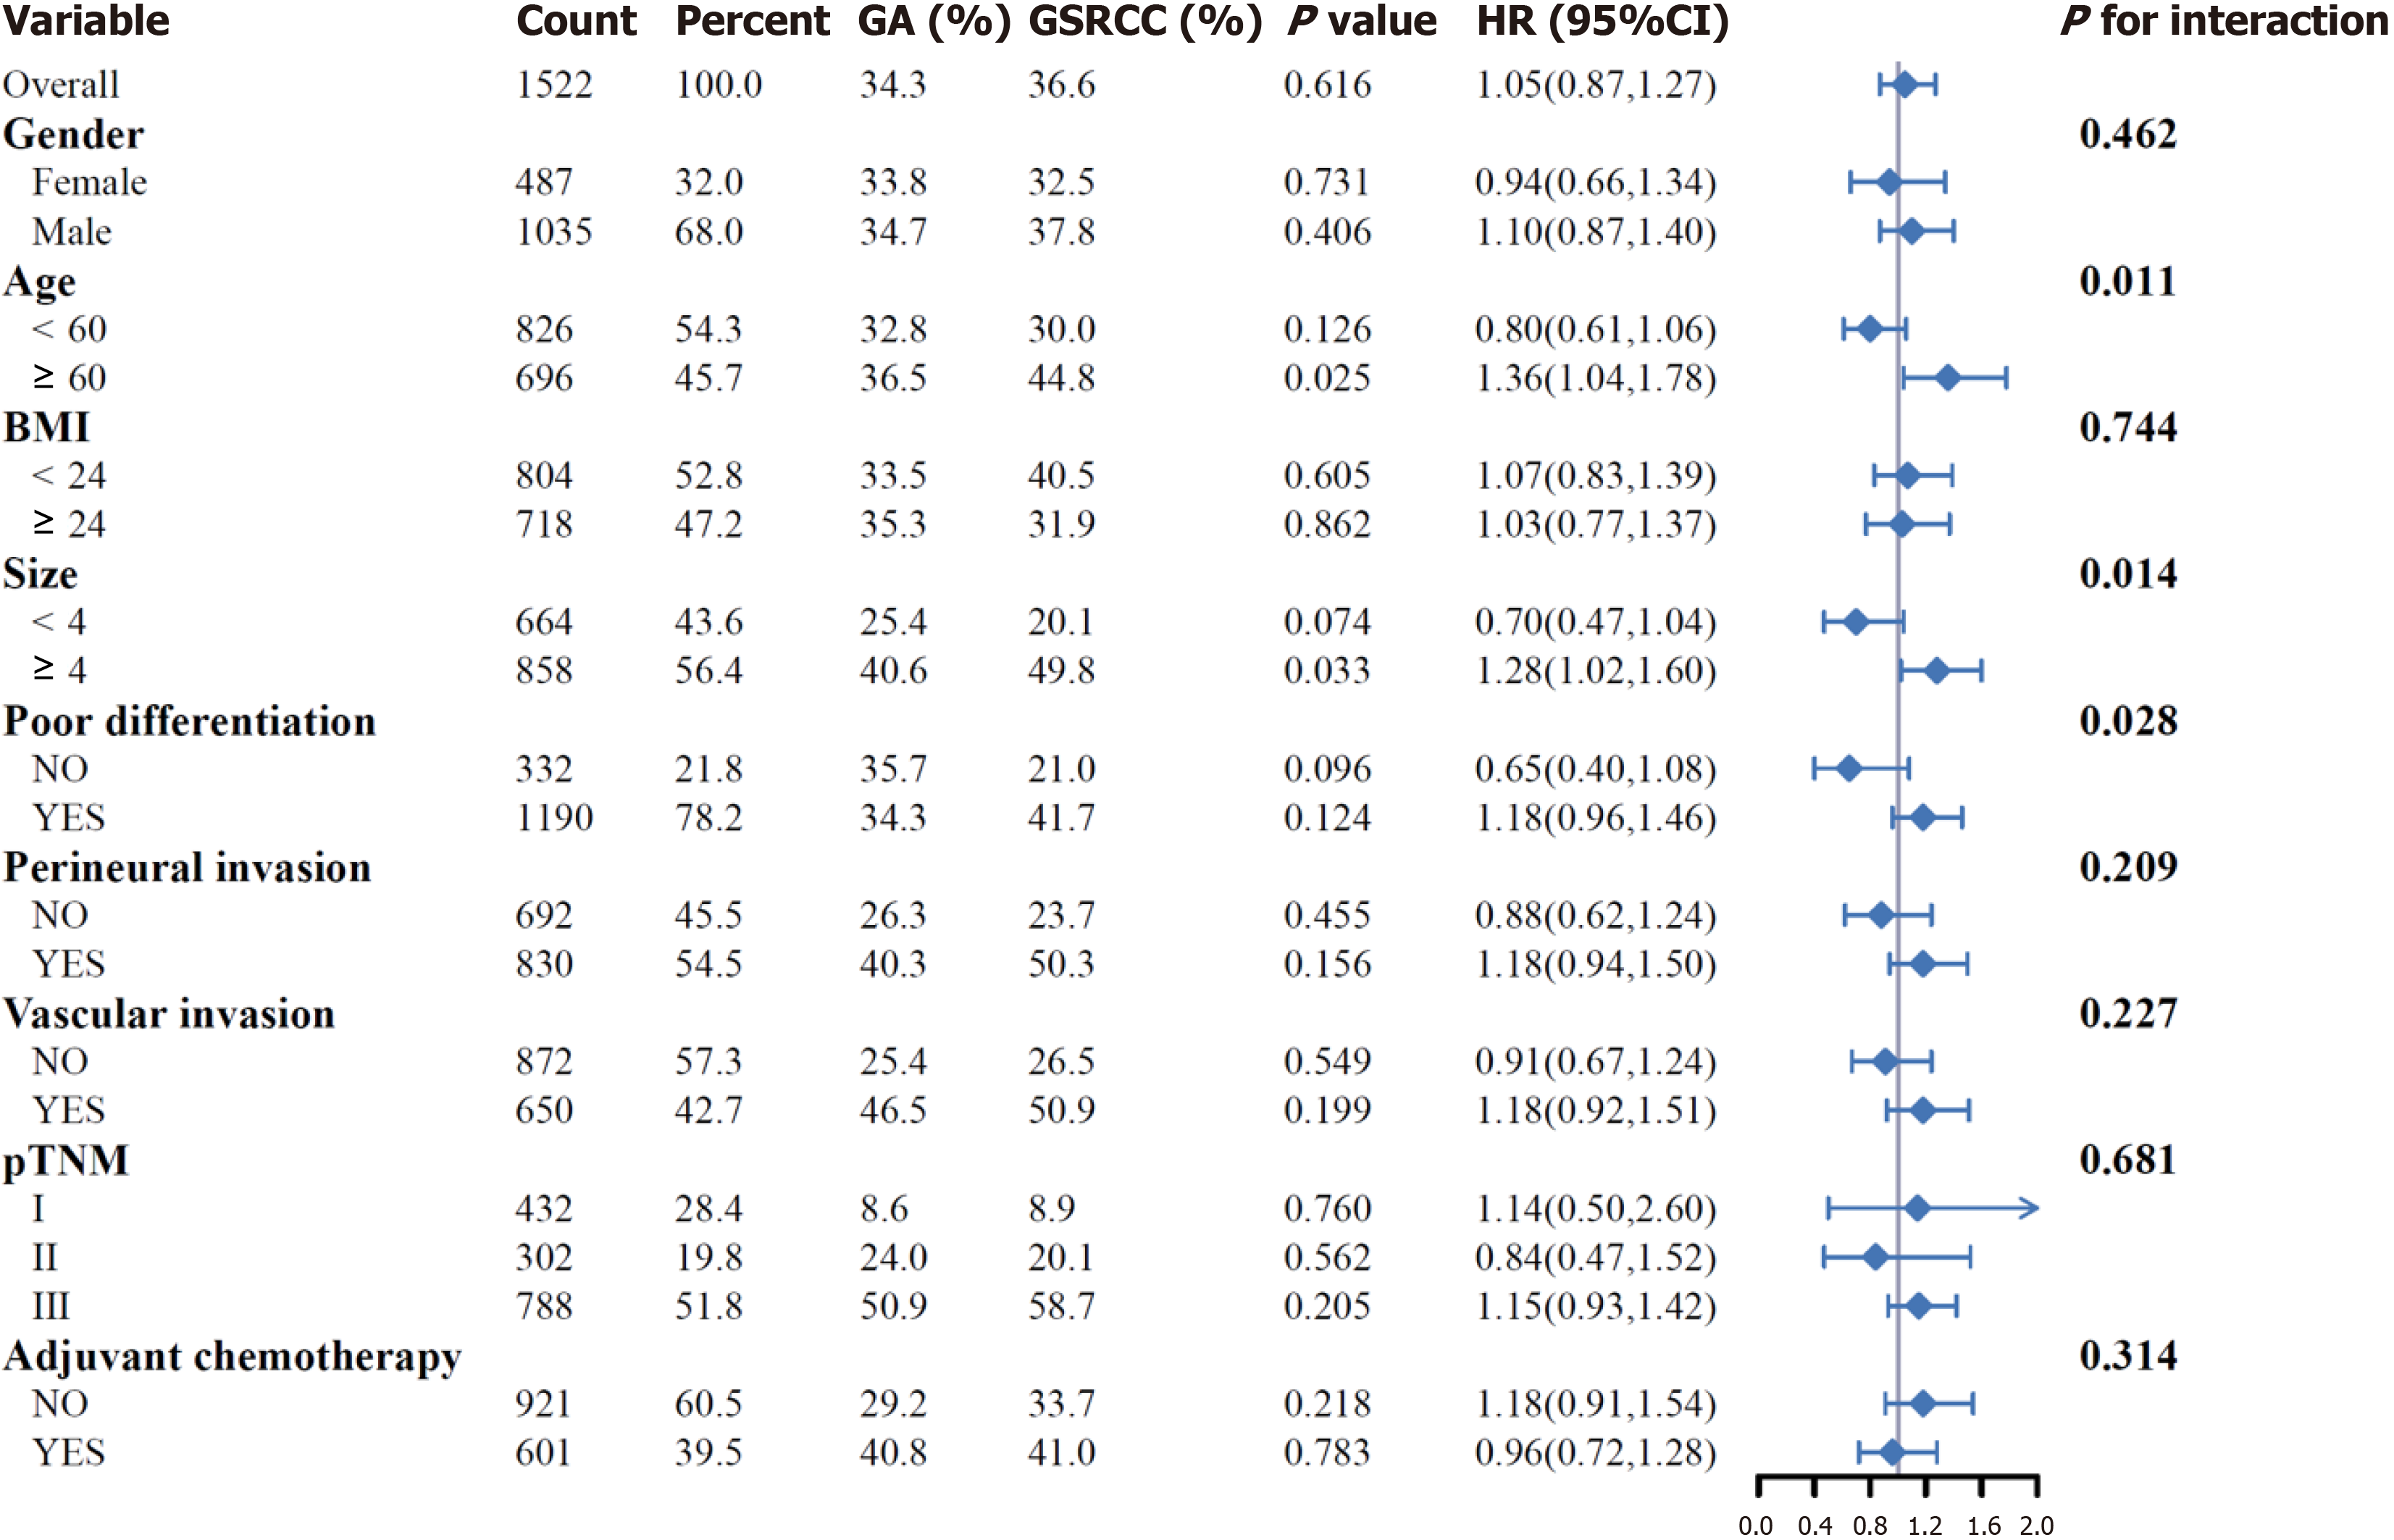
Figure 3 Forest plot of hazard ratios from univariate Cox subgroup analysis.
Horizontal lines represent 95% confidence intervals. Diamonds indicate pooled hazard ratios for significant interaction subgroups. GA: Gastric adenocarcinoma; GSRCC: Gastric signet ring cell carcinoma; BMI: Body mass index; pTNM: Post-treatment nodal margin; HR: Hazard ratio; CI: Confidence interval.
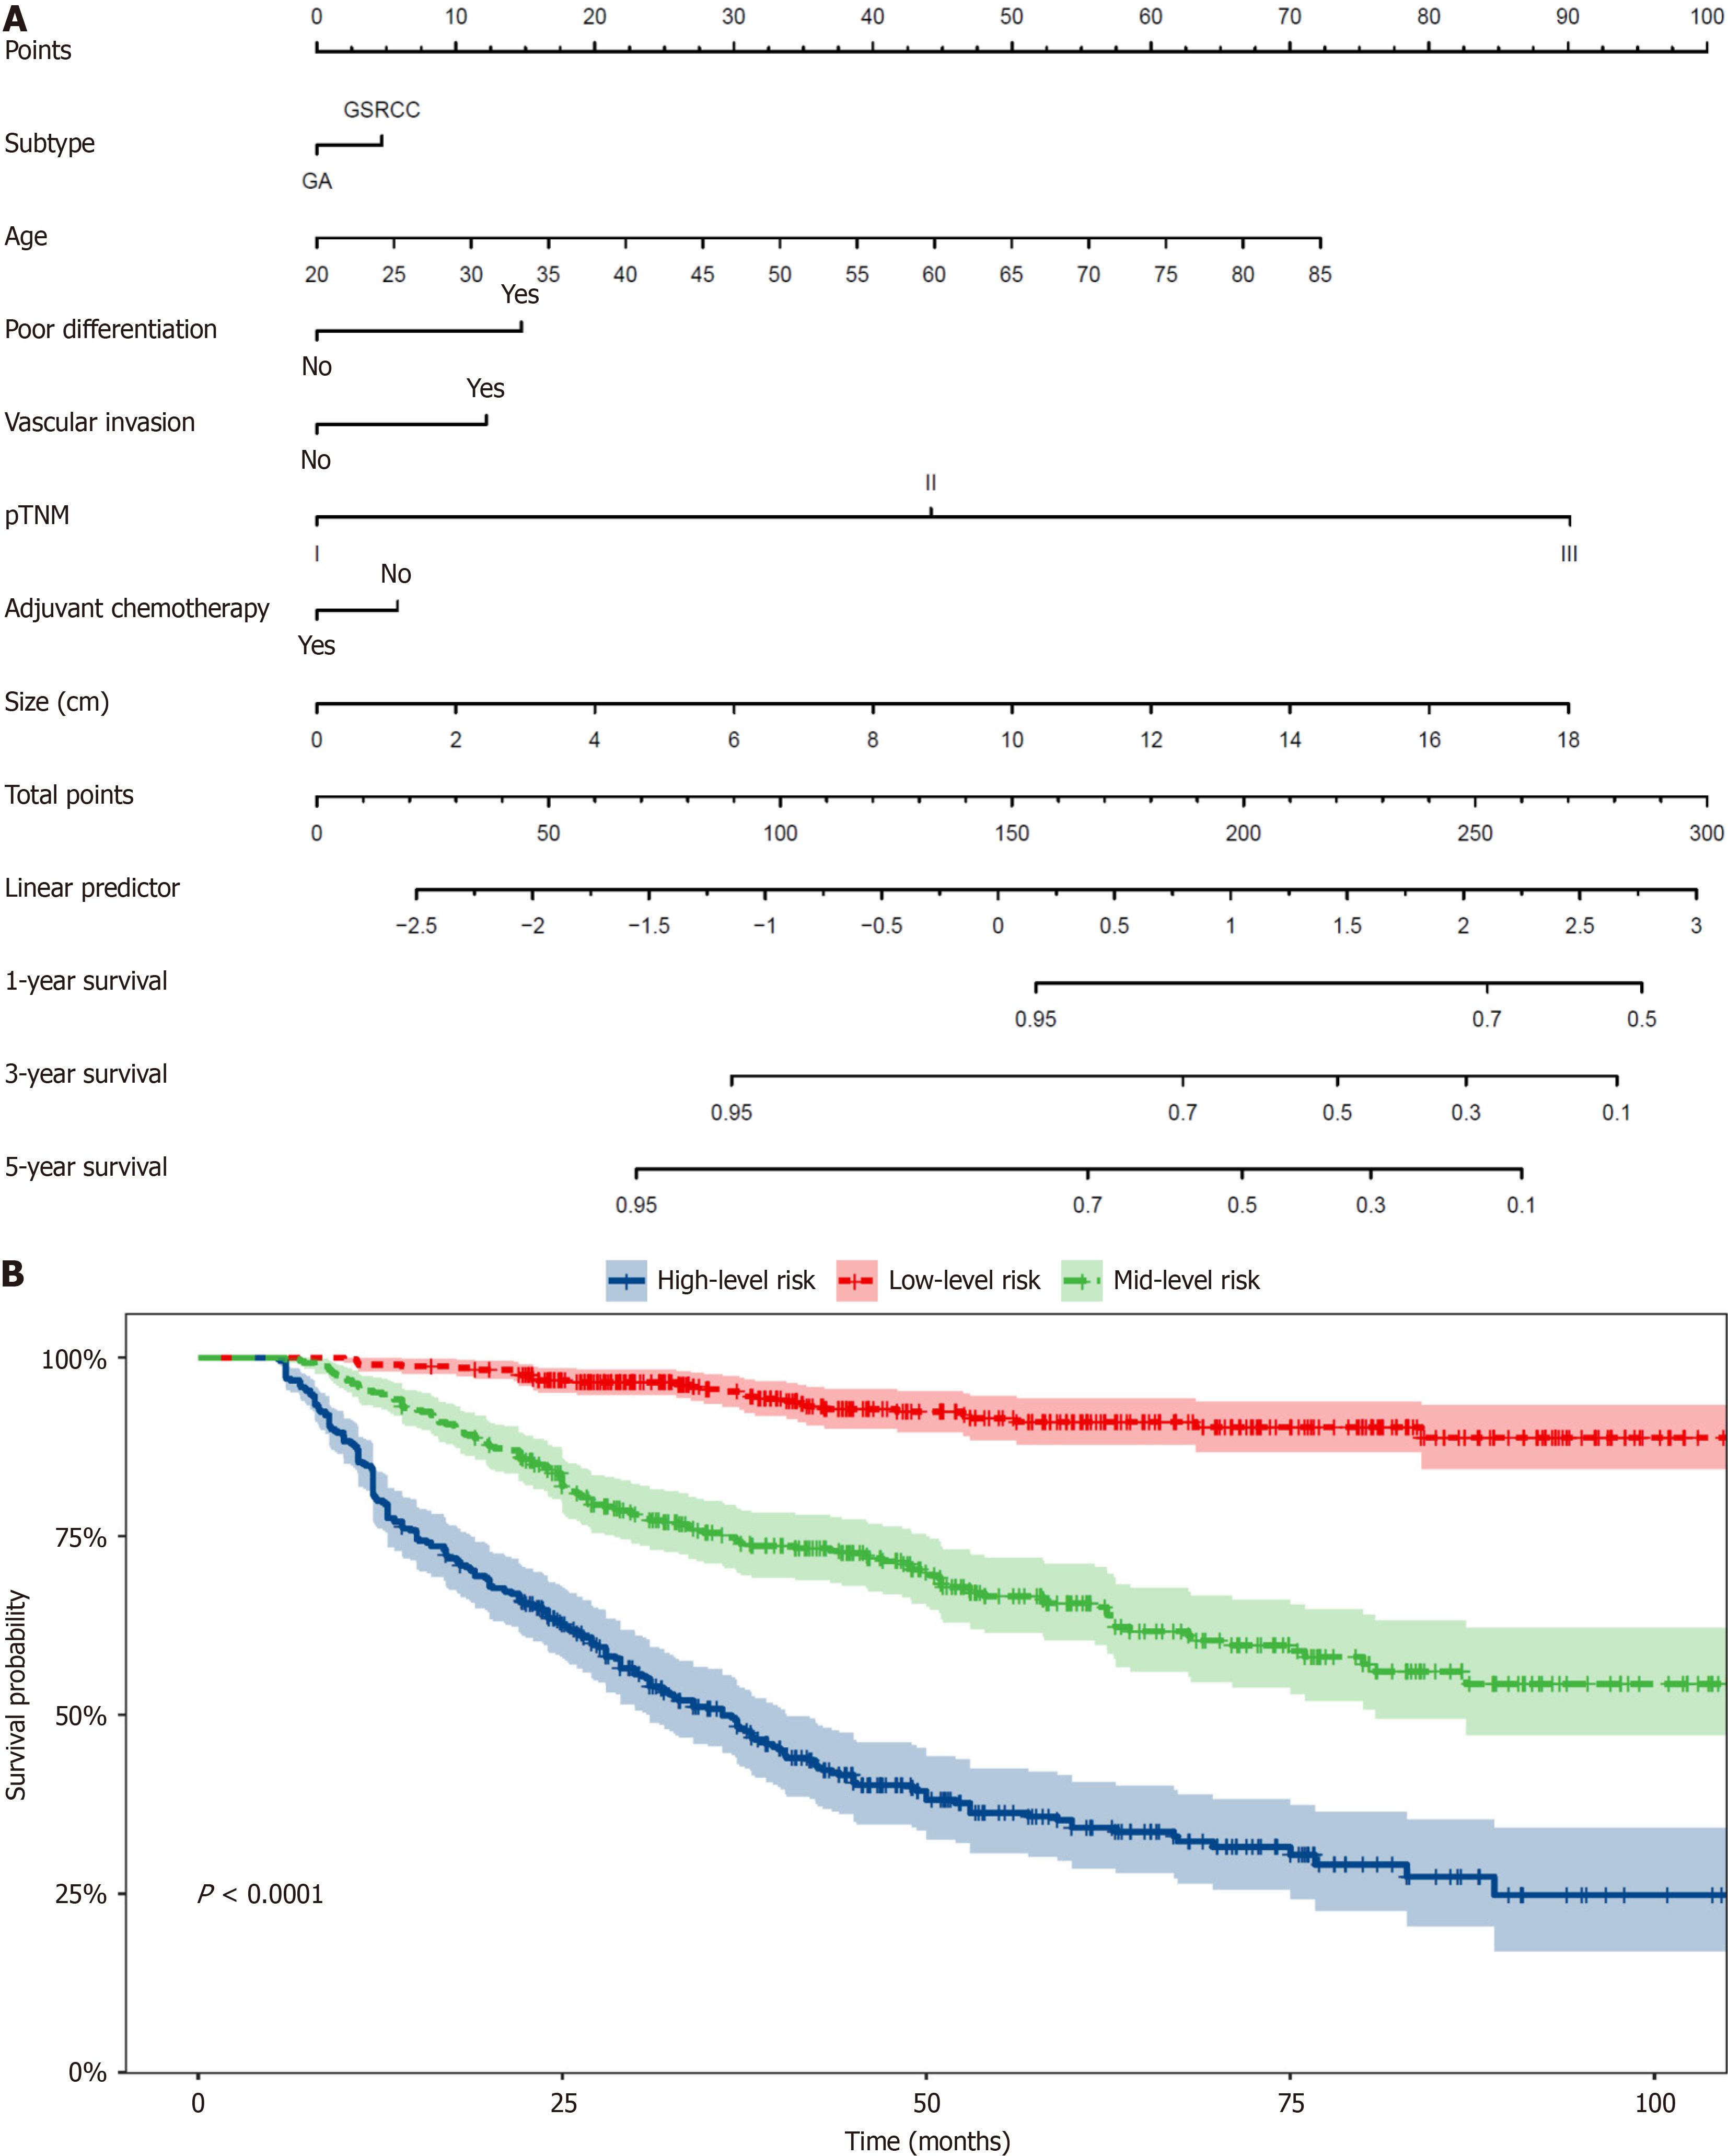
Figure 4 Nomogram development and risk stratification.
A: The nomogram of predicting overall survival in patients. Survival nomogram for the prediction of 1-year, 3-year, and 5-year overall survival; B: Kaplan-Meier curve to test the stratification system of the nomogram. GA: Gastric adenocarcinoma; GSRCC: Gastric signet ring cell carcinoma; pTNM: Post-treatment nodal margin.
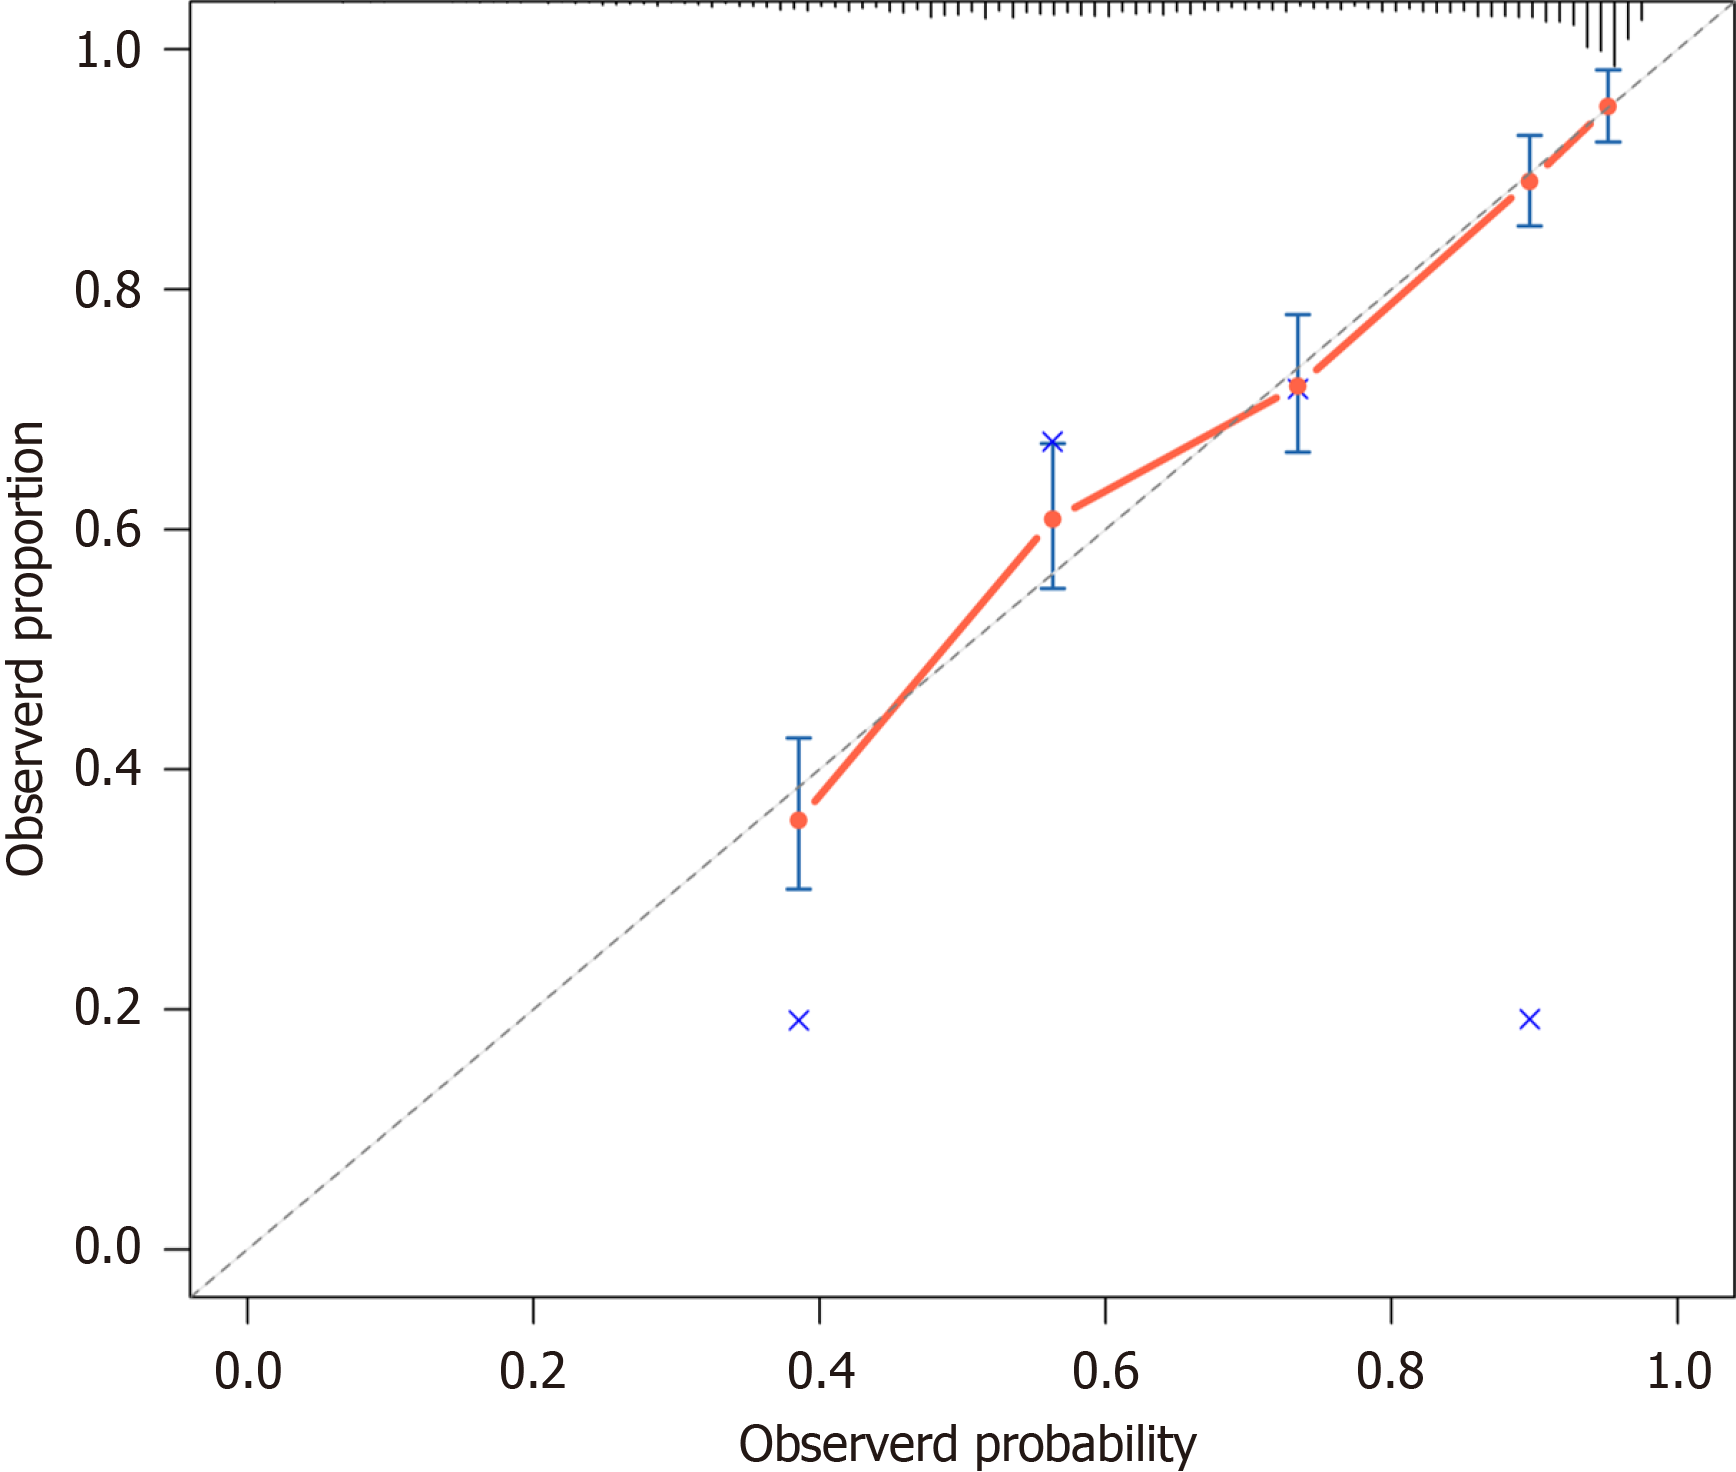
Figure 5 Calibration plot of the multivariate Cox regression model for 5-year overall survival.
The solid line represents the model’s predicted probabilities, while the dashed diagonal line indicates ideal calibration. Bootstrap-derived 95% confidence intervals (shaded area) demonstrate robust agreement between predicted and observed outcomes.
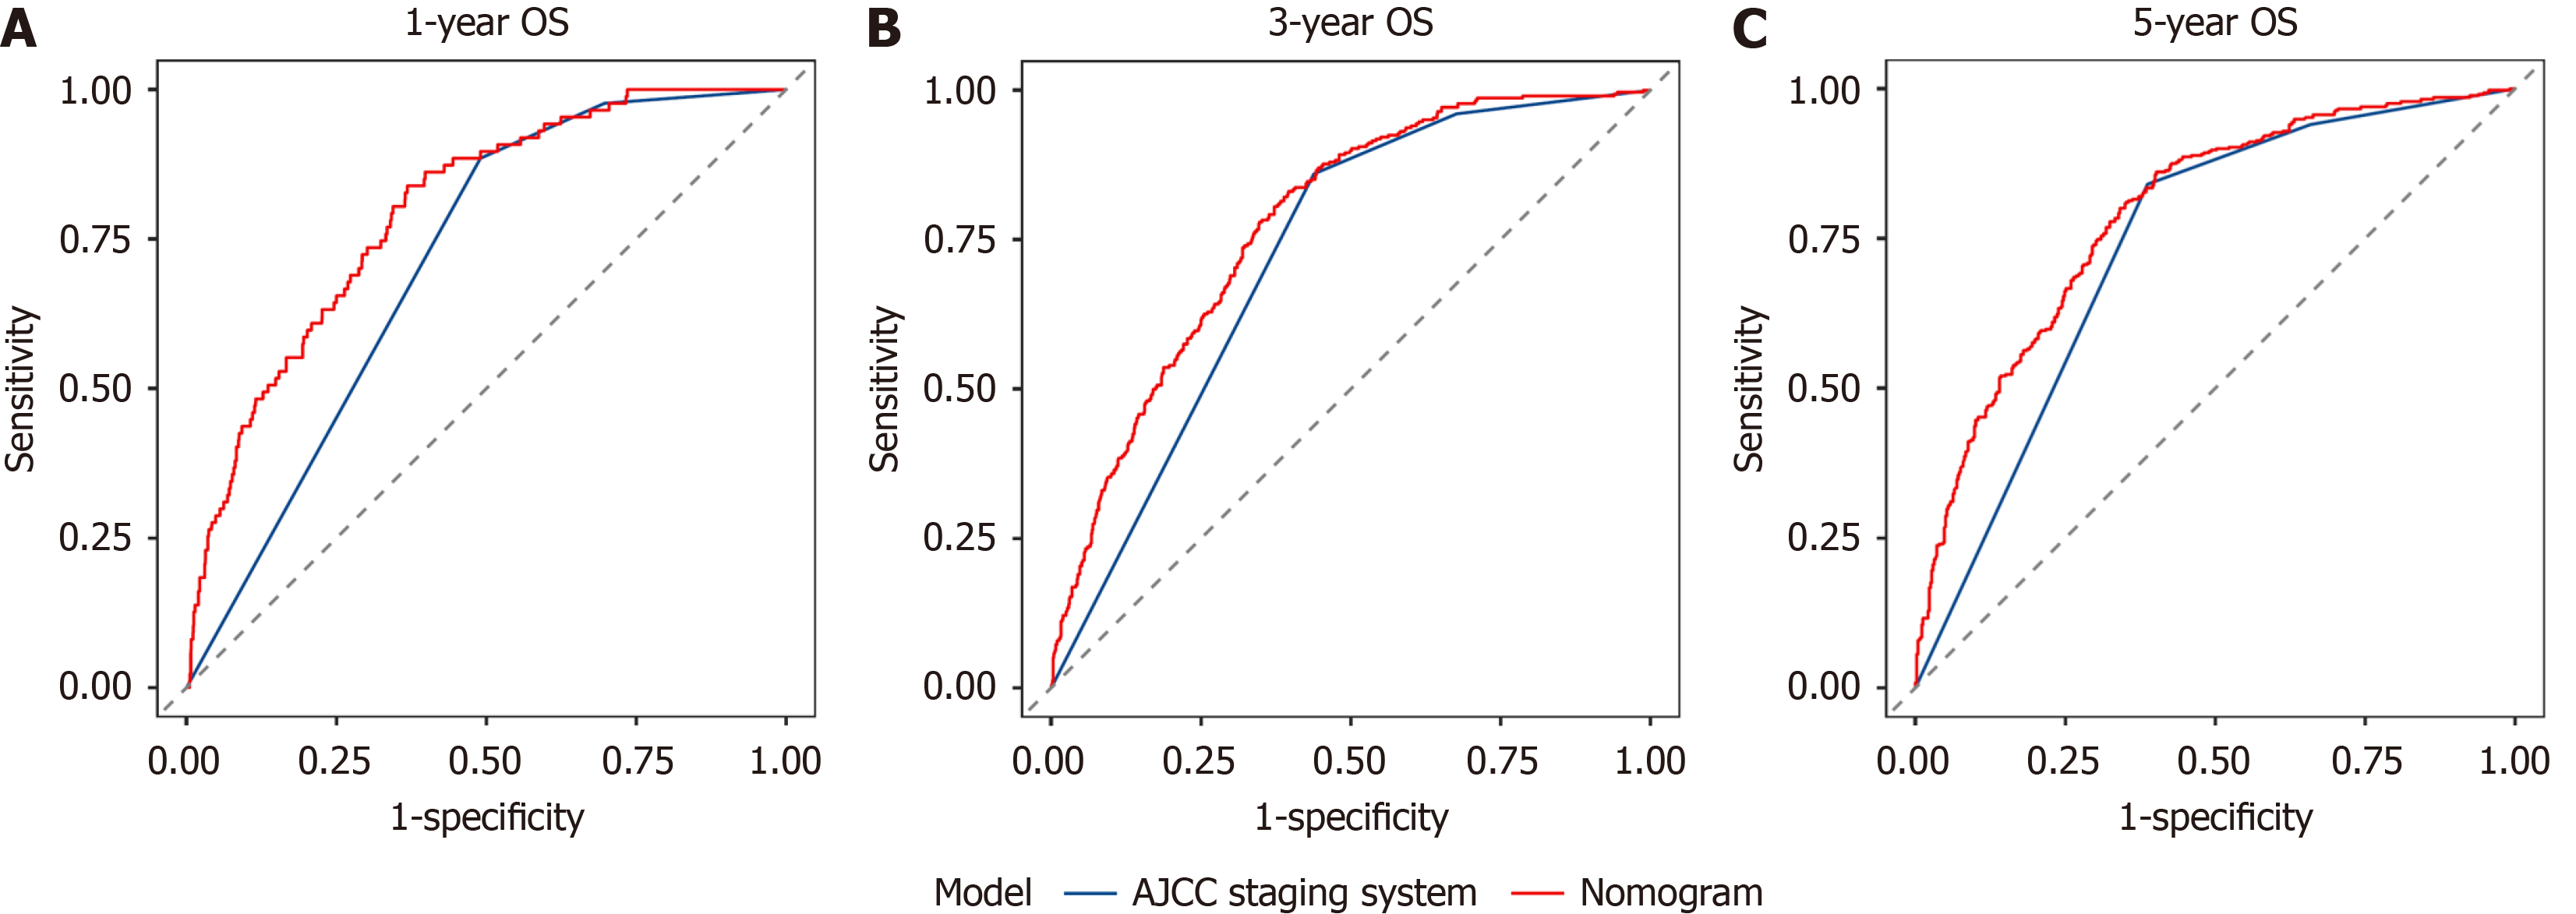
Figure 6 Time-dependent receiver operating characteristic curve analysis comparing the nomogram and tumor node metastasis staging systems for predicting overall survival.
A: 1-year; B: 3-year; C: 5-year. The nomogram achieved significantly higher area under the curve values at all timepoints (P < 0.001), underscoring its clinical utility for survival prediction. OS: Overall survival; AJCC: American Joint Committee on Cancer.
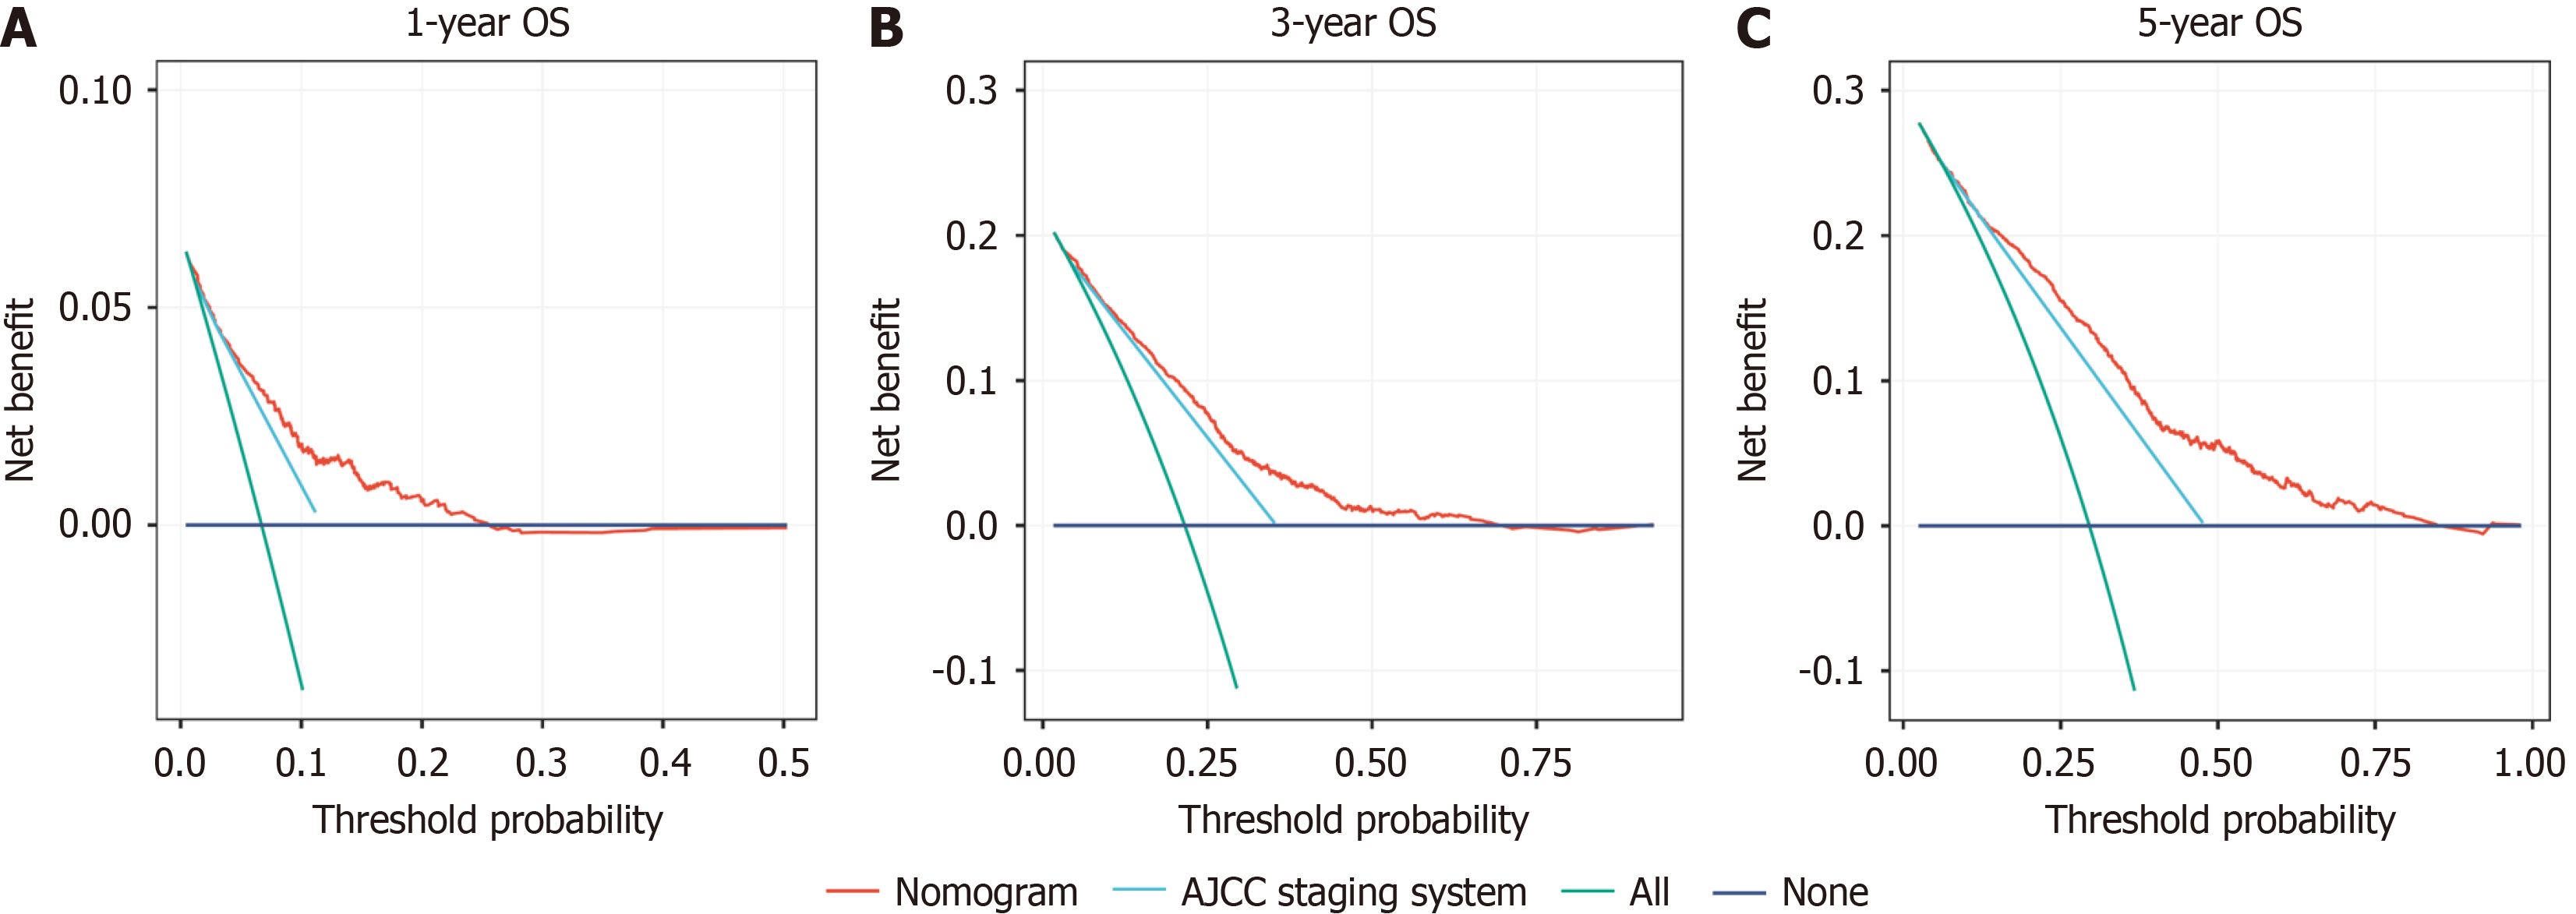
Figure 7 Decision curve analysis comparing the nomogram and tumor node metastasis staging systems for overall survival.
A: 1-year; B: 3-year; C: 5-year. The nomogram provided greater net benefit than tumor node metastasis staging across clinically relevant threshold probabilities (10%-90%), validating its utility for guiding therapeutic decisions. OS: Overall survival; AJCC: American Joint Committee on Cancer.
- Citation: Hu HT, Wang P, Jiang YJ, Wang HK, Shao XX, Tian YT. Nomogram-based prognostic stratification for resectable gastric signet-ring cell carcinoma and adenocarcinoma: A retrospective cohort study. World J Gastrointest Oncol 2025; 17(5): 106244
- URL: https://www.wjgnet.com/1948-5204/full/v17/i5/106244.htm
- DOI: https://dx.doi.org/10.4251/wjgo.v17.i5.106244


