Copyright
©The Author(s) 2025.
World J Gastrointest Oncol. May 15, 2025; 17(5): 106244
Published online May 15, 2025. doi: 10.4251/wjgo.v17.i5.106244
Published online May 15, 2025. doi: 10.4251/wjgo.v17.i5.106244
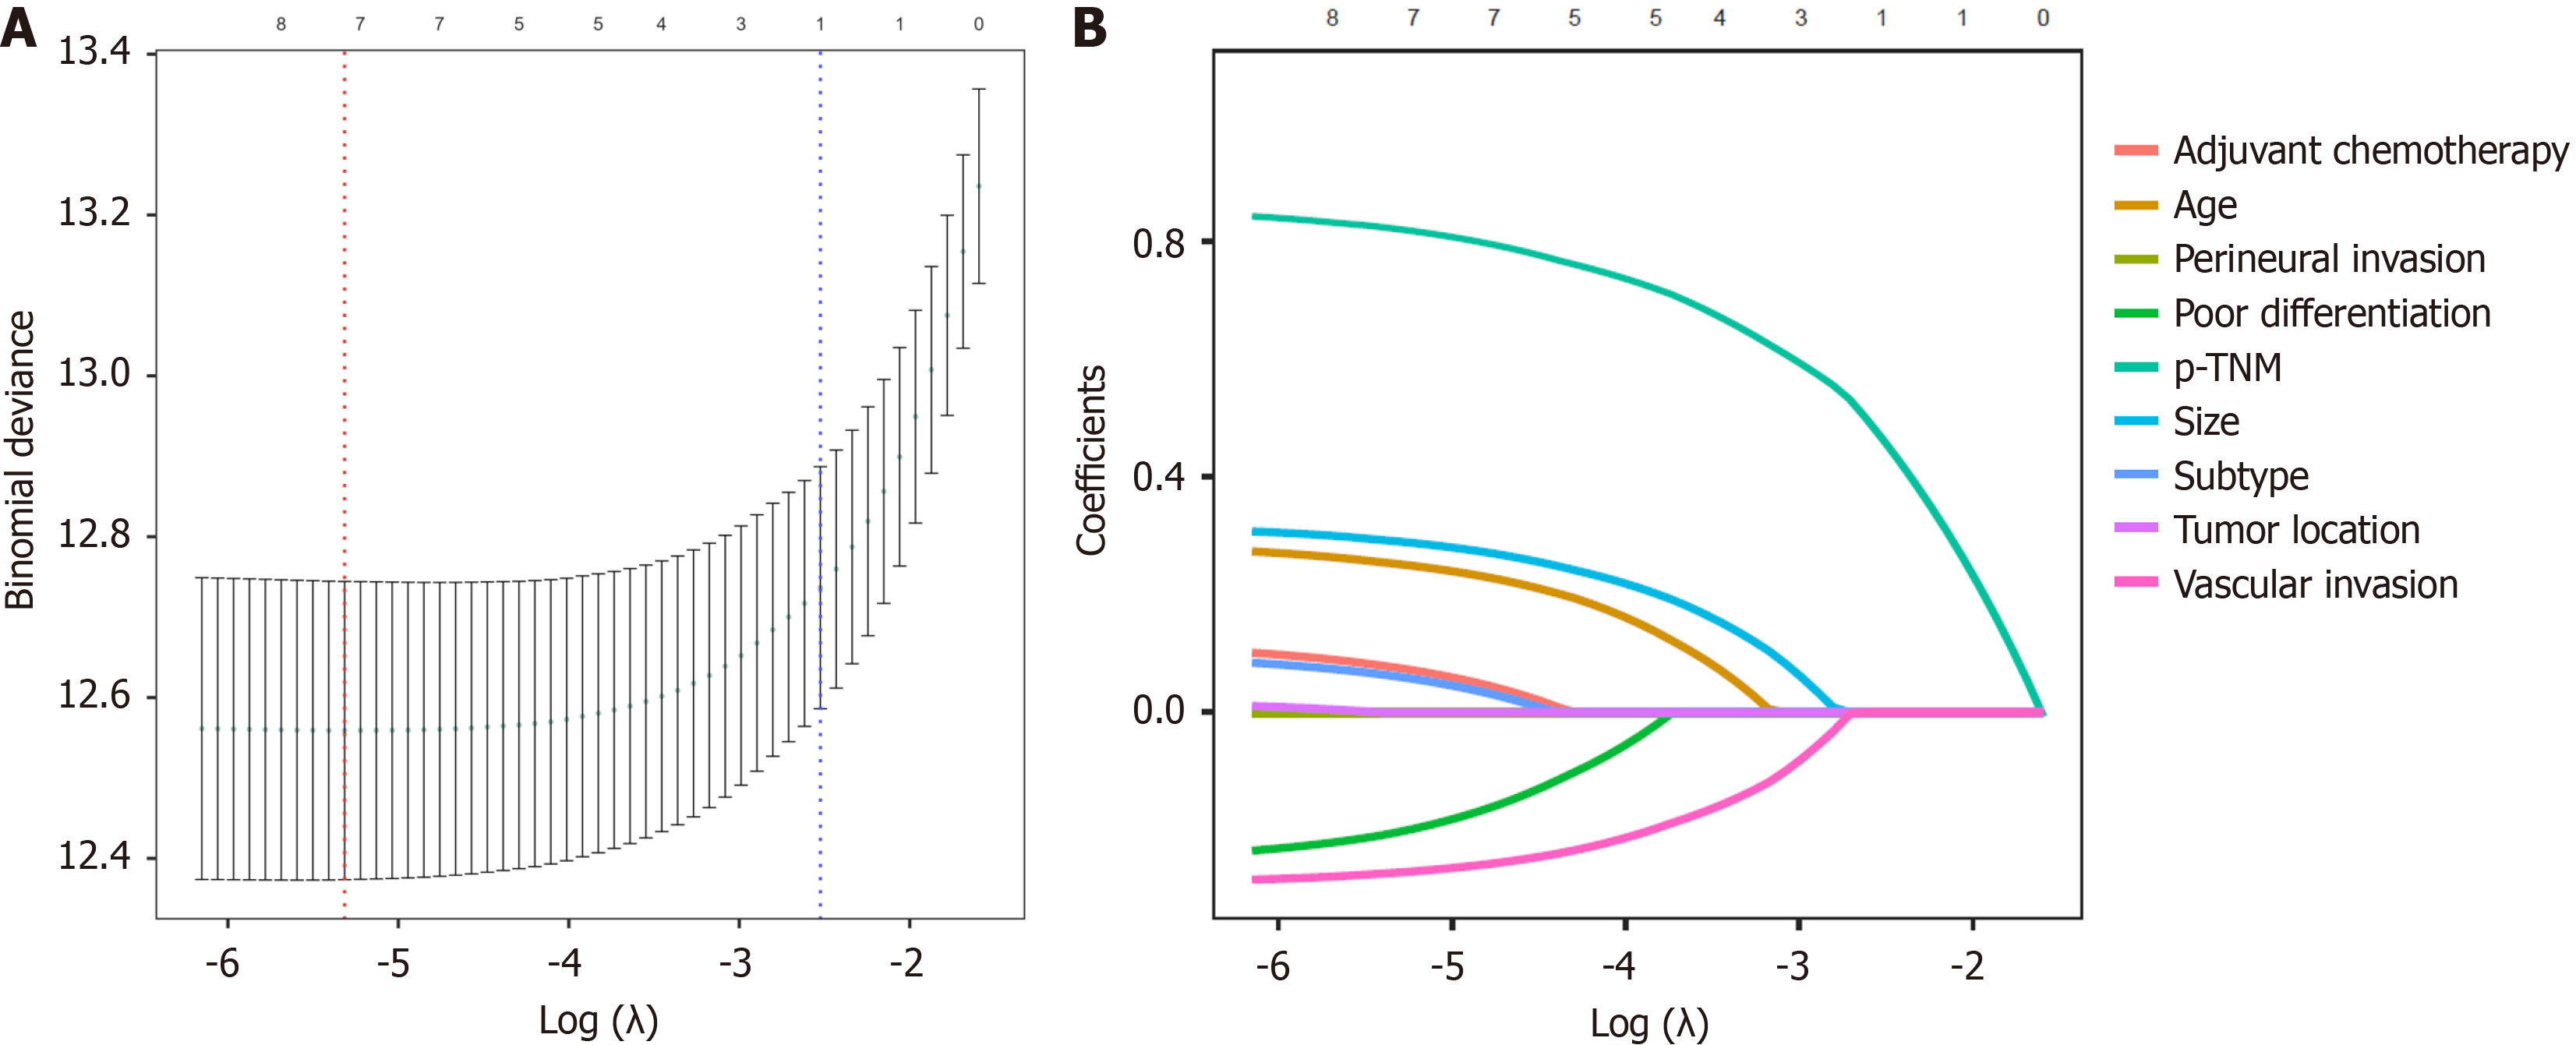
Figure 2 Variable selection via least absolute shrinkage and selection operator Cox regression.
A: Coefficient profiles of clinicopathological variables in the least absolute shrinkage and selection operator model. The upper x-axis indicates the number of non-zero coefficients, while the y-axis represents coefficient magnitudes. Nine variables were evaluated, including subtype, age, tumor location, tumor size, poor differentiation, perineural invasion, vascular invasion, post-treatment nodal margin stage, and adjuvant chemotherapy; B: Optimal lambda (λ) selection using 10-fold cross-validation (minimum criterion). The vertical dashed lines correspond to λminimum (left, minimizing cross-validated error) and λ1se (right, within one standard error of the minimum). The upper x-axis denotes retained variables after shrinkage. pTNM: Post-treatment nodal margin.
- Citation: Hu HT, Wang P, Jiang YJ, Wang HK, Shao XX, Tian YT. Nomogram-based prognostic stratification for resectable gastric signet-ring cell carcinoma and adenocarcinoma: A retrospective cohort study. World J Gastrointest Oncol 2025; 17(5): 106244
- URL: https://www.wjgnet.com/1948-5204/full/v17/i5/106244.htm
- DOI: https://dx.doi.org/10.4251/wjgo.v17.i5.106244


