Copyright
©The Author(s) 2025.
World J Gastrointest Oncol. May 15, 2025; 17(5): 106103
Published online May 15, 2025. doi: 10.4251/wjgo.v17.i5.106103
Published online May 15, 2025. doi: 10.4251/wjgo.v17.i5.106103
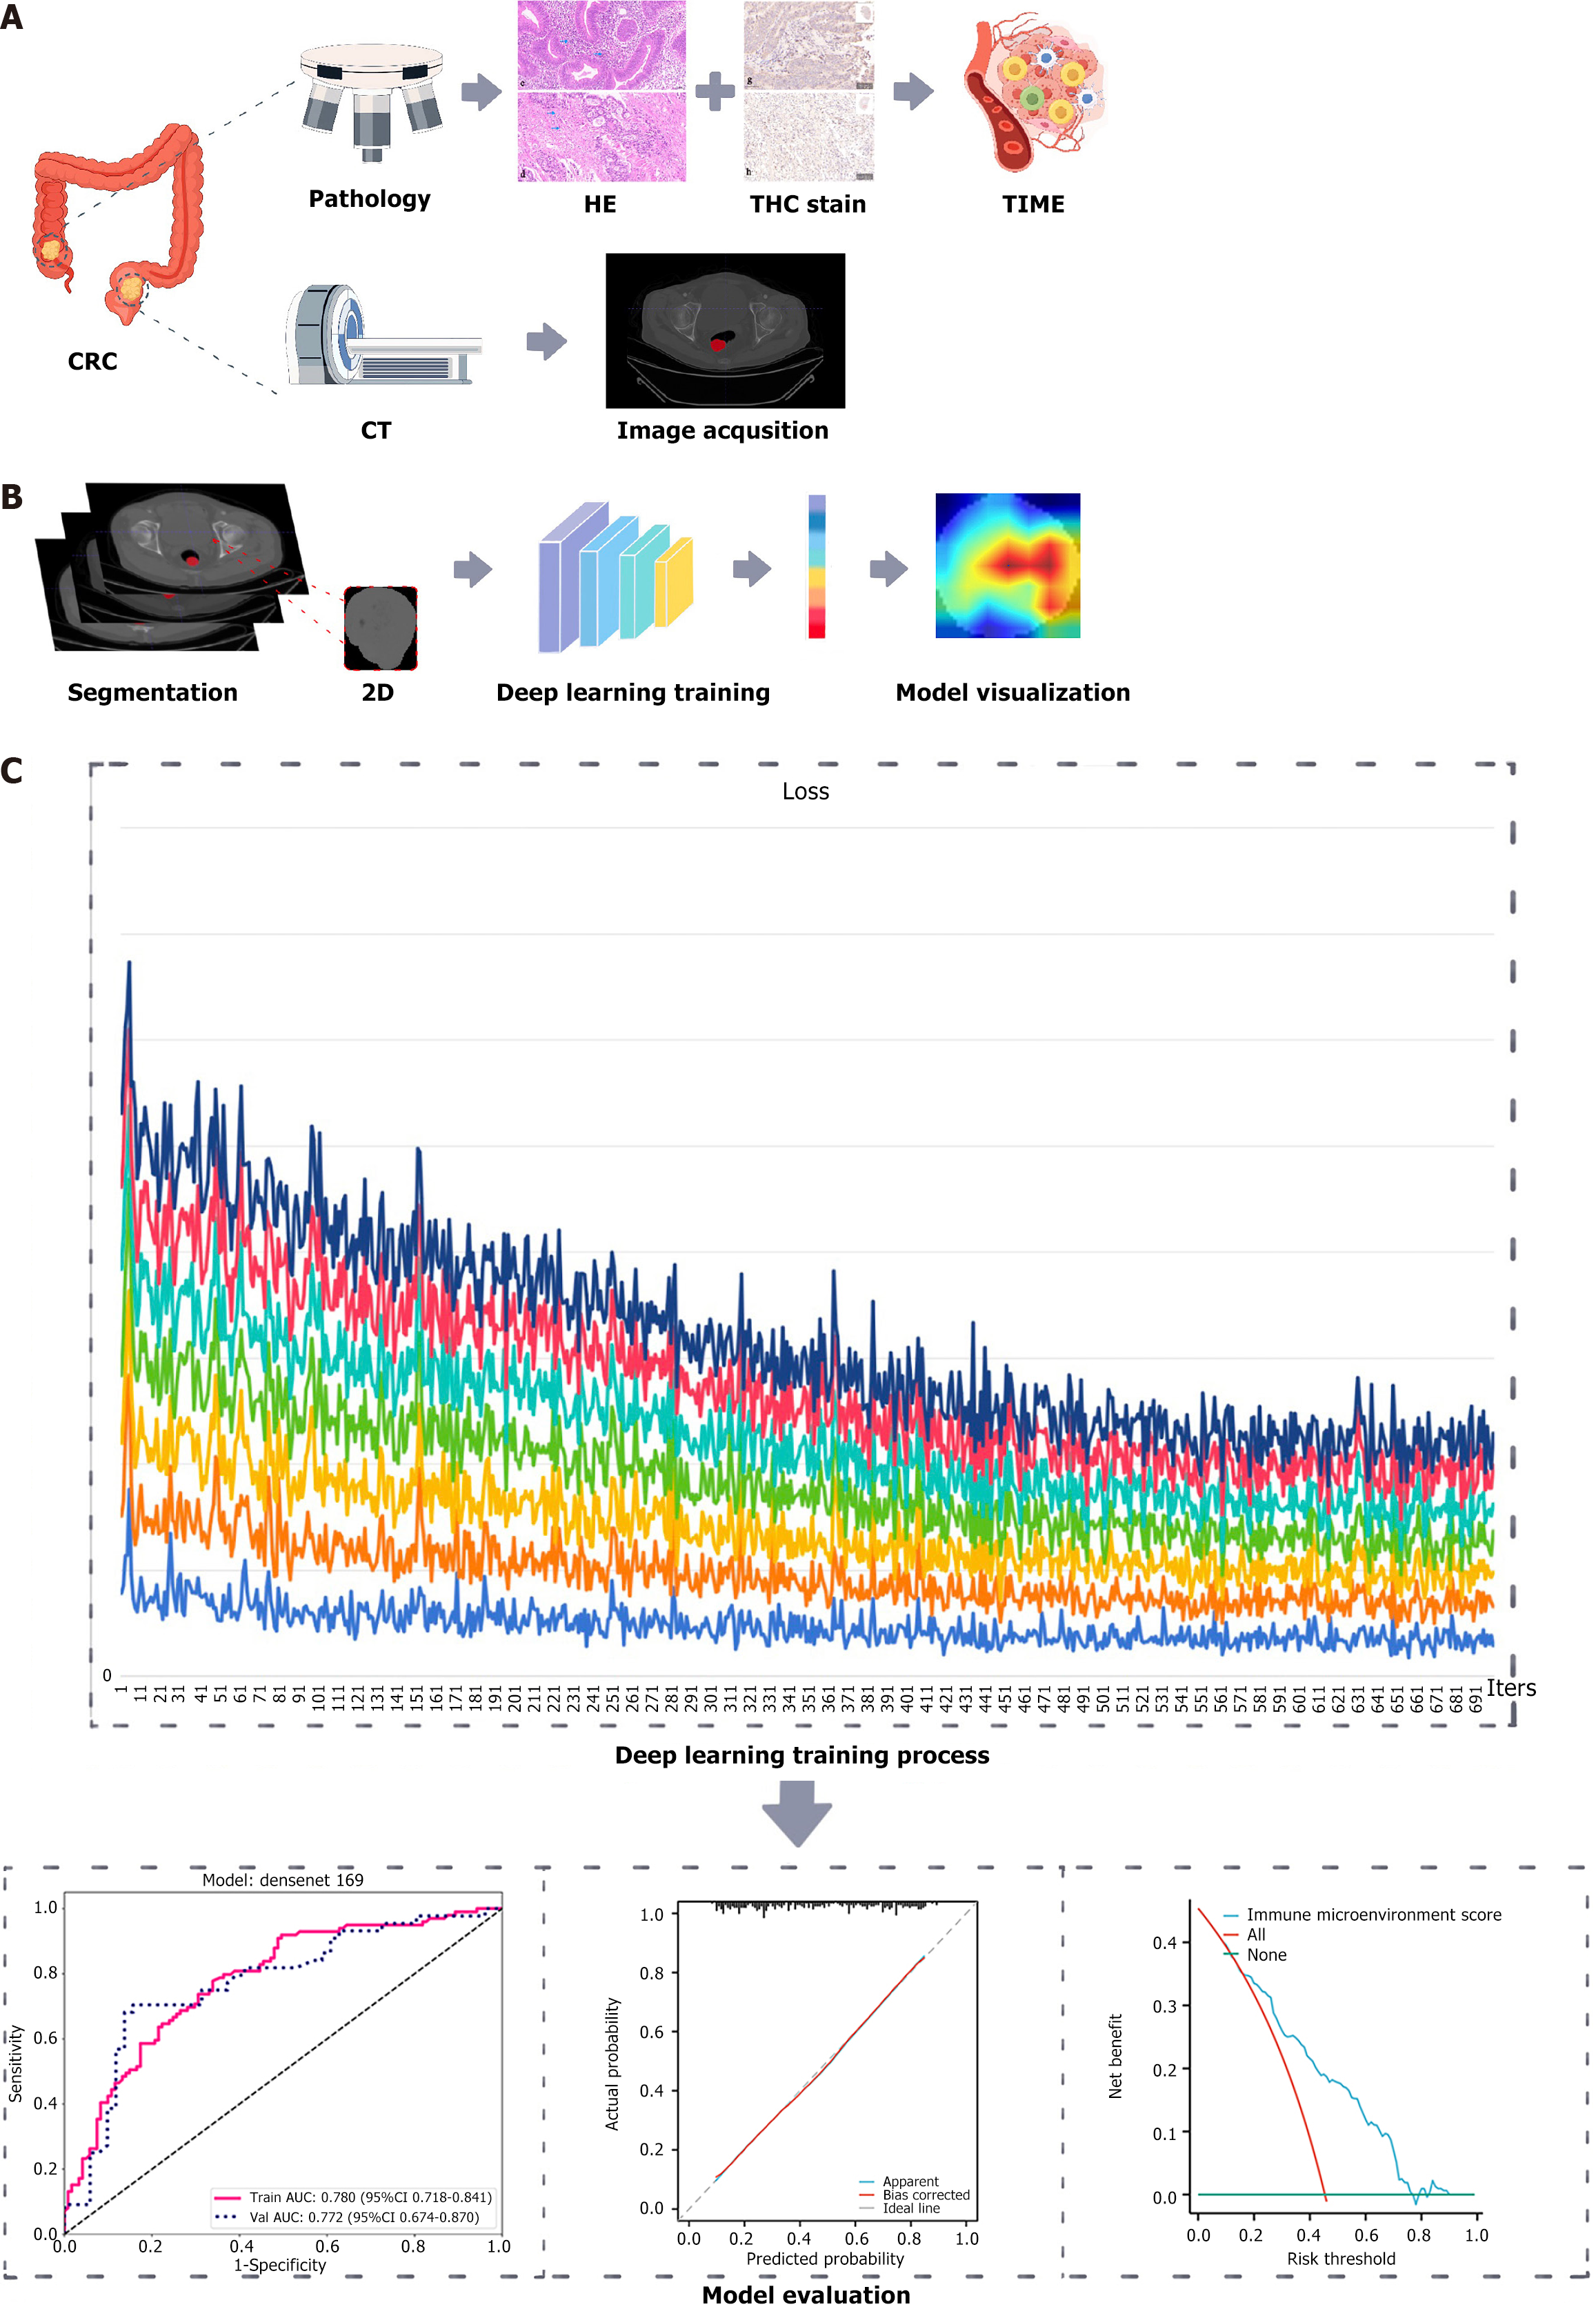
Figure 1 Schematic diagram illustrating the evaluation of colorectal cancer immune microenvironment using deep learning models.
A: Pathology and imaging; B: Model training and visualization; C: Model performance evaluation. CRC: Colorectal cancer; CT: Computed tomography; HE: Hematoxylin-eosin; IHC: Immunohistochemistry; TIME: Tumor immune microenvironment; 2D: Two dimensional.
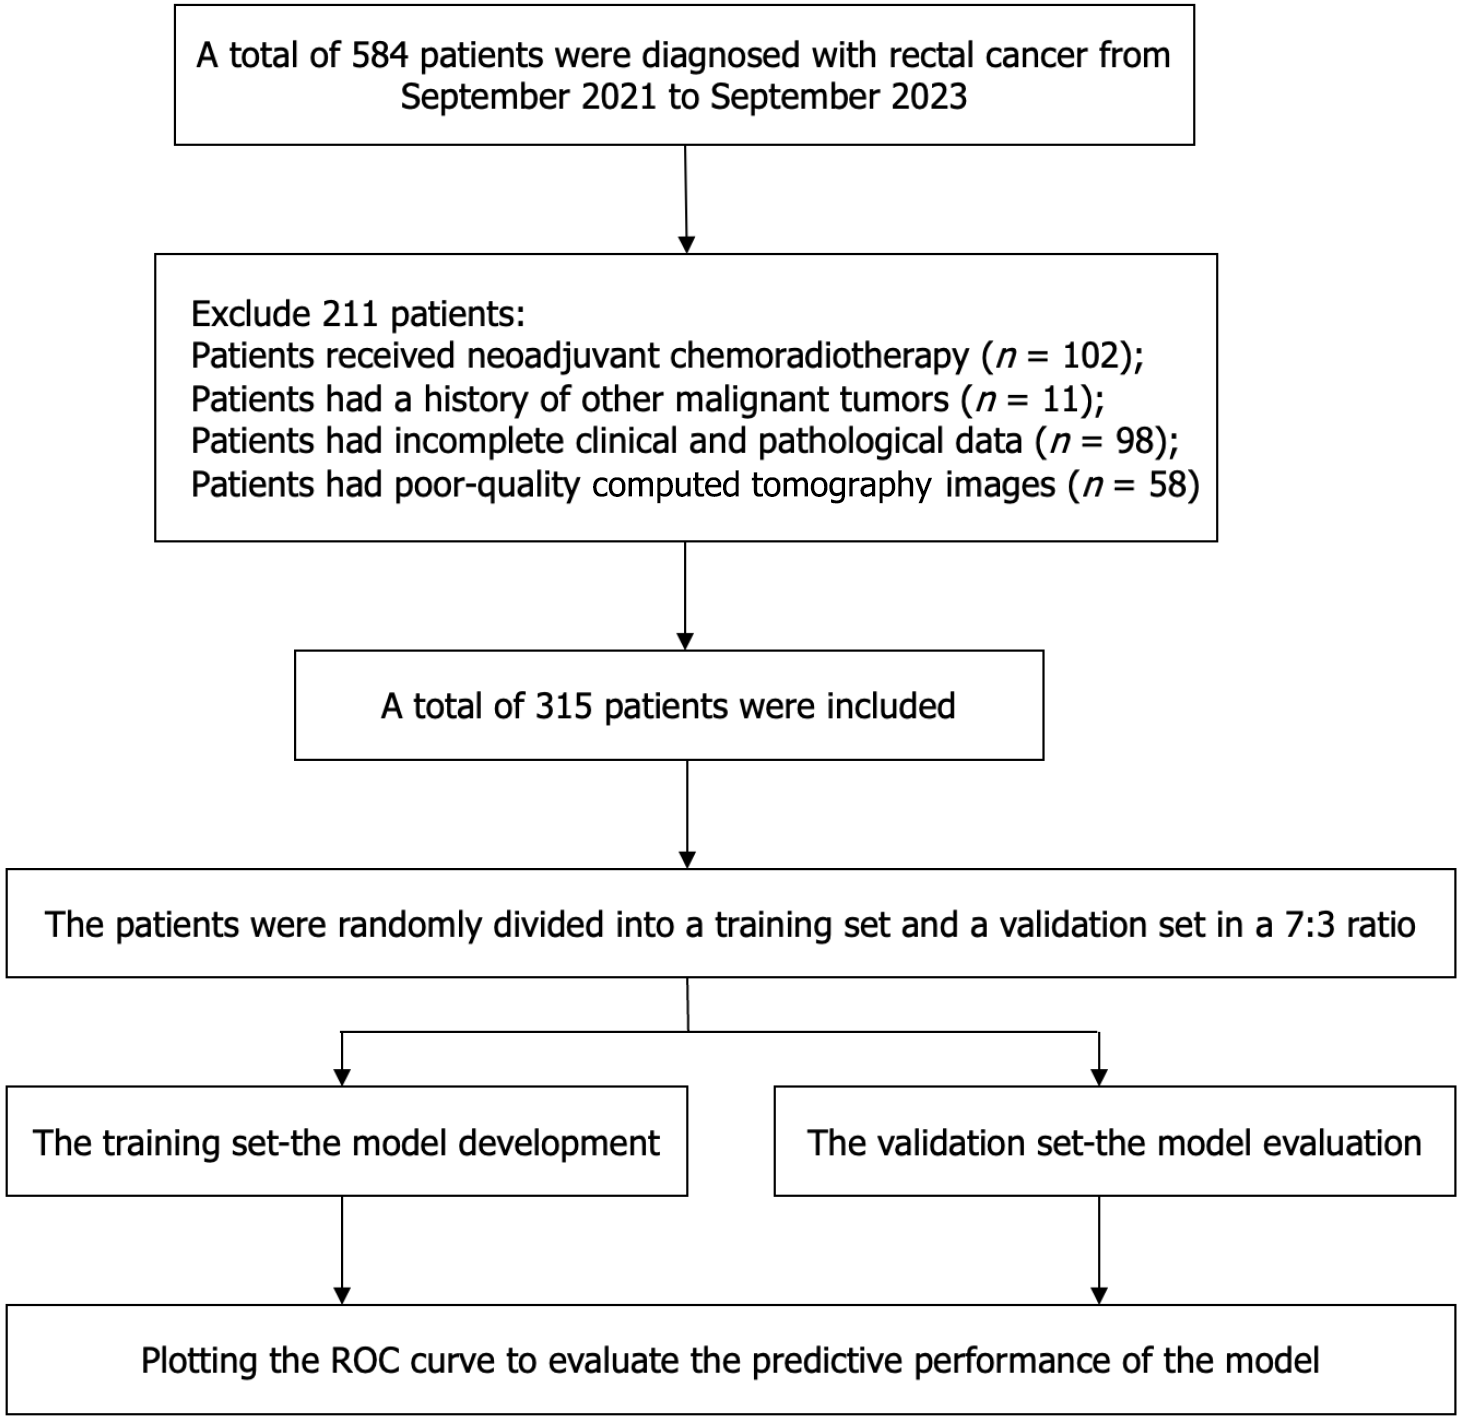
Figure 2 Patient recruitment process.
ROC: Receiver operating characteristic.
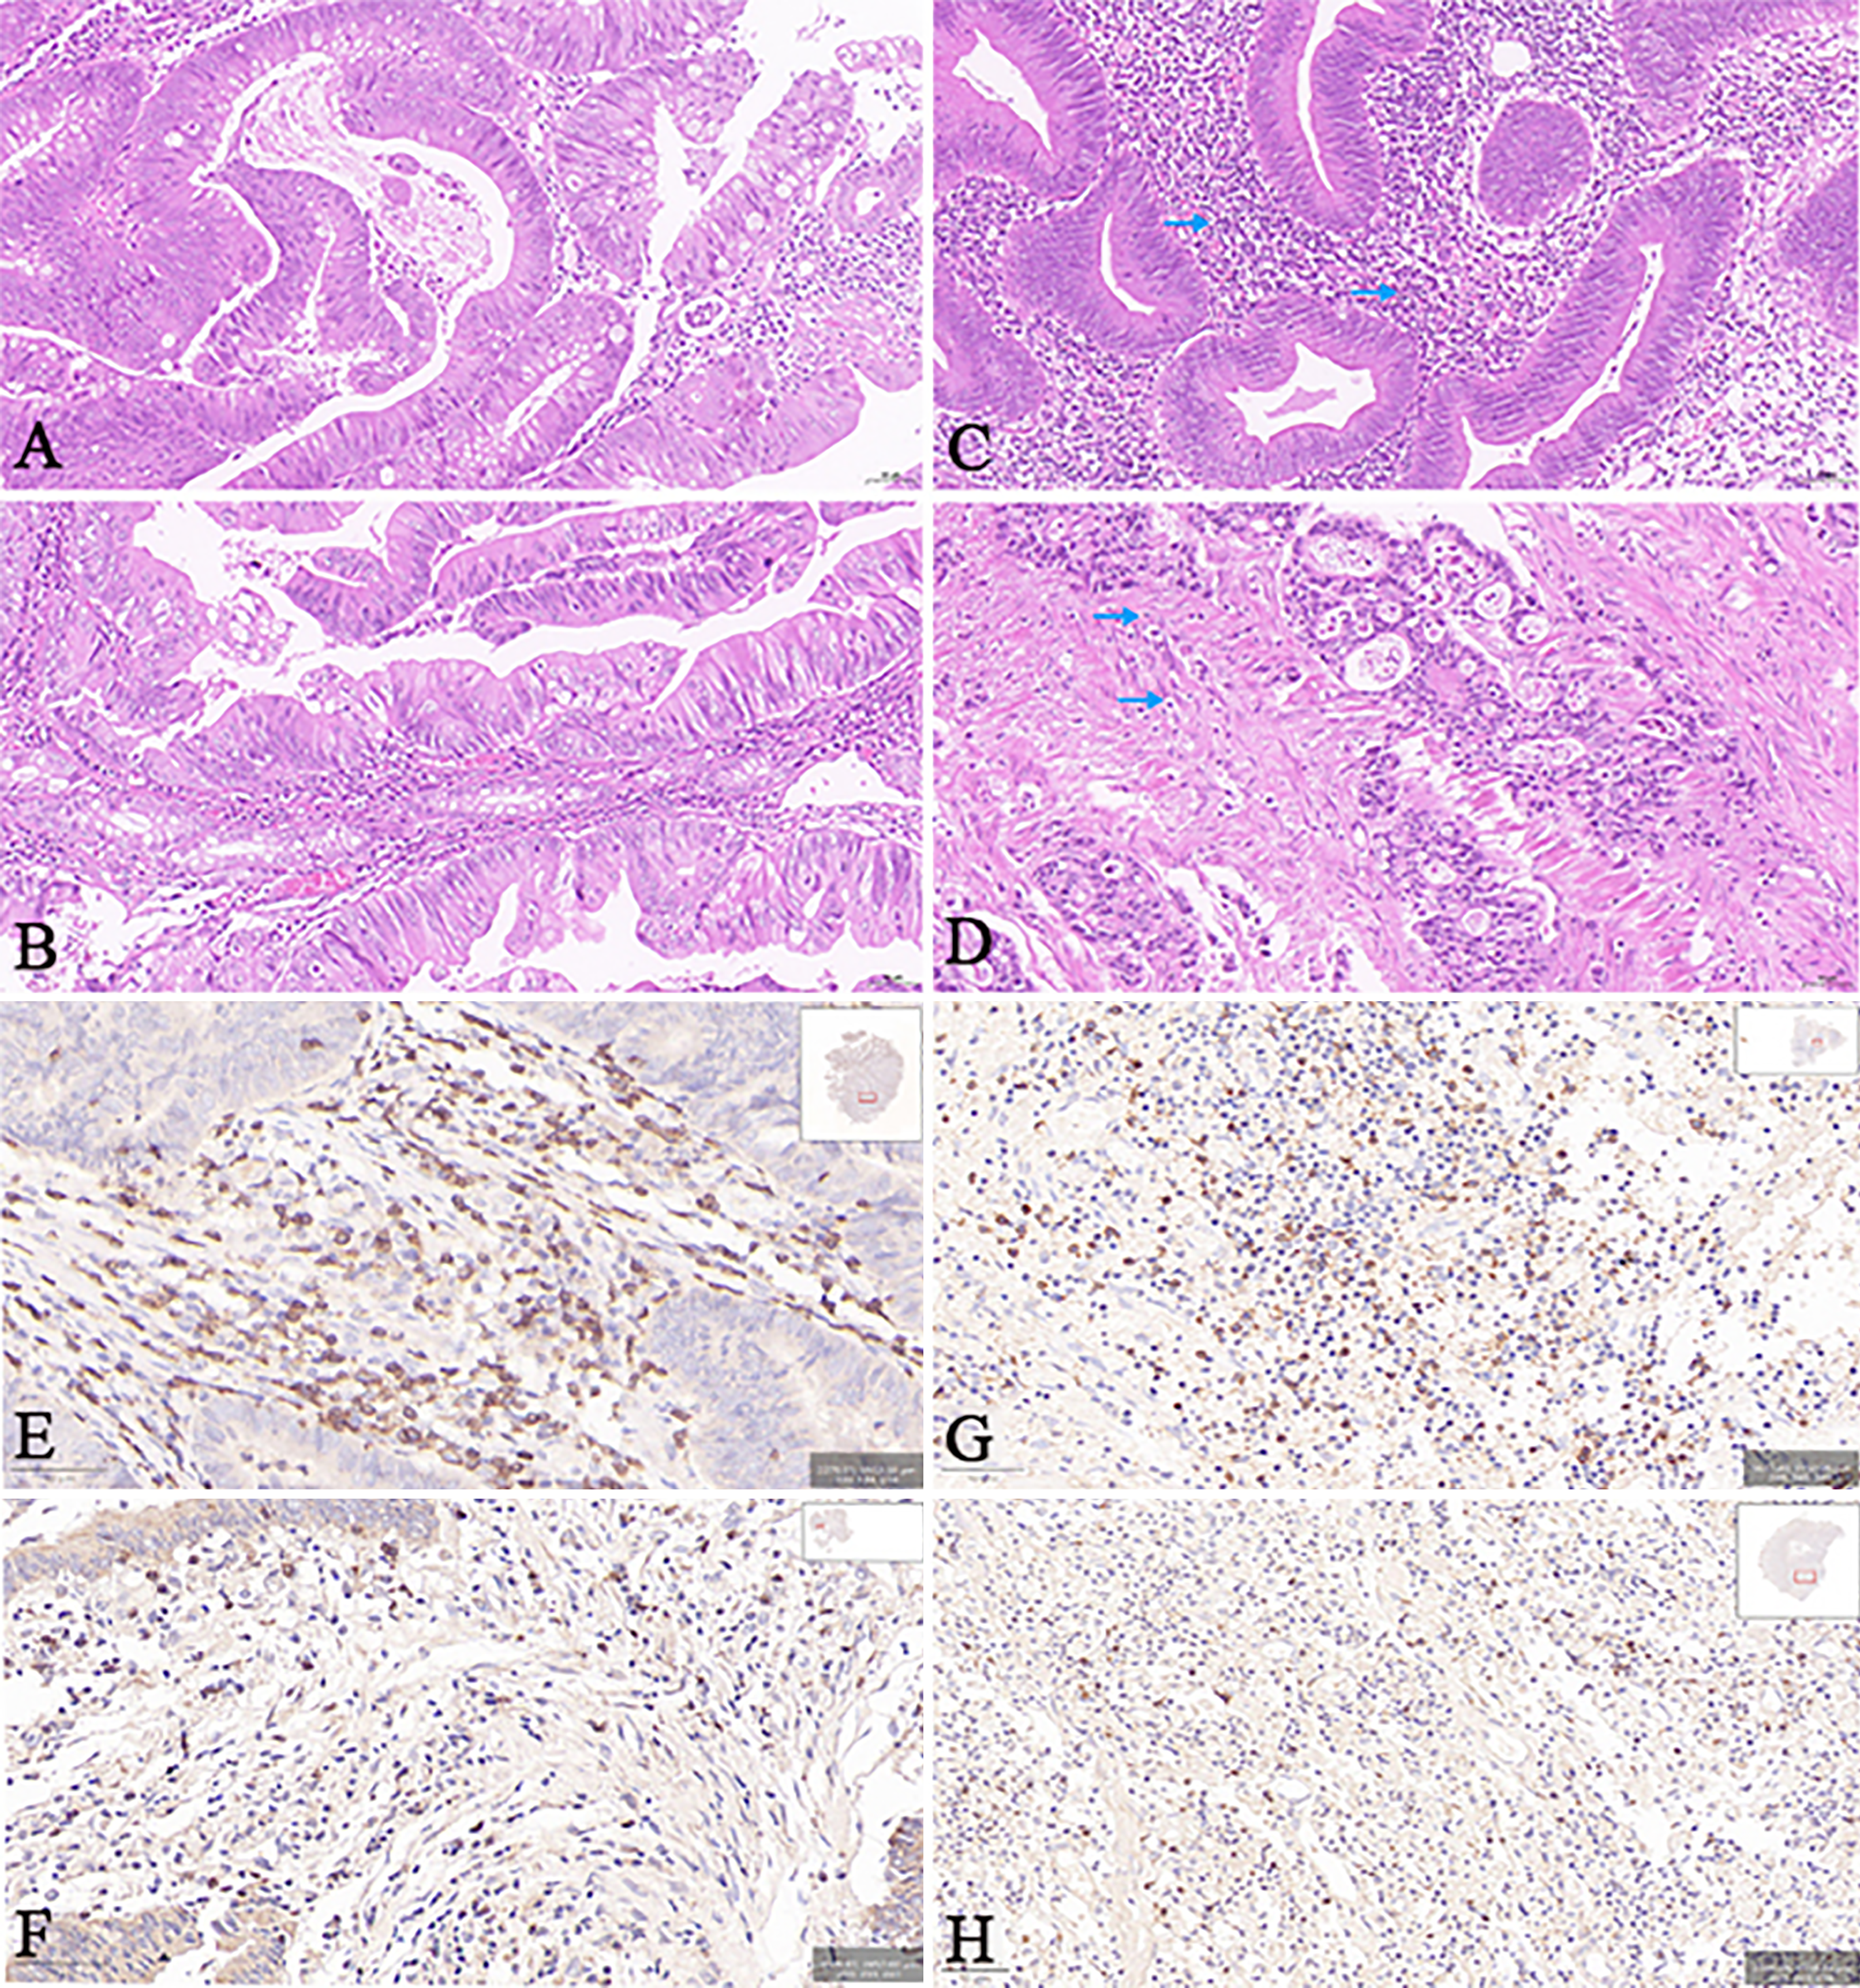
Figure 3 Hematoxylin-eosin staining and immunohistochemistry staining.
A: High stromal proportion; B: Low stromal proportion; C: Abundant lymphocyte infiltration (blue arrow); D: Low lymphocyte infiltration (blue arrow); E: High expression of cluster of differentiation (CD) 3; F: Low expression of CD3; G: High expression of CD8; H: Low expression of CD8.
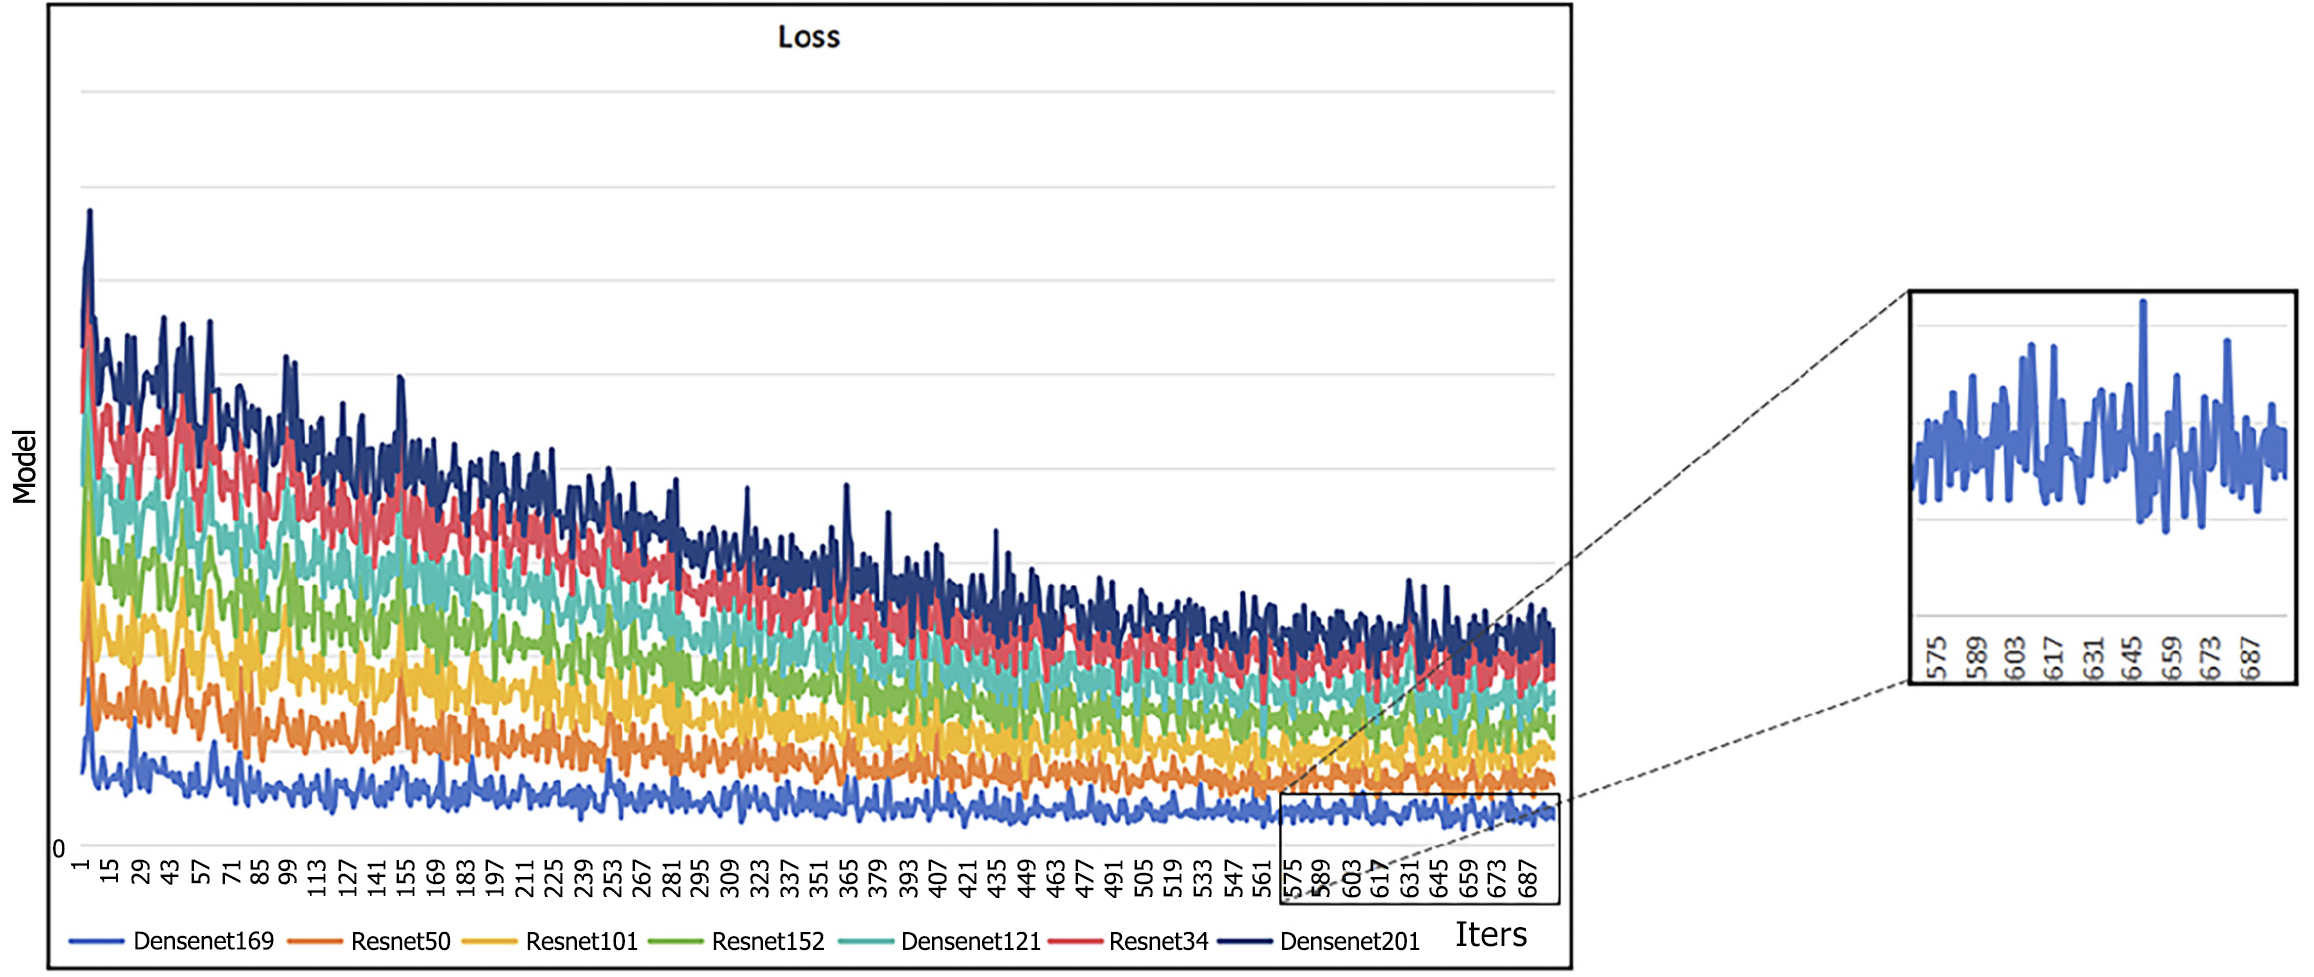
Figure 4 The loss values of different deep learning models in the training set can vary with different iterations.
The horizontal axis represents Iters, and the vertical axis does not represent the specific loss value. For the sake of presentation, we have applied translation and stretching to different curves.
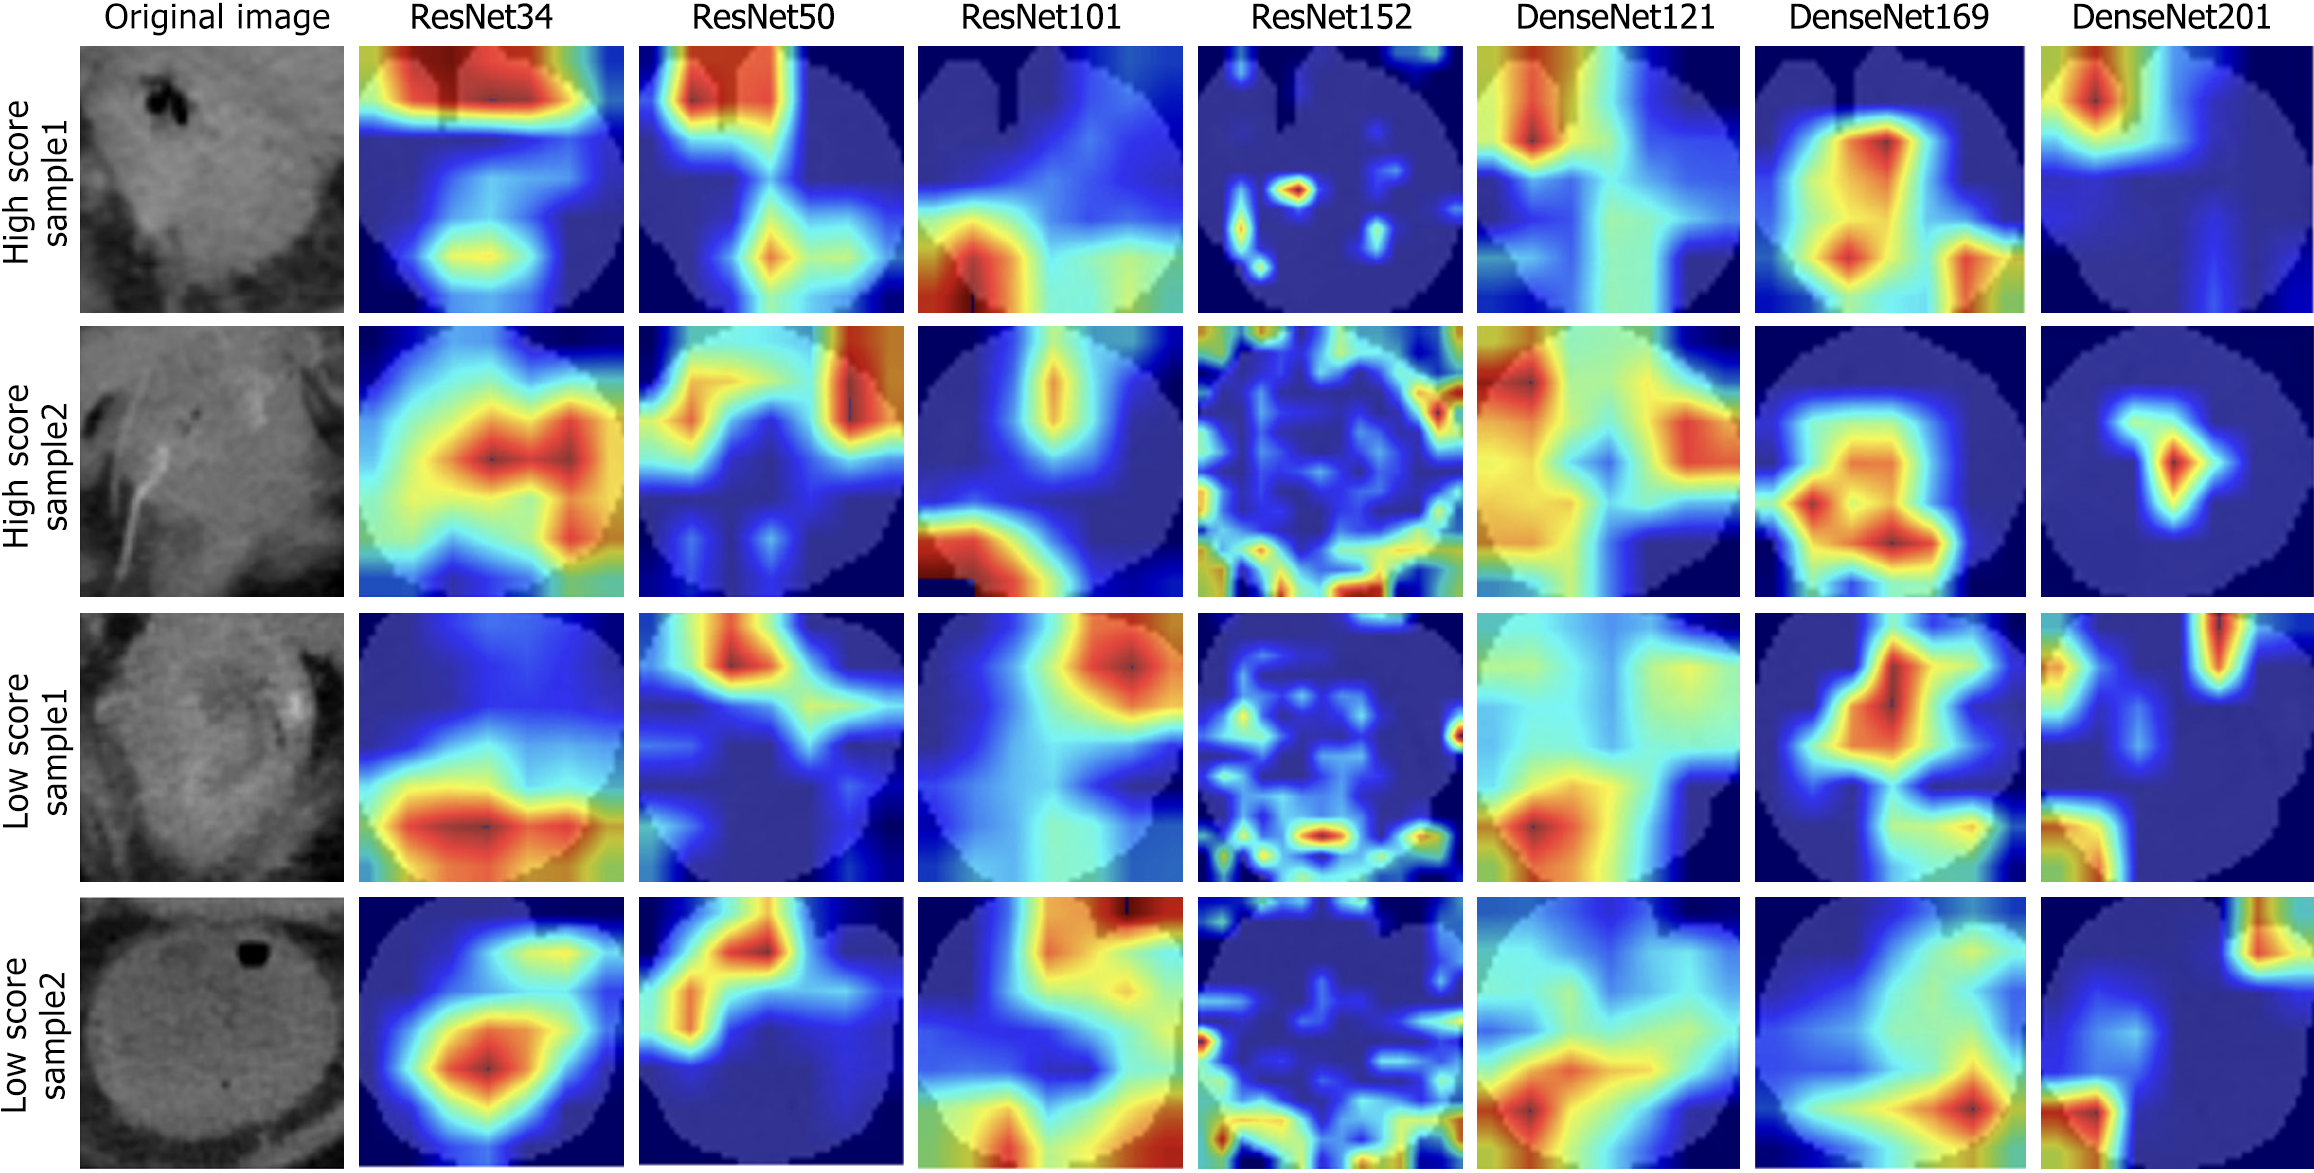
Figure 5 Visualization of convolutional layer features in different deep learning models.
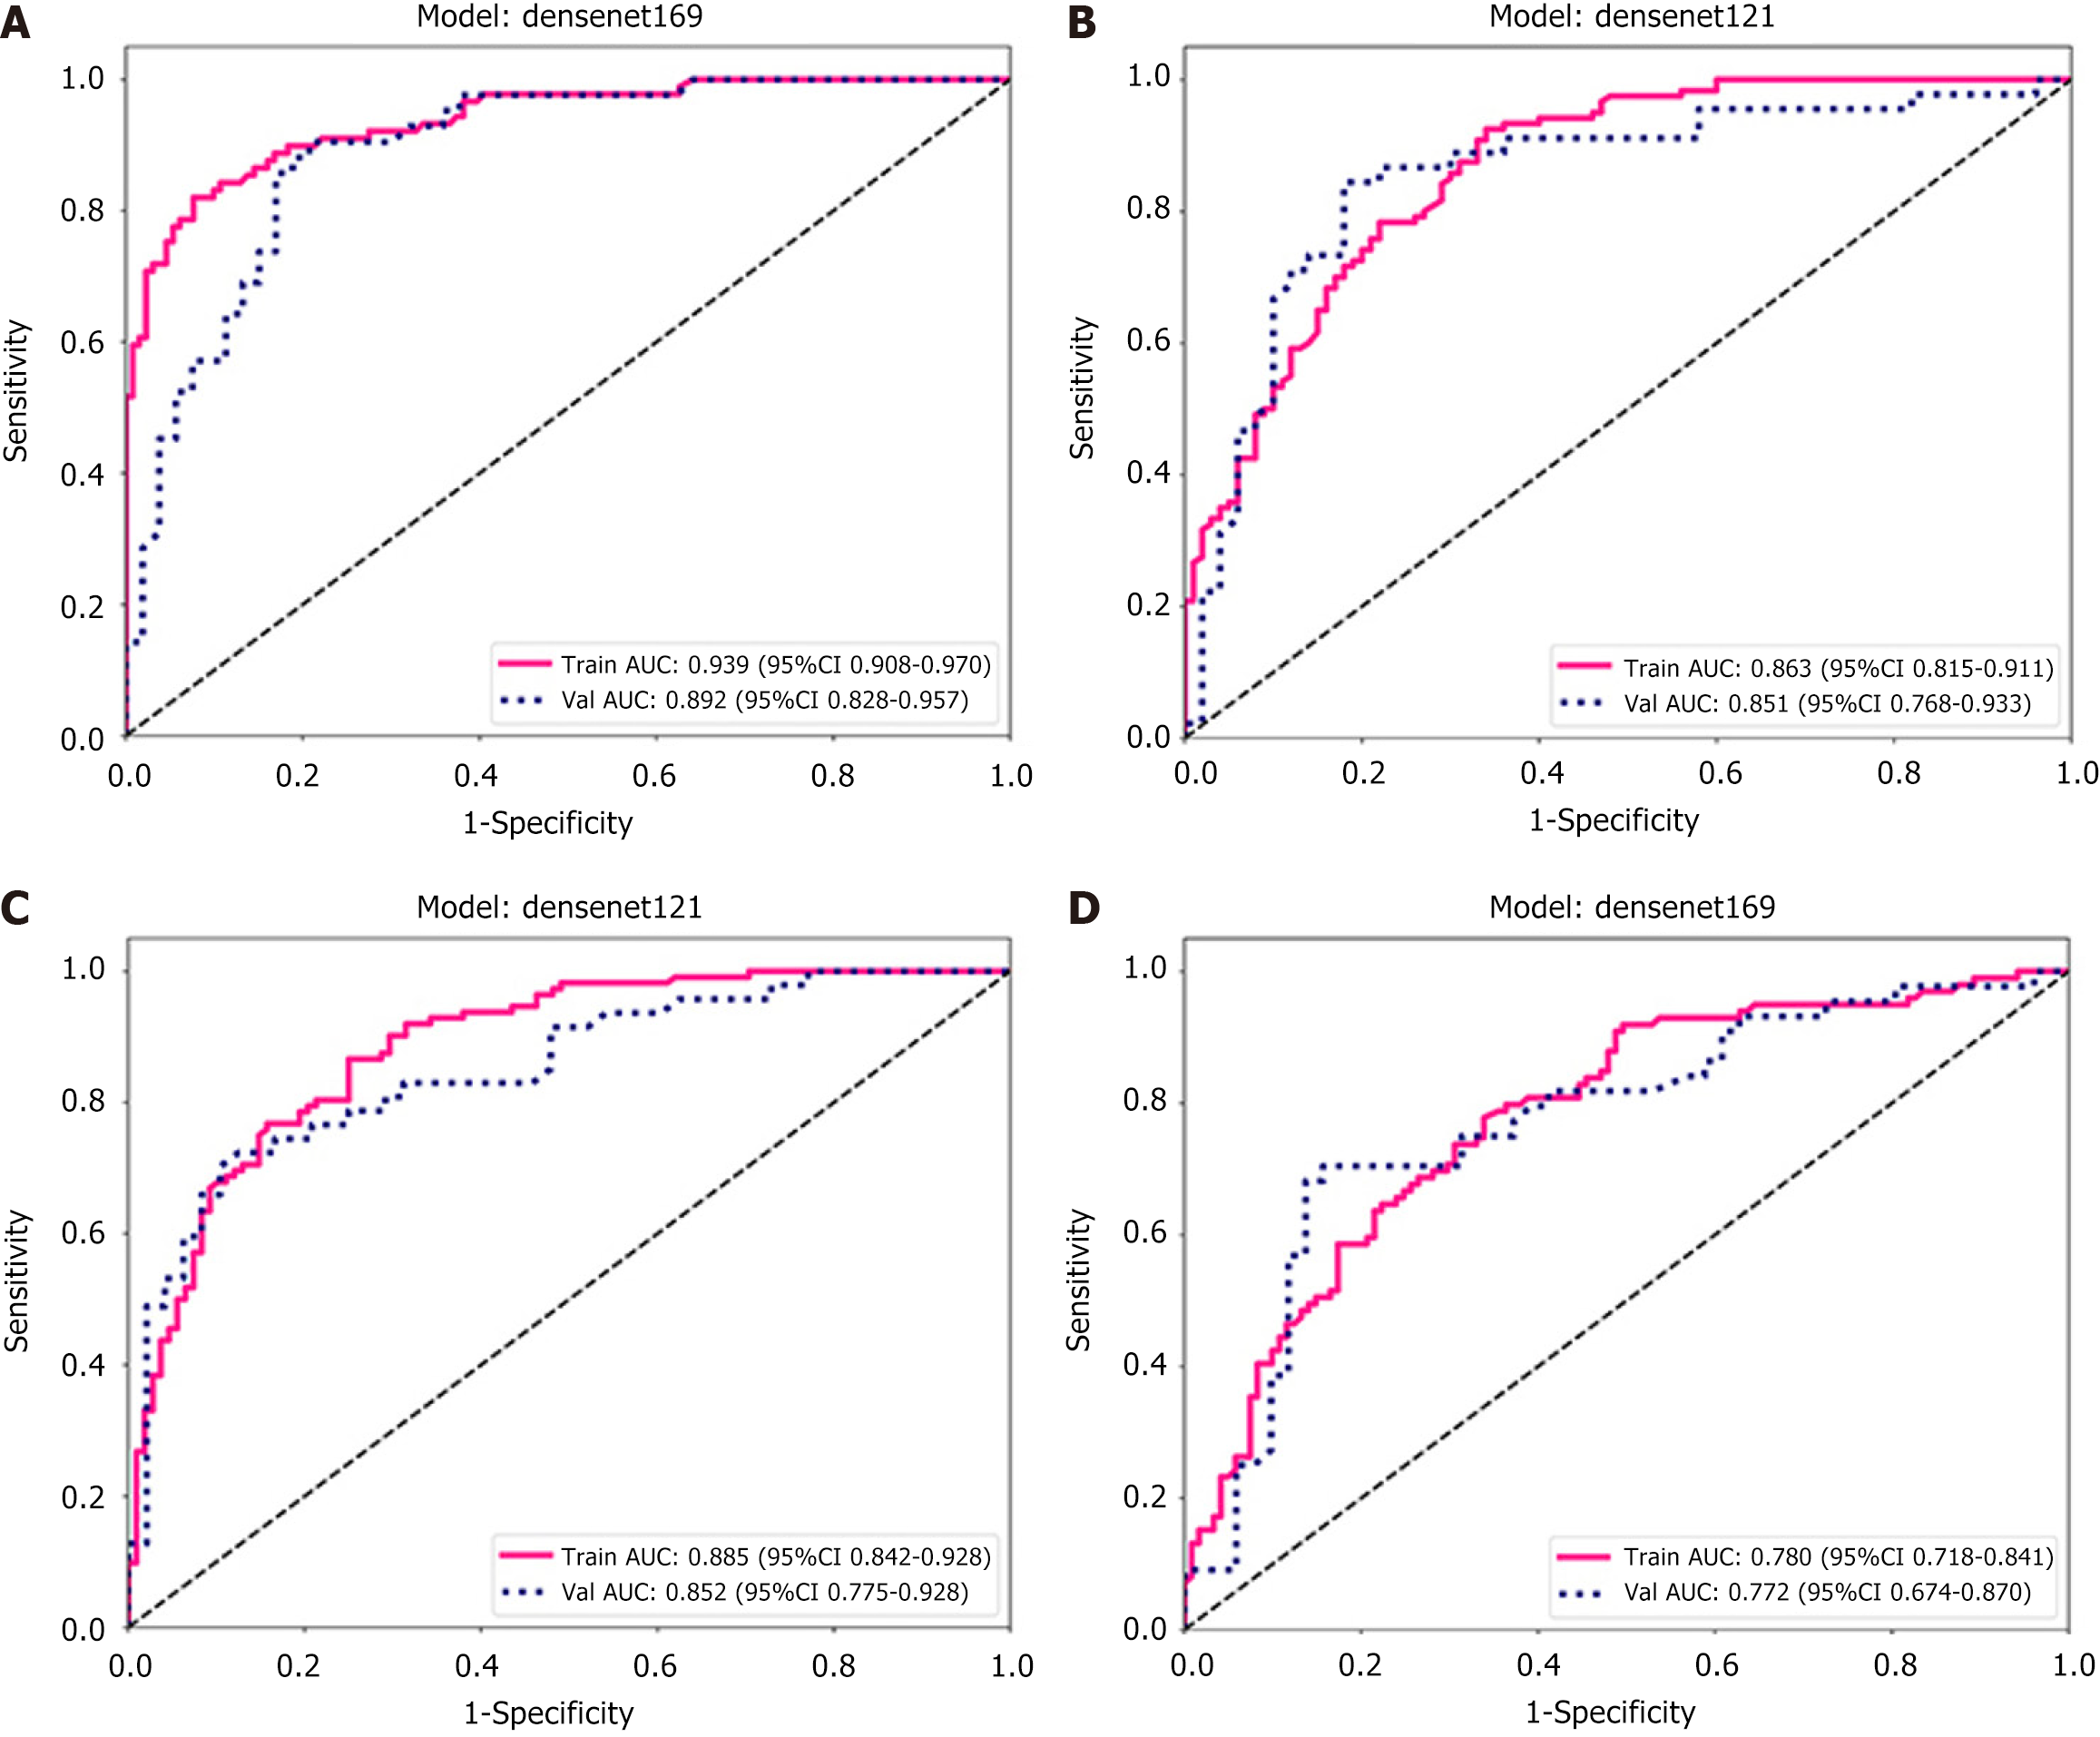
Figure 6 Receiver operating characteristic curve analysis of the model.
A: Tumor-stroma ratio model; B: Tumor-infiltrating lymphocytes model; C: Immune score model; D: Tumor immune microenvironment model. AUC: Area under the curve; CI: Confidence interval.
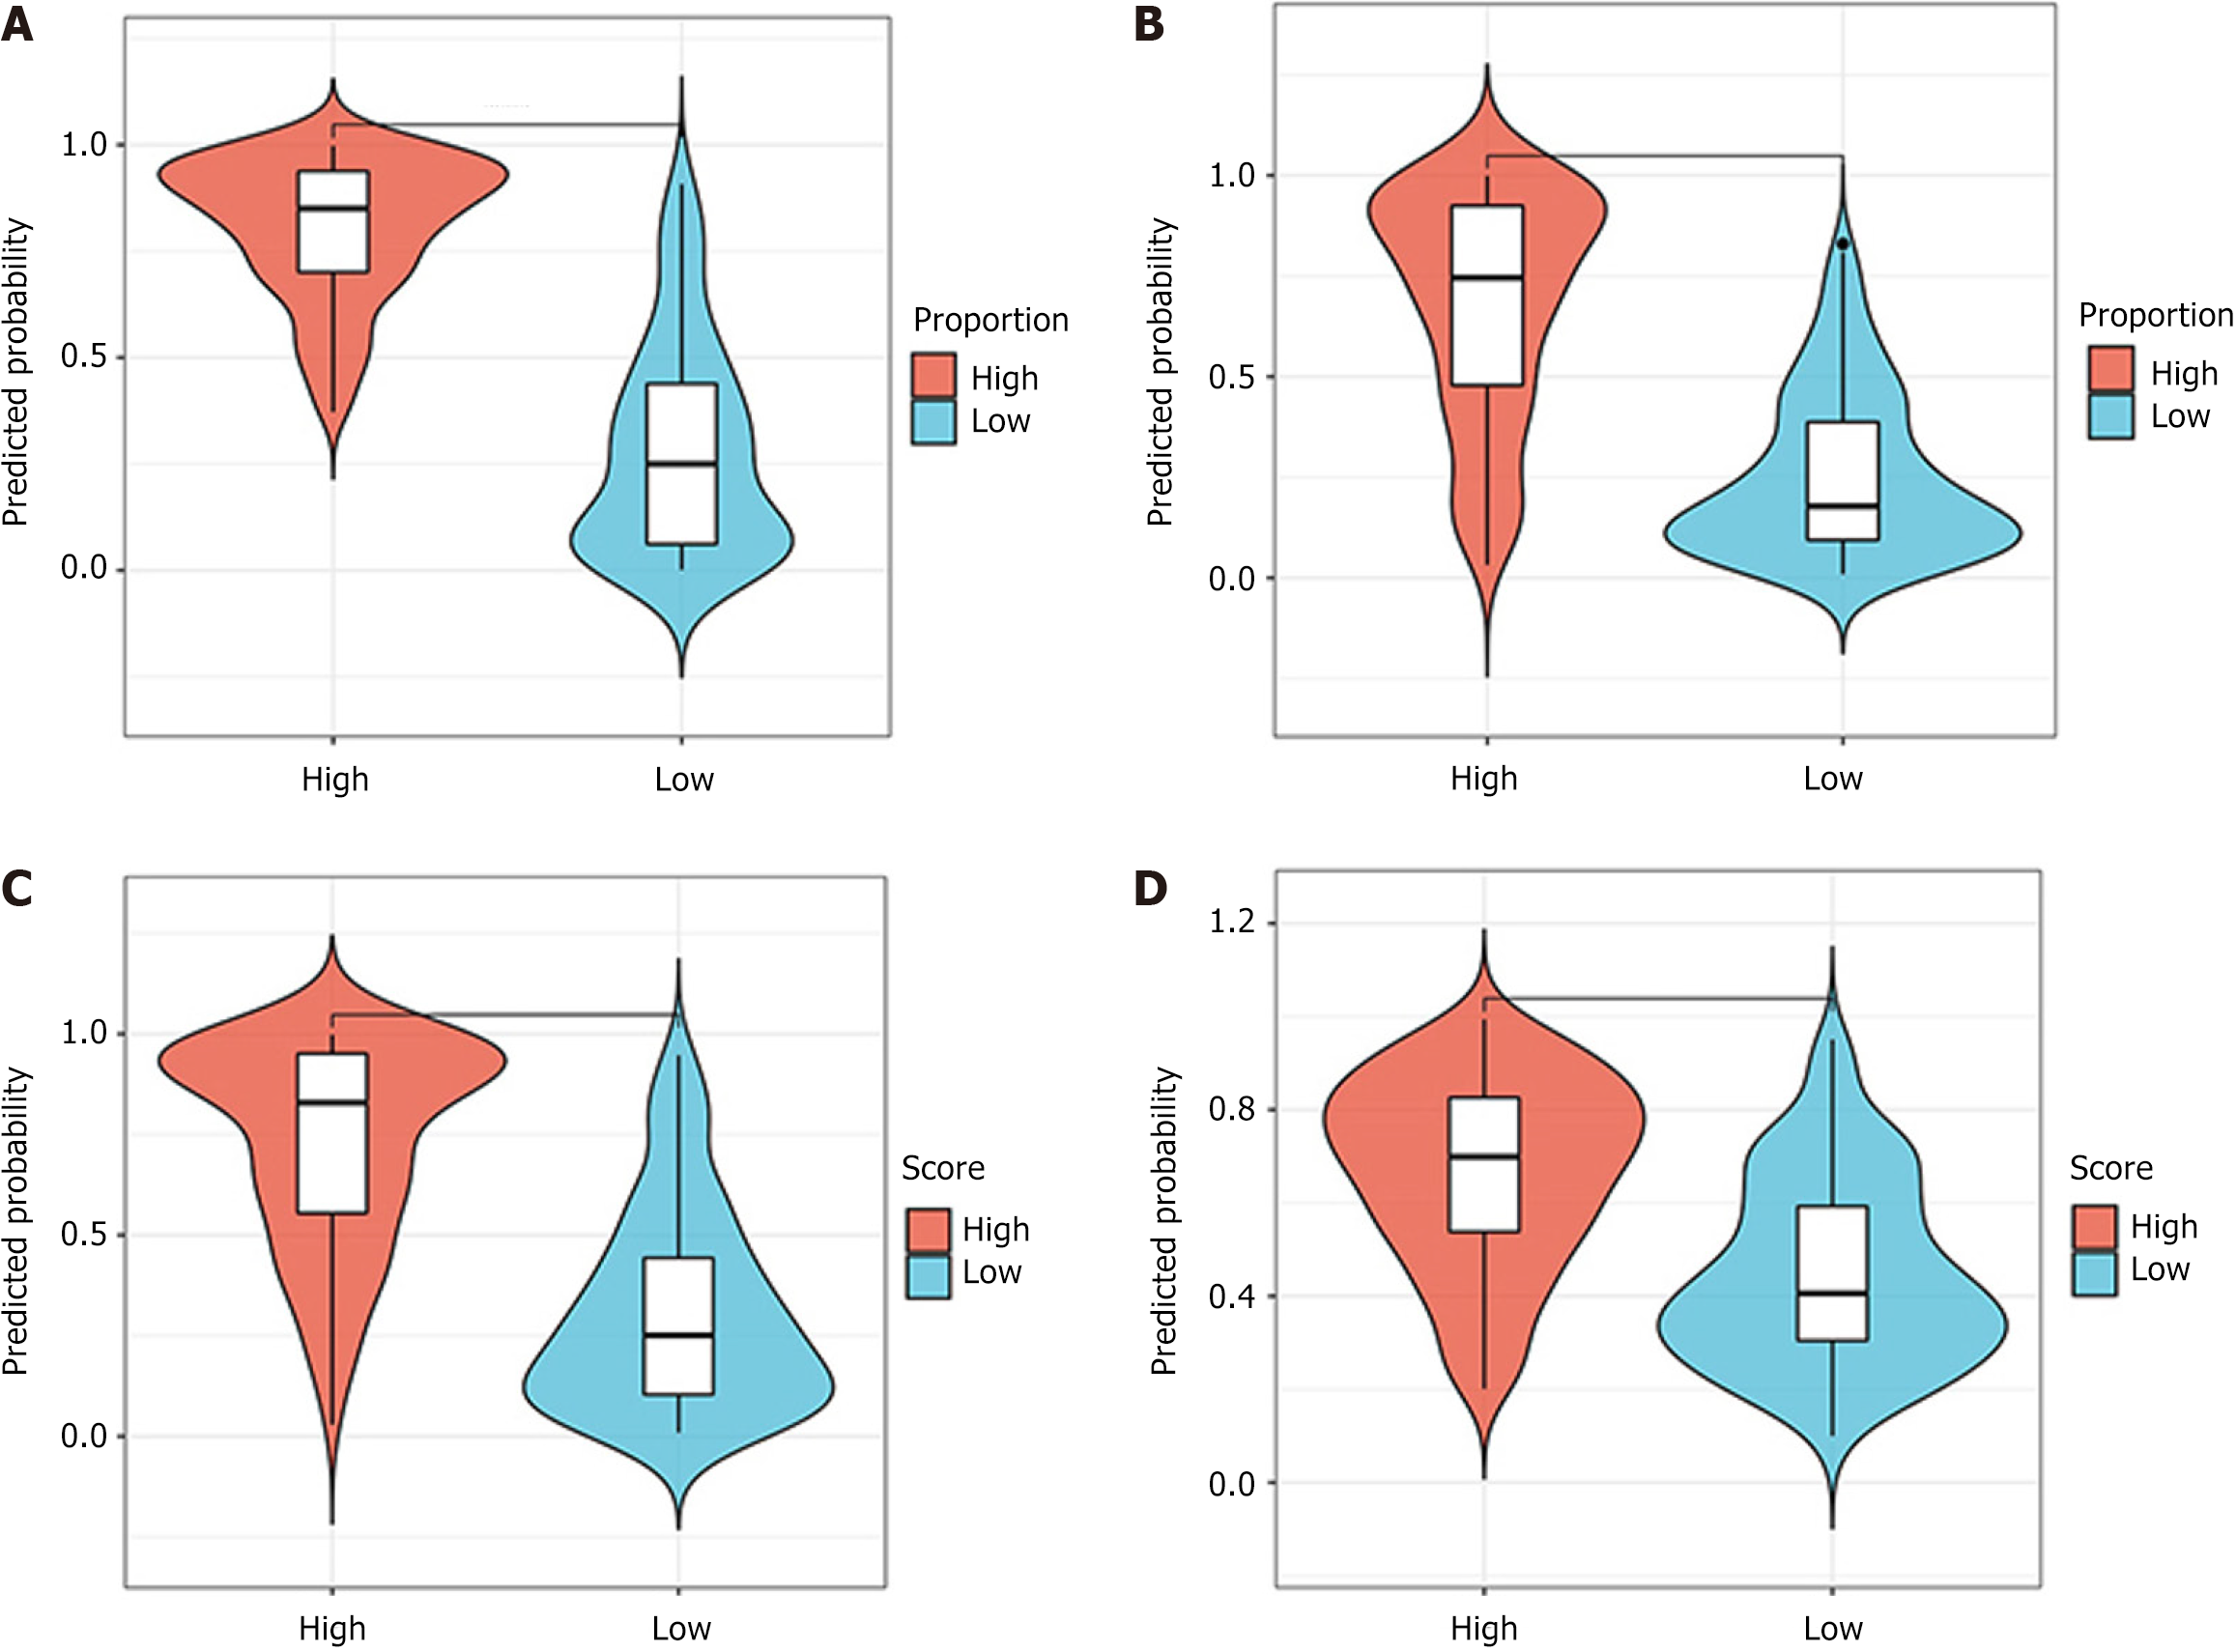
Figure 7 Probability distribution of different models.
A: Tumor-stroma ratio model; B: Tumor-infiltrating lymphocytes model; C: Immune score model; D: Tumor immune microenvironment model.
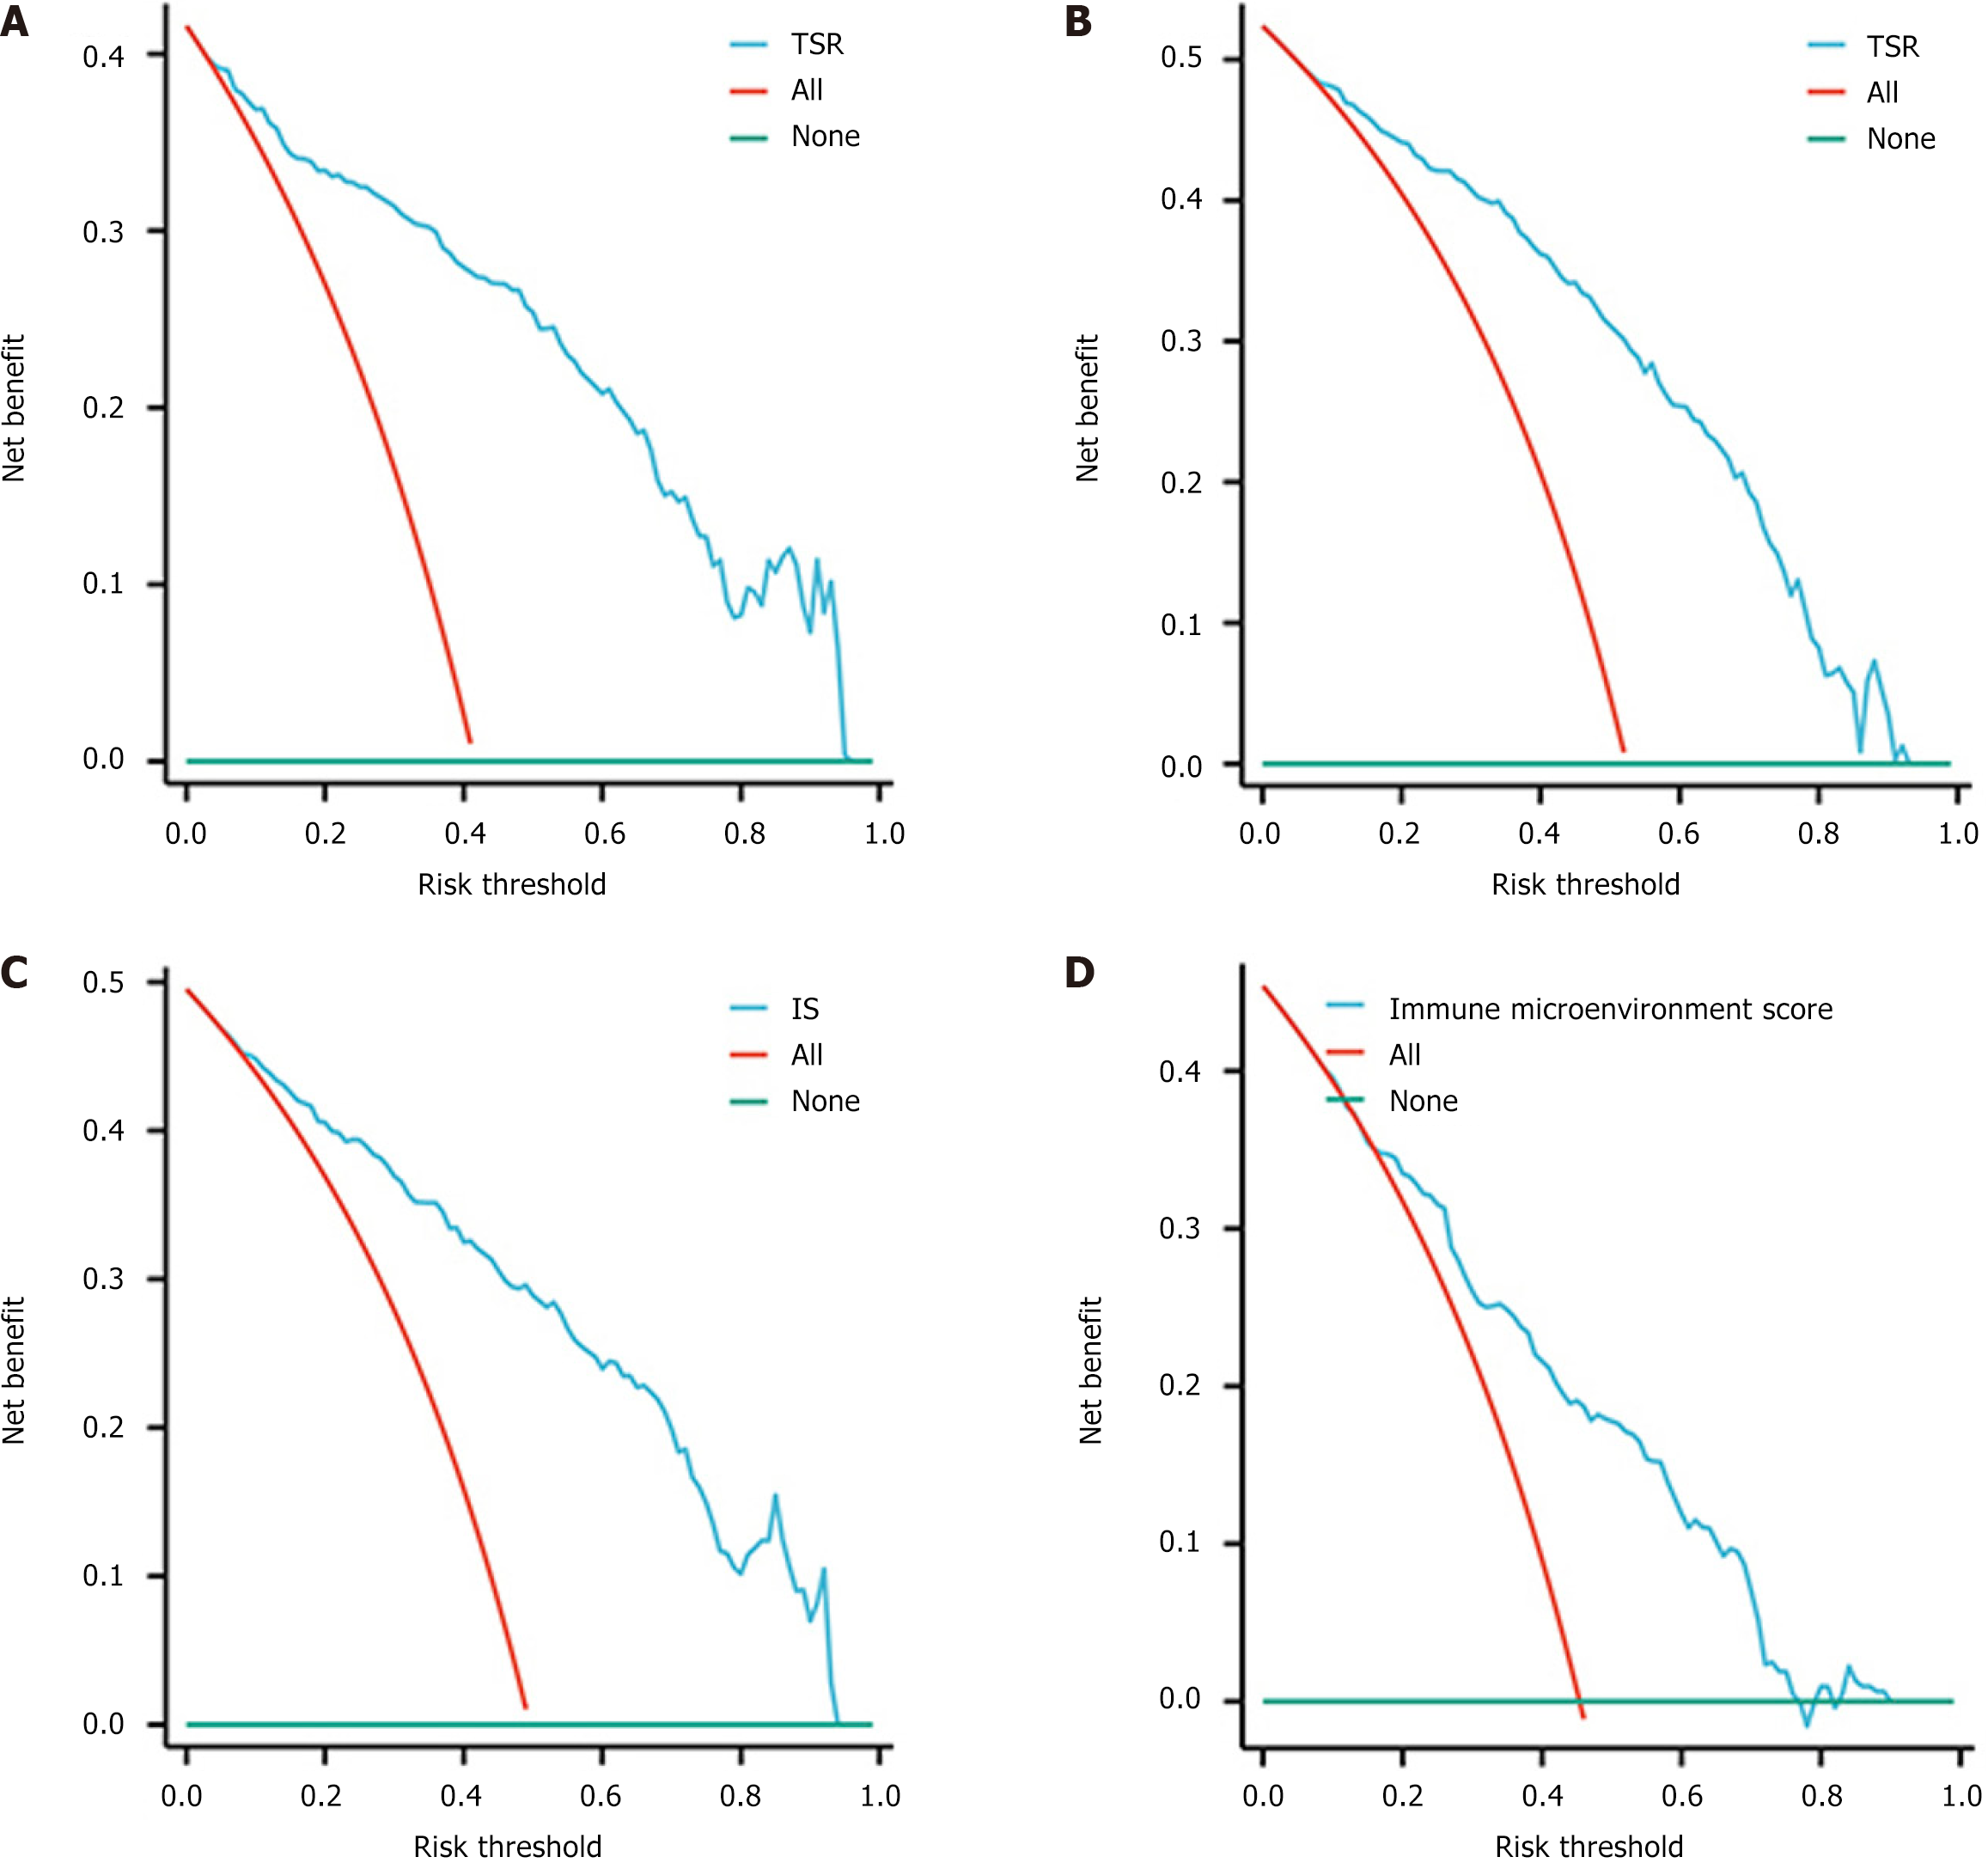
Figure 8 Decision curve analysis shows that the model has a significant clinical net benefit.
A: Tumor-stroma ratio model; B: Tumor-infiltrating lymphocytes model; C: Immune score model; D: Tumor immune microenvironment model. TSR: Tumor-stroma ratio; TIL: Tumor-infiltrating lymphocytes; IS: Immune score.
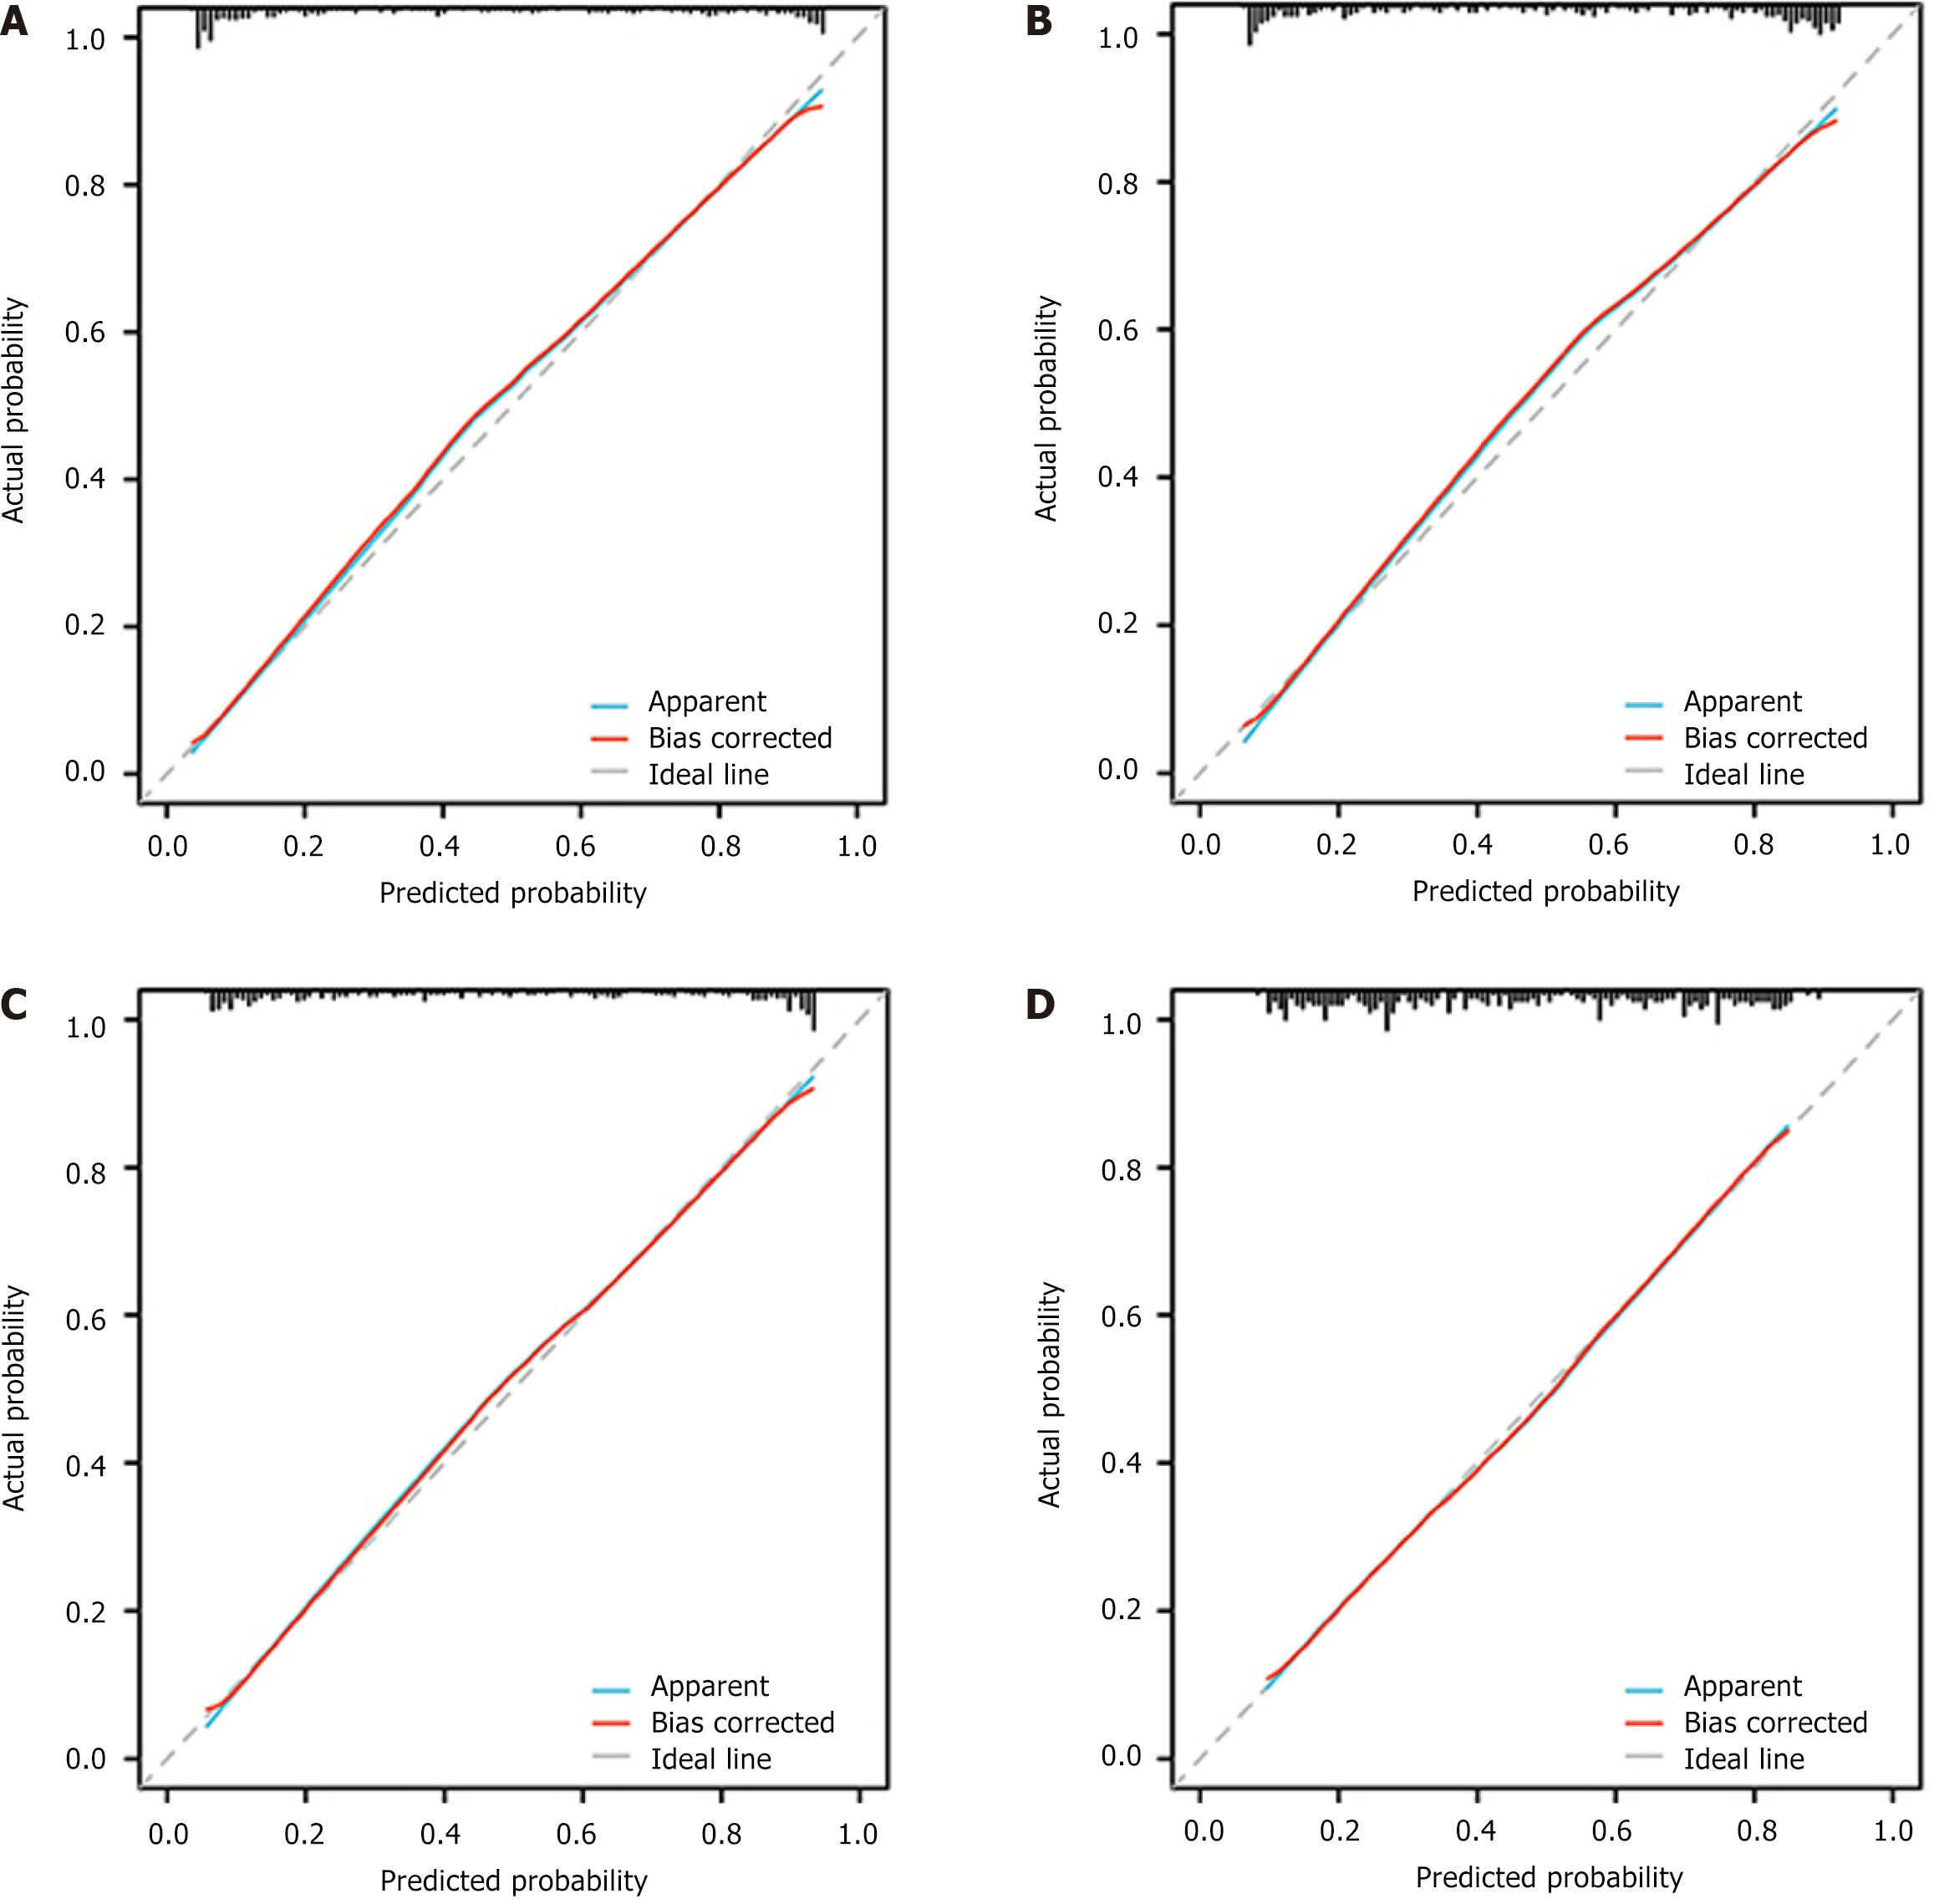
Figure 9 The calibration curve displays a good fit of the model.
A: Tumor-stroma ratio model; B: Tumor-infiltrating lymphocytes model; C: Immune score model; D: Tumor immune microenvironment model.
- Citation: Zhou C, Zhang YF, Yang ZJ, Huang YQ, Da MX. Computed tomography-based deep learning radiomics model for preoperative prediction of tumor immune microenvironment in colorectal cancer. World J Gastrointest Oncol 2025; 17(5): 106103
- URL: https://www.wjgnet.com/1948-5204/full/v17/i5/106103.htm
- DOI: https://dx.doi.org/10.4251/wjgo.v17.i5.106103


