Copyright
©The Author(s) 2025.
World J Gastrointest Oncol. May 15, 2025; 17(5): 104737
Published online May 15, 2025. doi: 10.4251/wjgo.v17.i5.104737
Published online May 15, 2025. doi: 10.4251/wjgo.v17.i5.104737
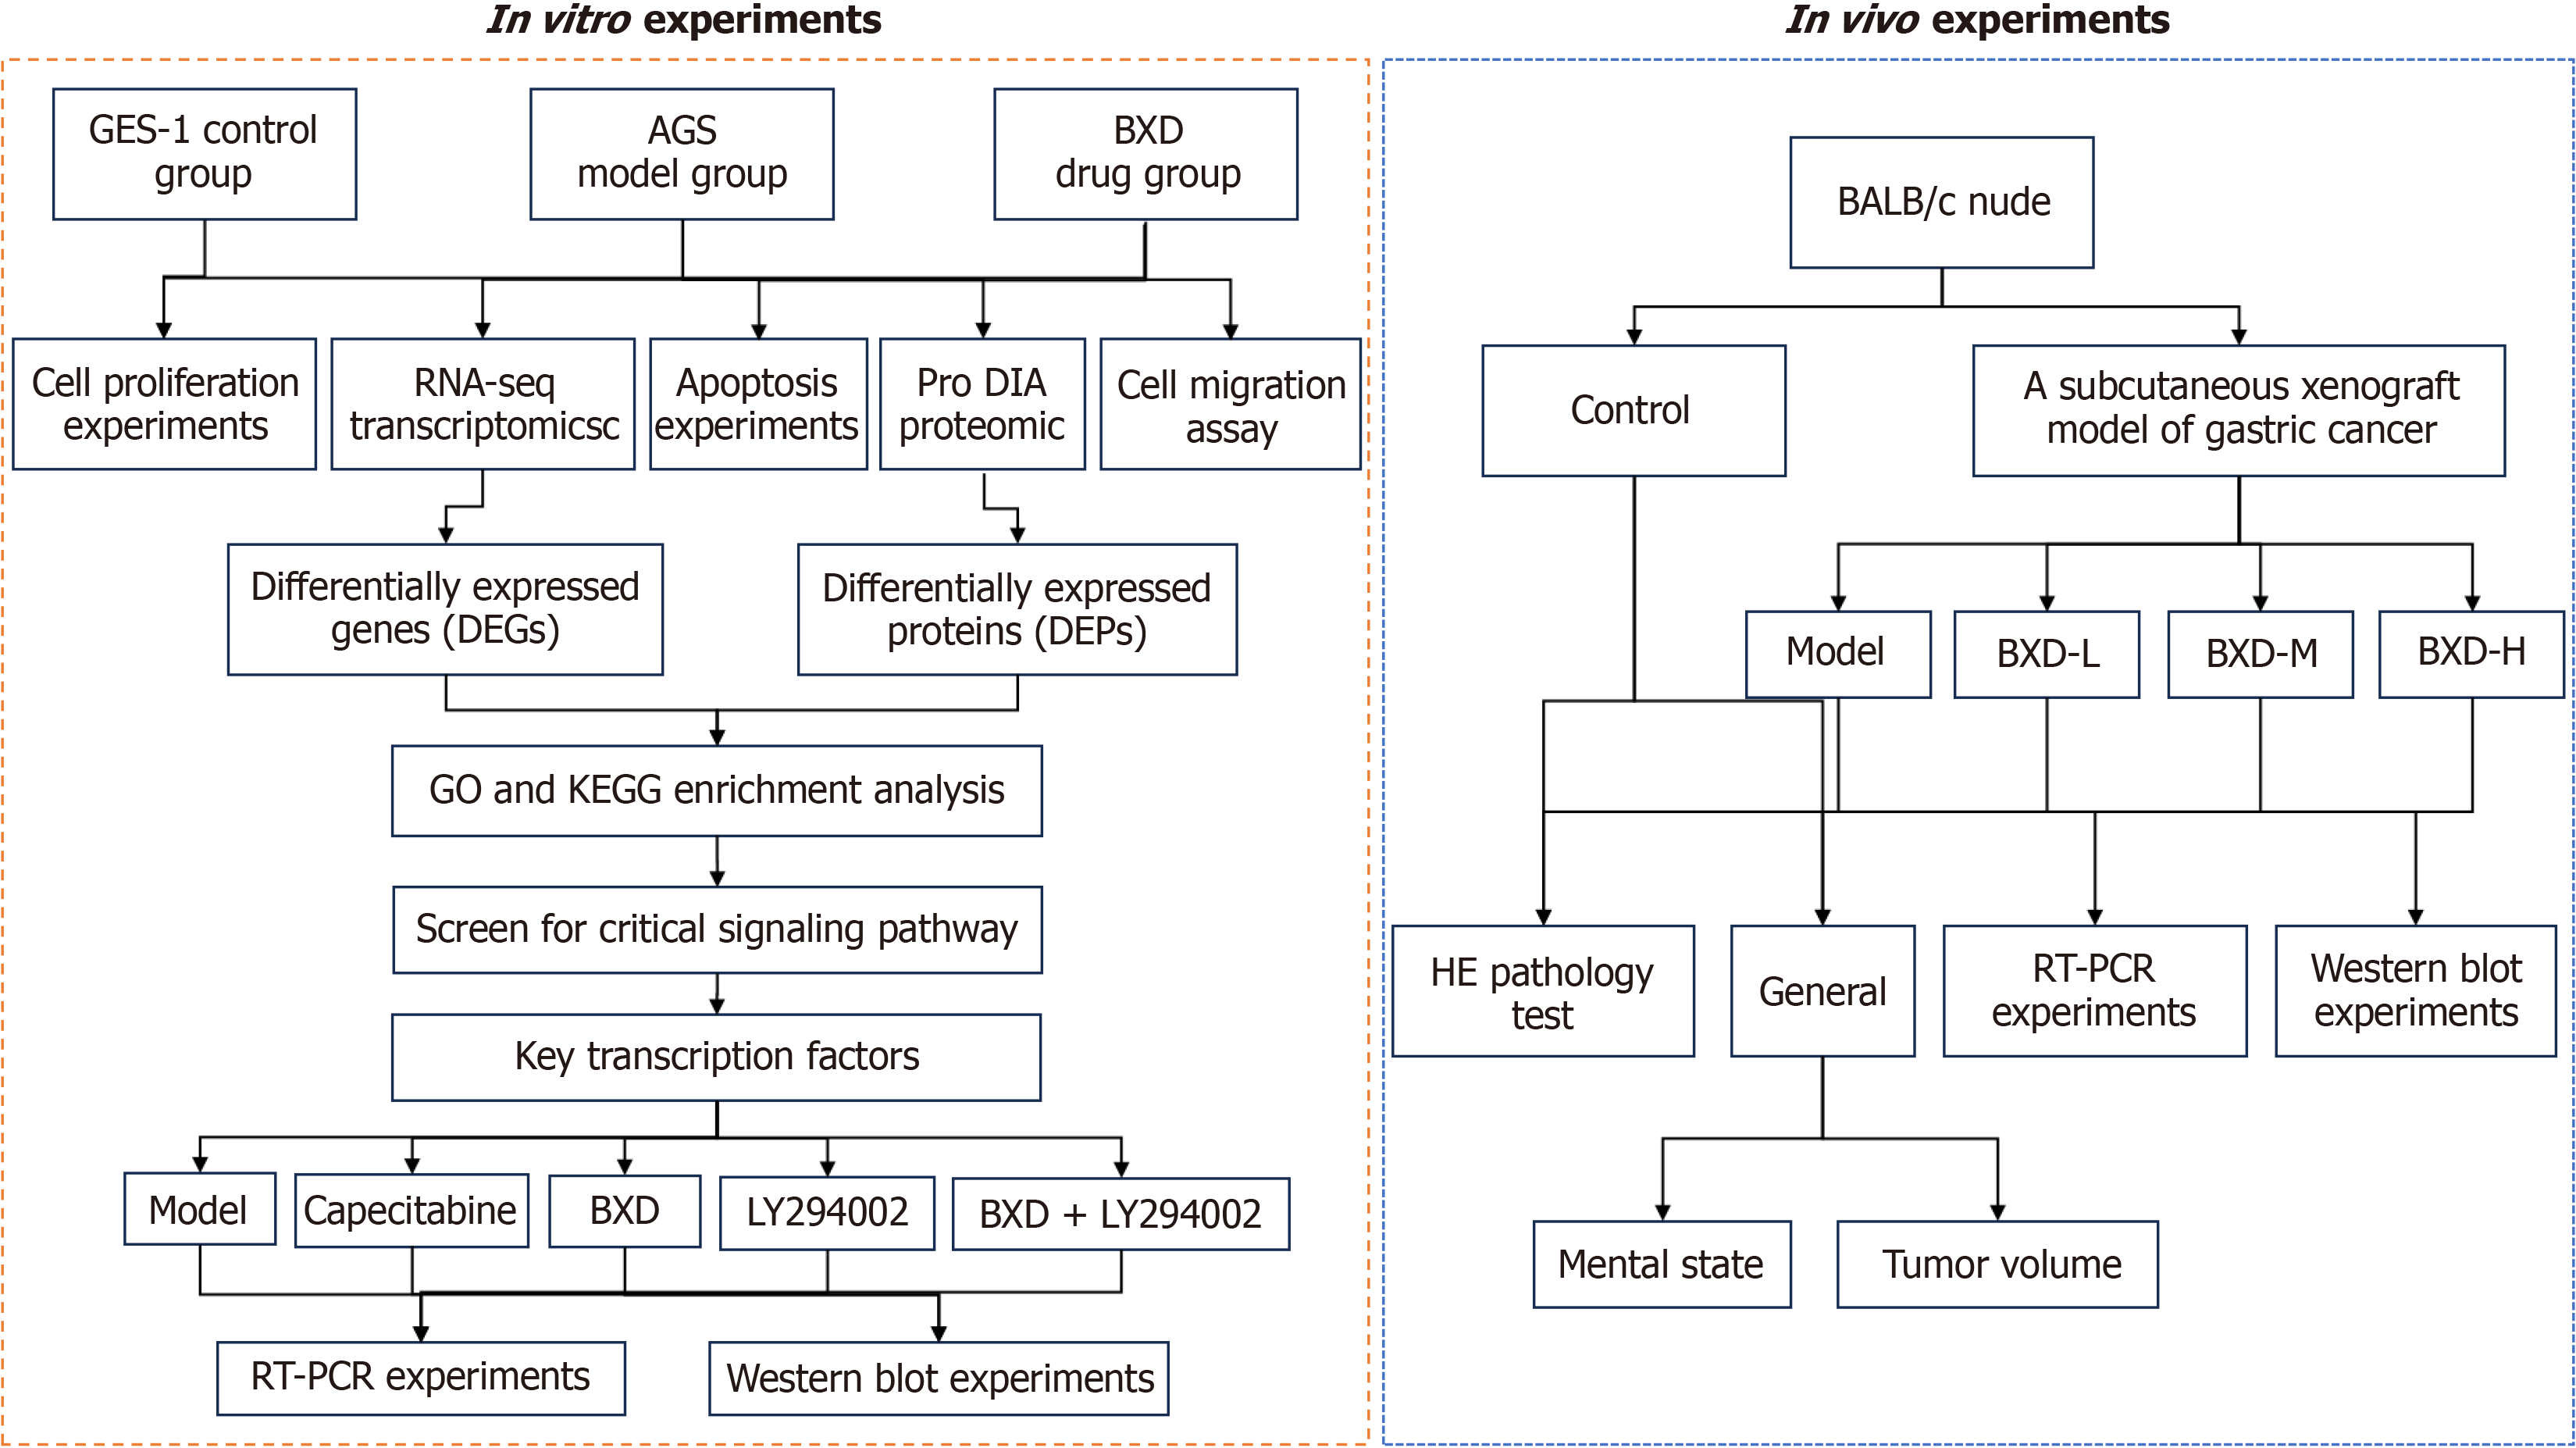
Figure 1 Experimental flow chart.
BXD: Banxia Xiexin decoction; DEGs: Differentially expressed genes; DEPs: Differentially expressed proteins; GO: Gene ontology; KEGG: Kyoto Encyclopedia of Genes and Genomes; HE: Hematoxylin-eosin; BXD-L: Banxia Xiexin decoction low dose; BXD-M: Banxia Xiexin decoction medium dose; BXD-H: Banxia Xiexin decoction high dose; RT-PCR: Reverse transcription PCR.
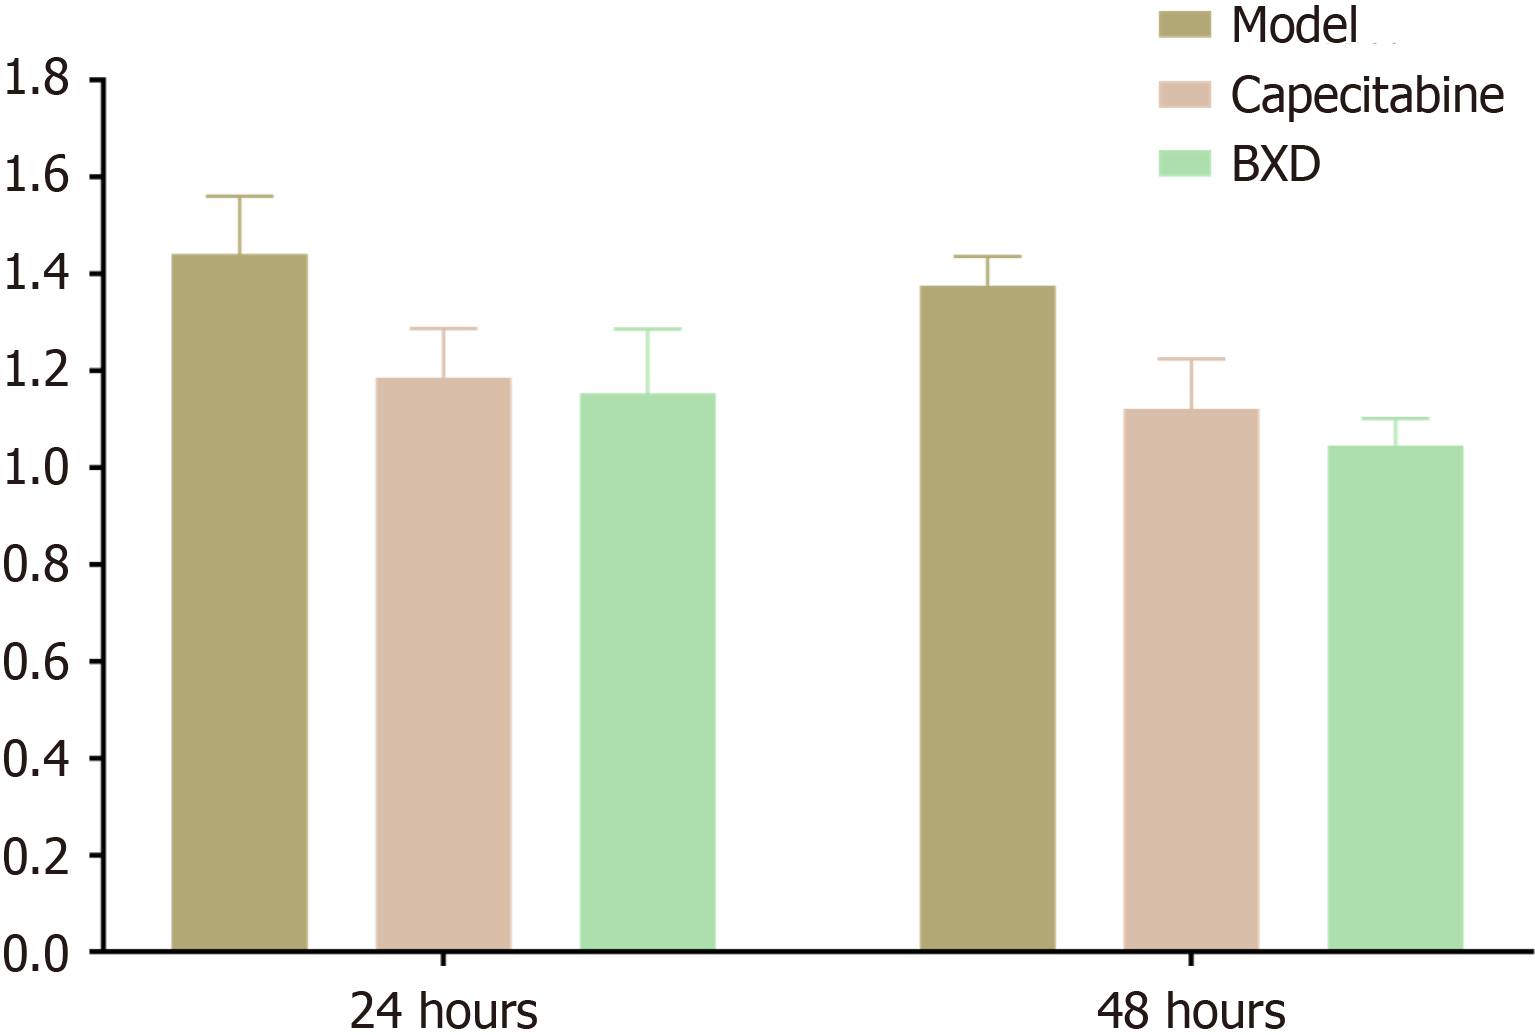
Figure 2 Cell proliferation assay.
Cell Counting Kit-8 results of three groups of cells. BXD: Banxia Xiexin decoction.
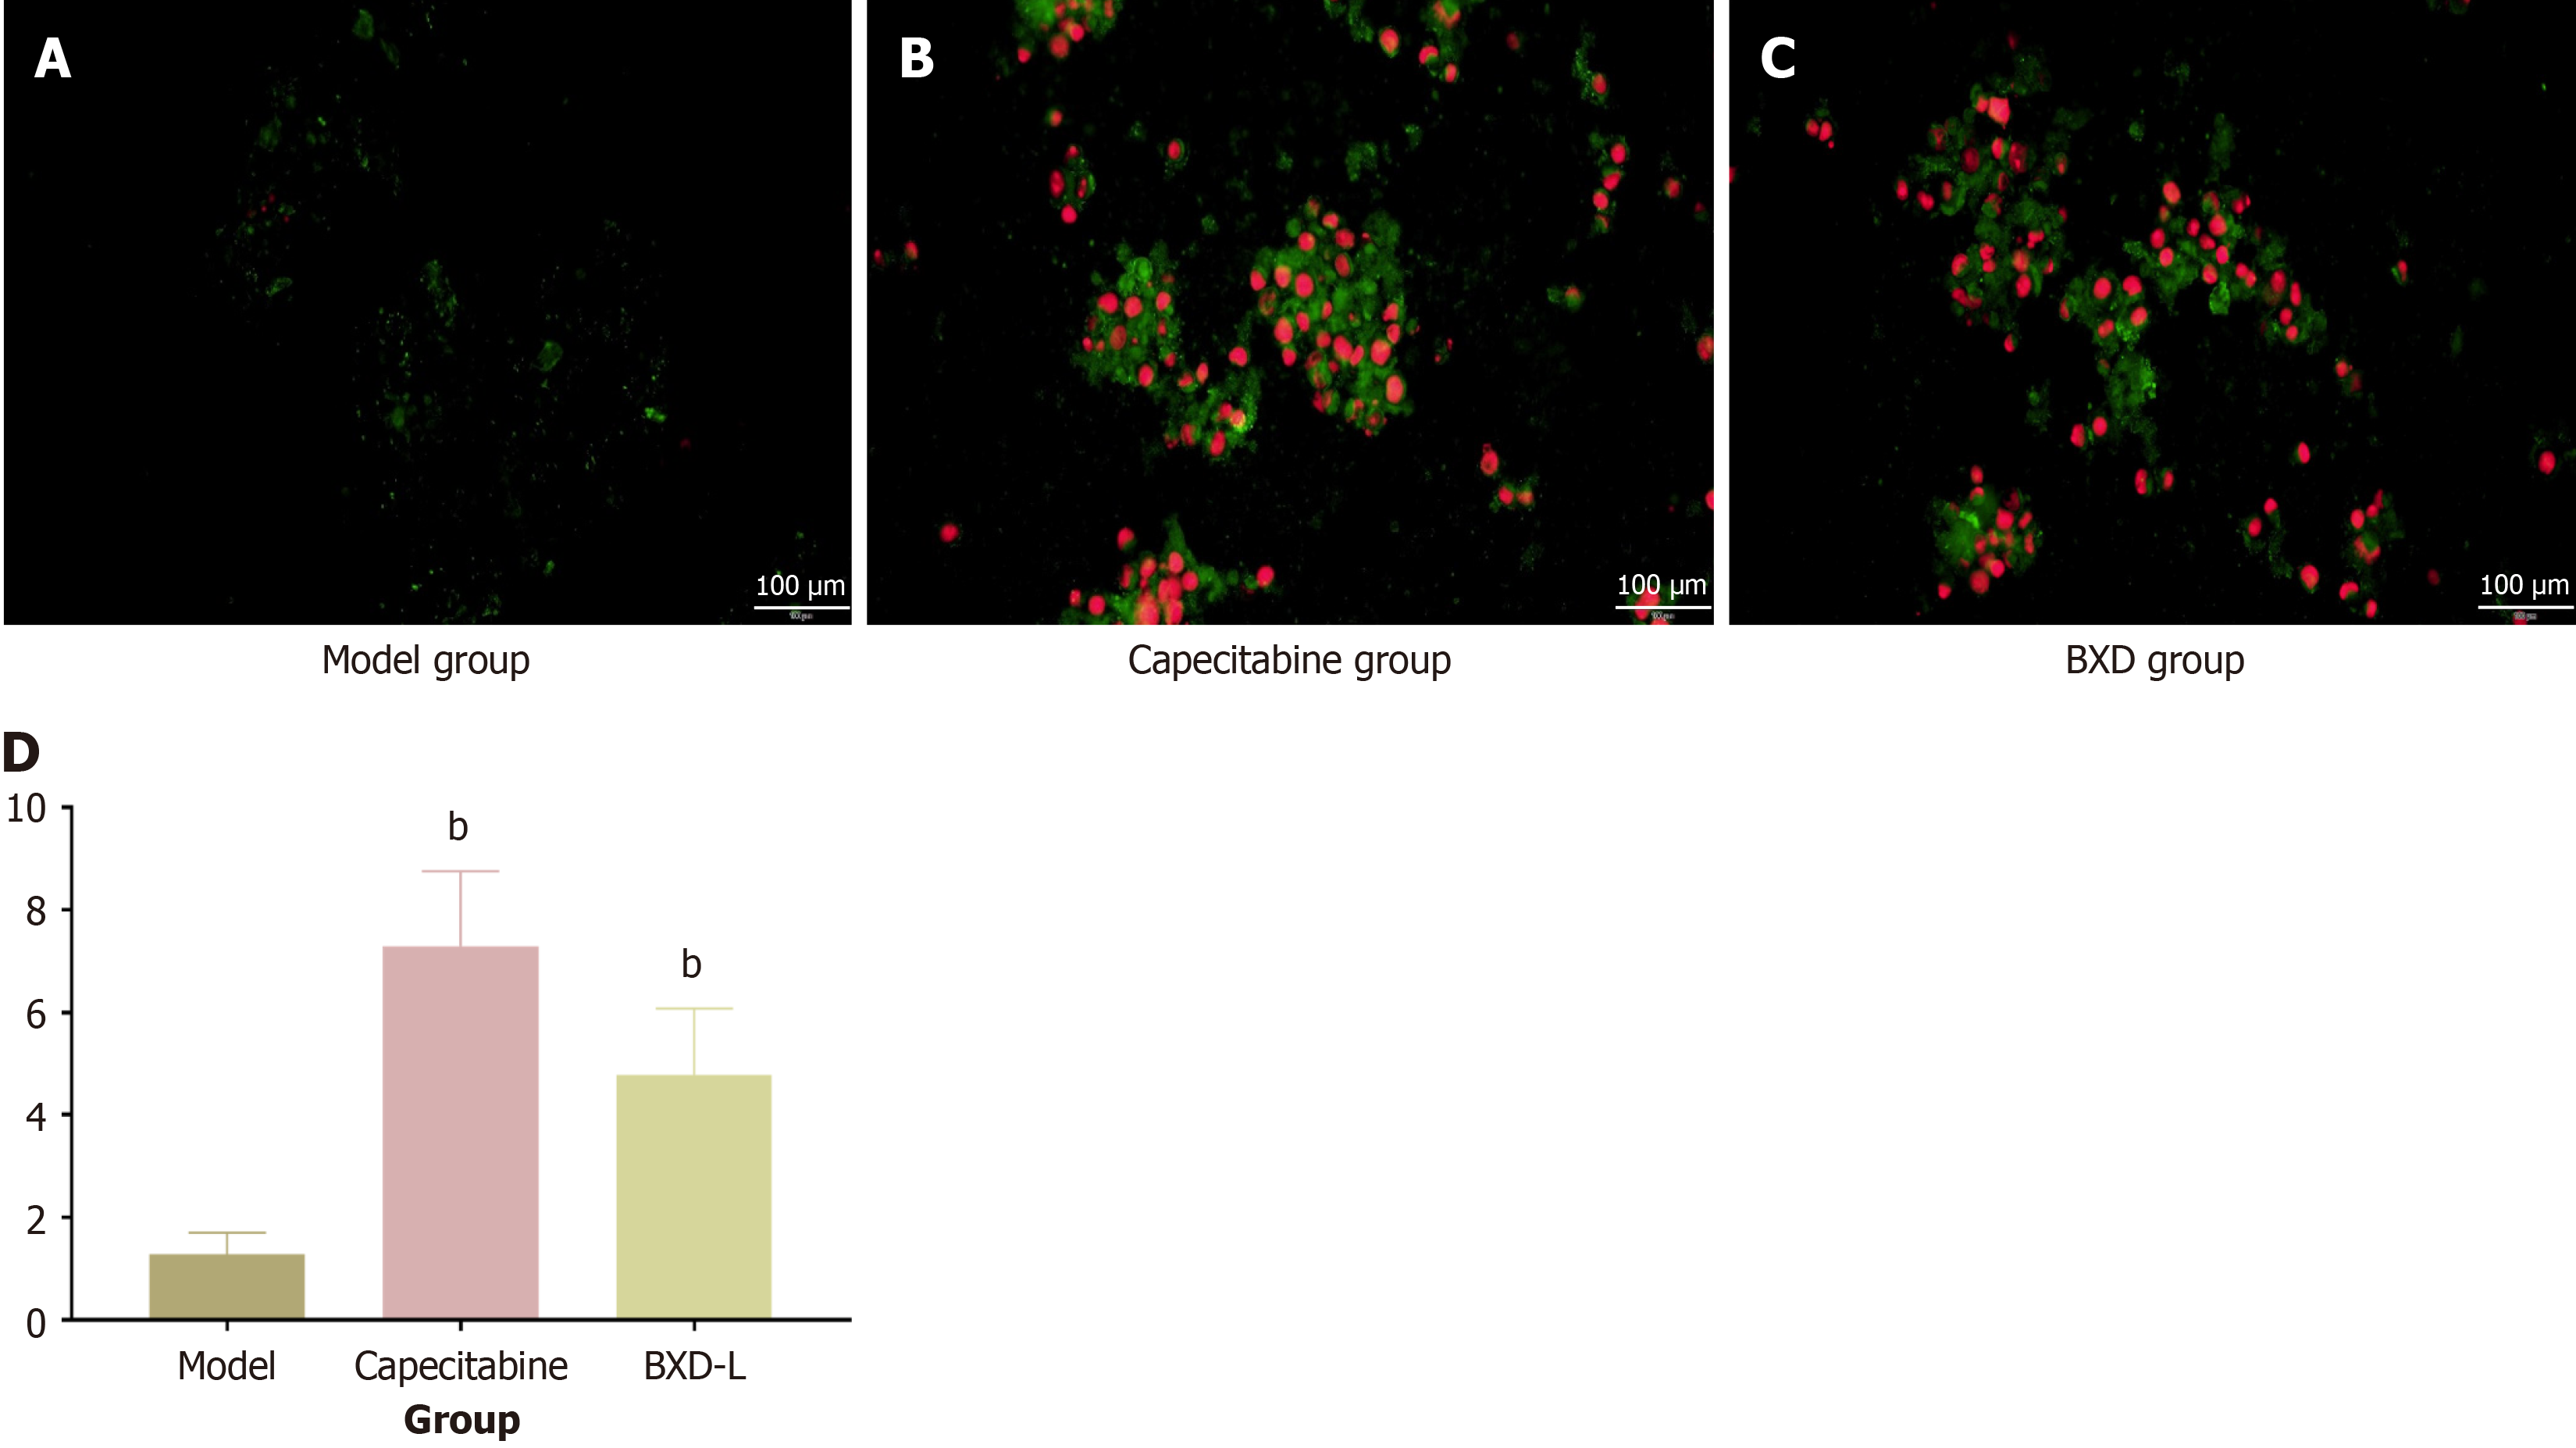
Figure 3 Apoptosis experiment.
A: AGS control group; B: Capecitabine group; C: Banxia Xiexin decoction group; D: Fluorescence intensity statistical chart. bP < 0.01, BXD: Banxia Xiexin decoction.
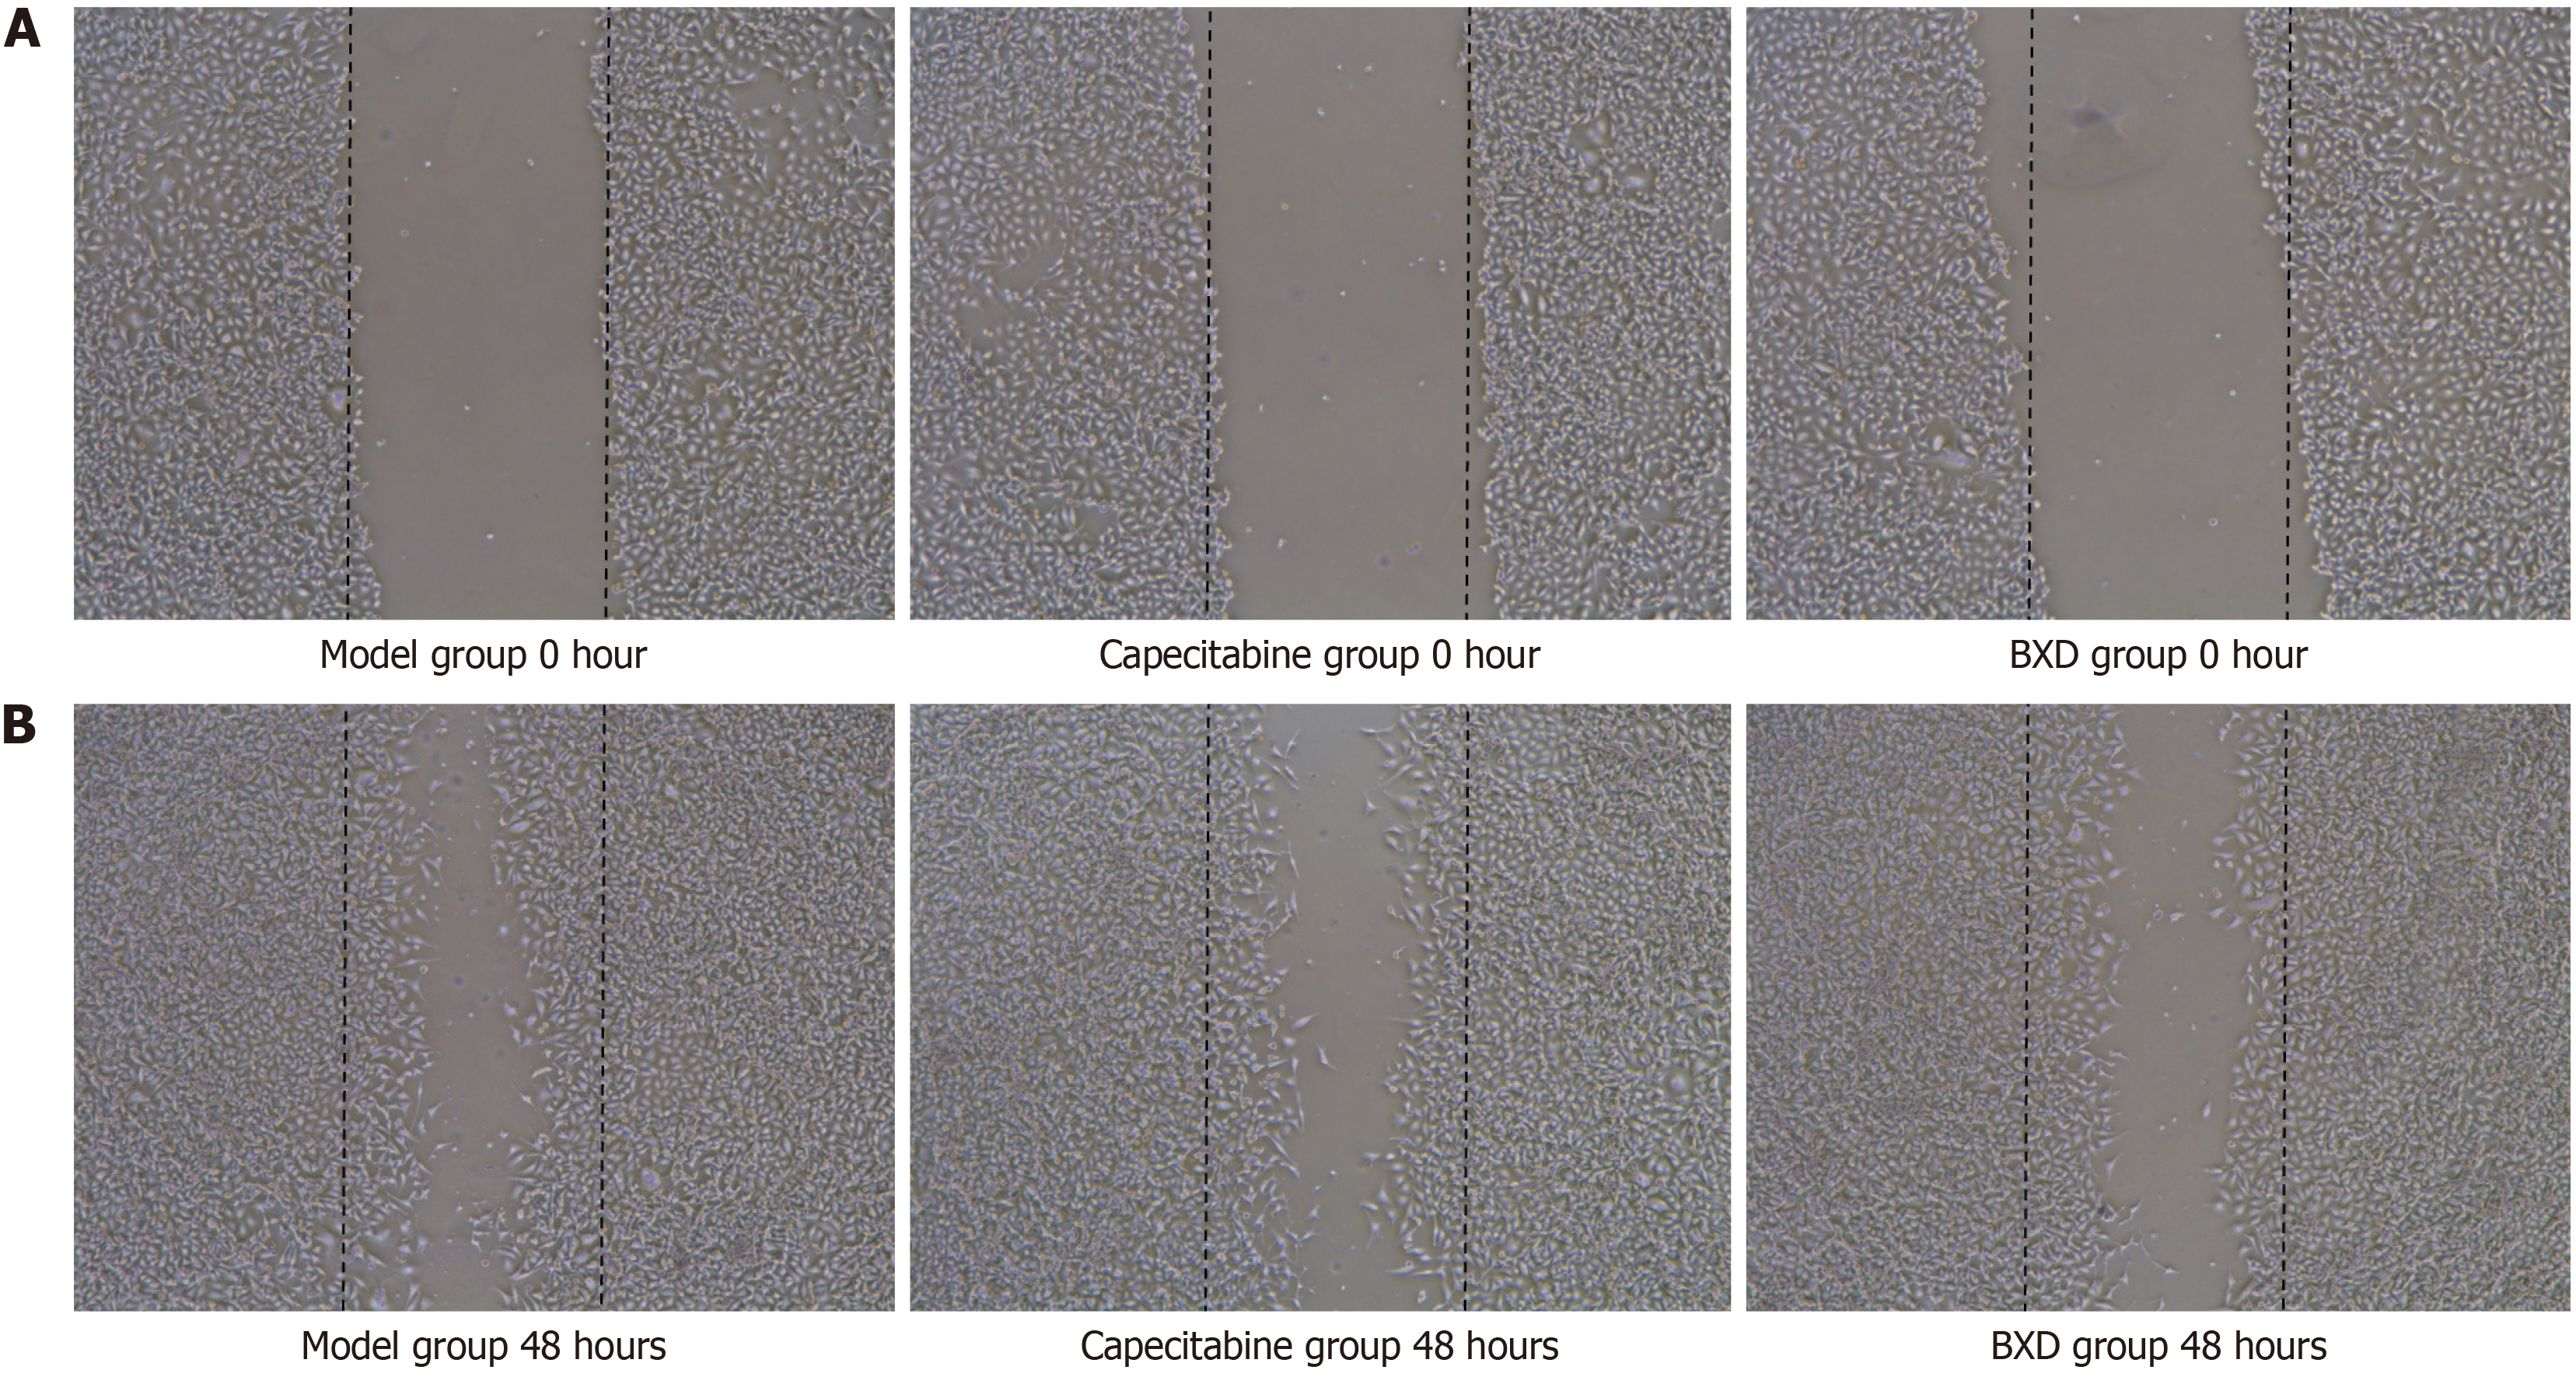
Figure 4 Cell migration experiment.
A: 0-h cell migration chart; B: 48-h cell migration chart. BXD: Banxia Xiexin decoction.
Figure 5 Gene Ontology enrichment and Kyoto Encyclopedia of Genes and Genomes.
A: Gene Ontology enrichment result of transcriptomics enrichment analysis; B: Kyoto Encyclopedia of Genes and Genomes enrichment analysis result of transcriptomics enrichment analysis; C: Gene Ontology enrichment result of proteomics enrichment analysis; D: Kyoto Encyclopedia of Genes and Genomes enrichment analysis result of proteomics enrichment analysis. PI3K: Phosphatidylinositol 3-kinase; KEGG: Kyoto Encyclopedia of Genes and Genomes.
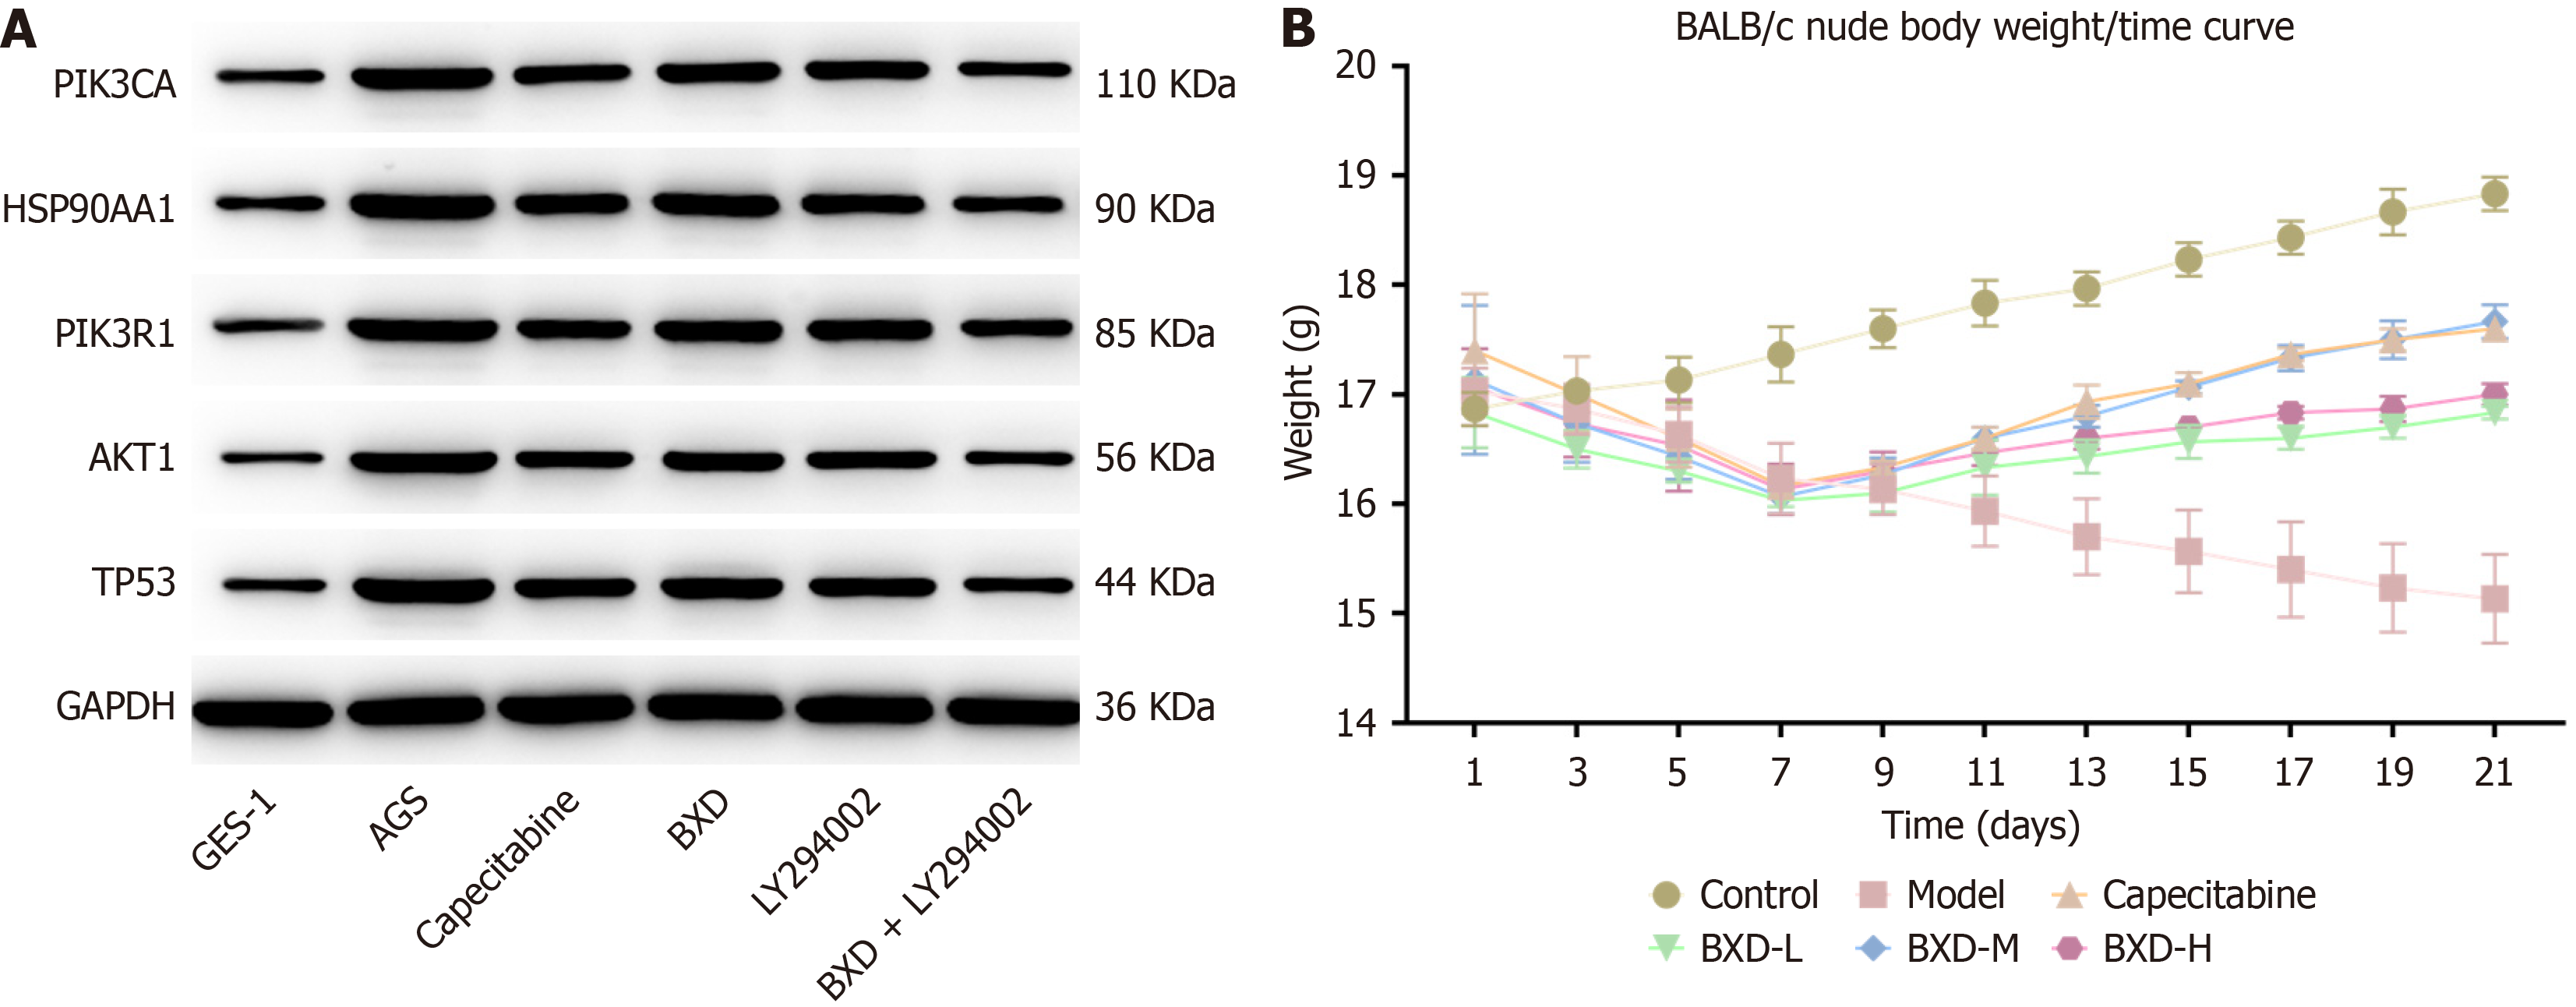
Figure 6 Effect of Banxia Xiexin decoction.
A: Western blot grayscale value plot; B: Mouse body weight change. BXD: Banxia Xiexin decoction.
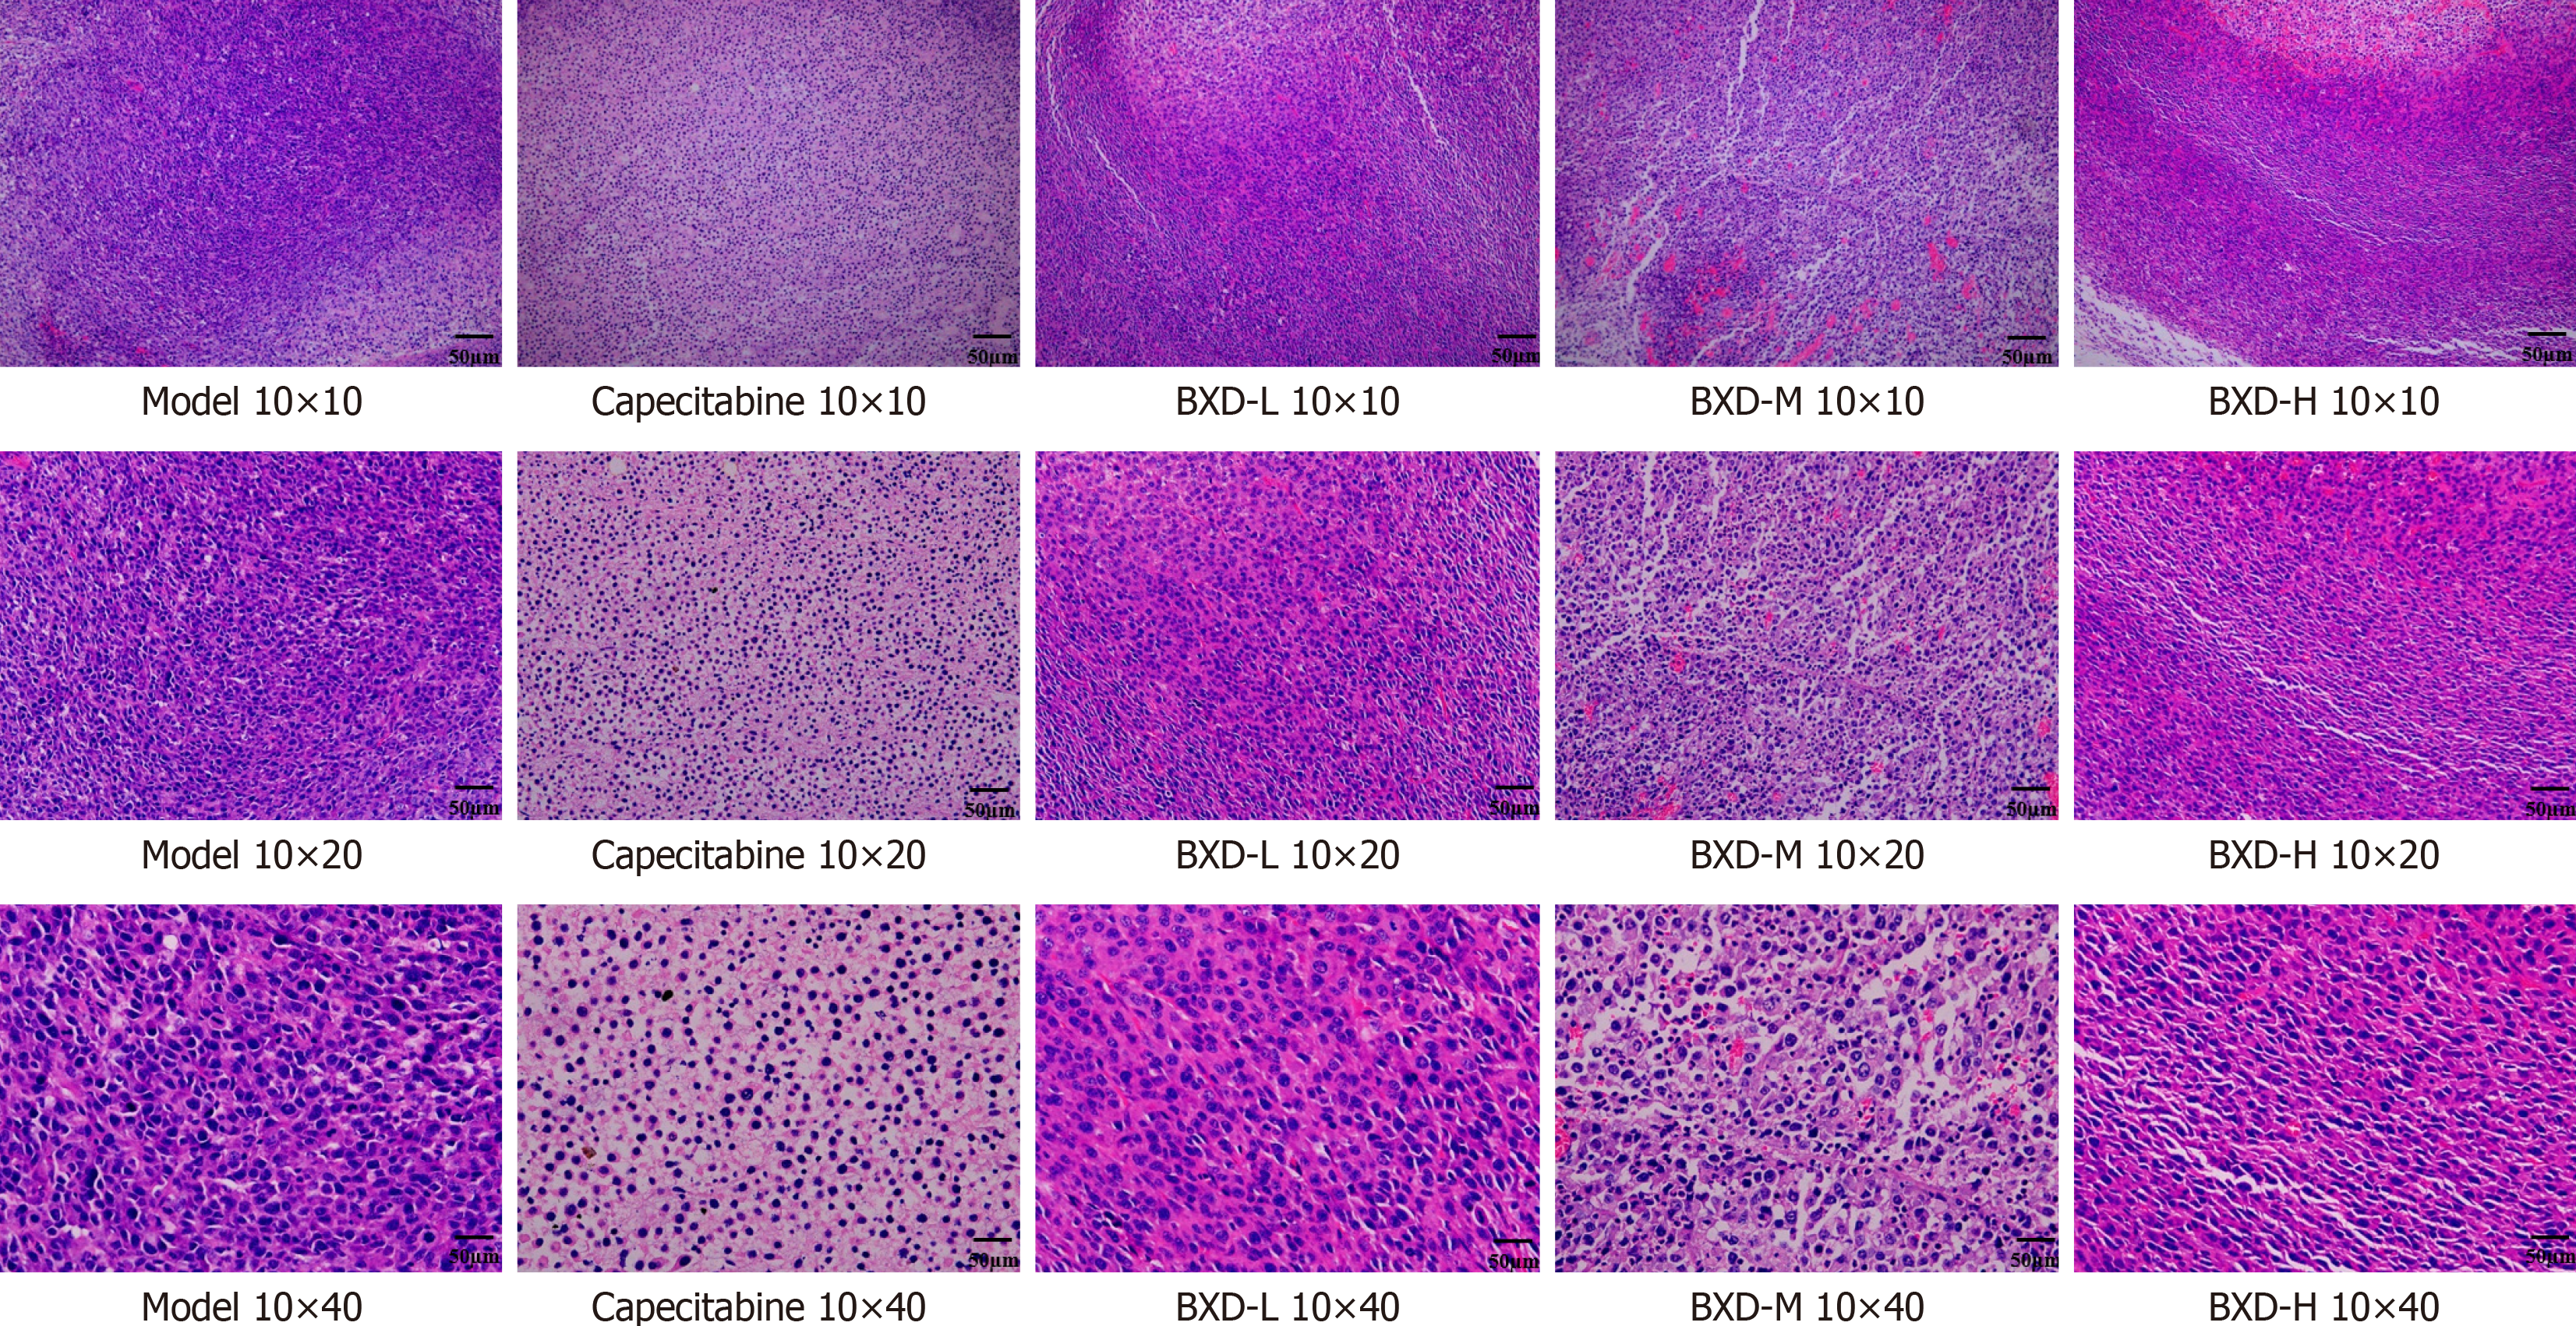
Figure 7 Hematoxylin and eosin staining diagram.
BXD-L: Banxia Xiexin decoction low dose; BXD-M: Banxia Xiexin decoction medium dose; BXD-H: Banxia Xiexin decoction high dose.
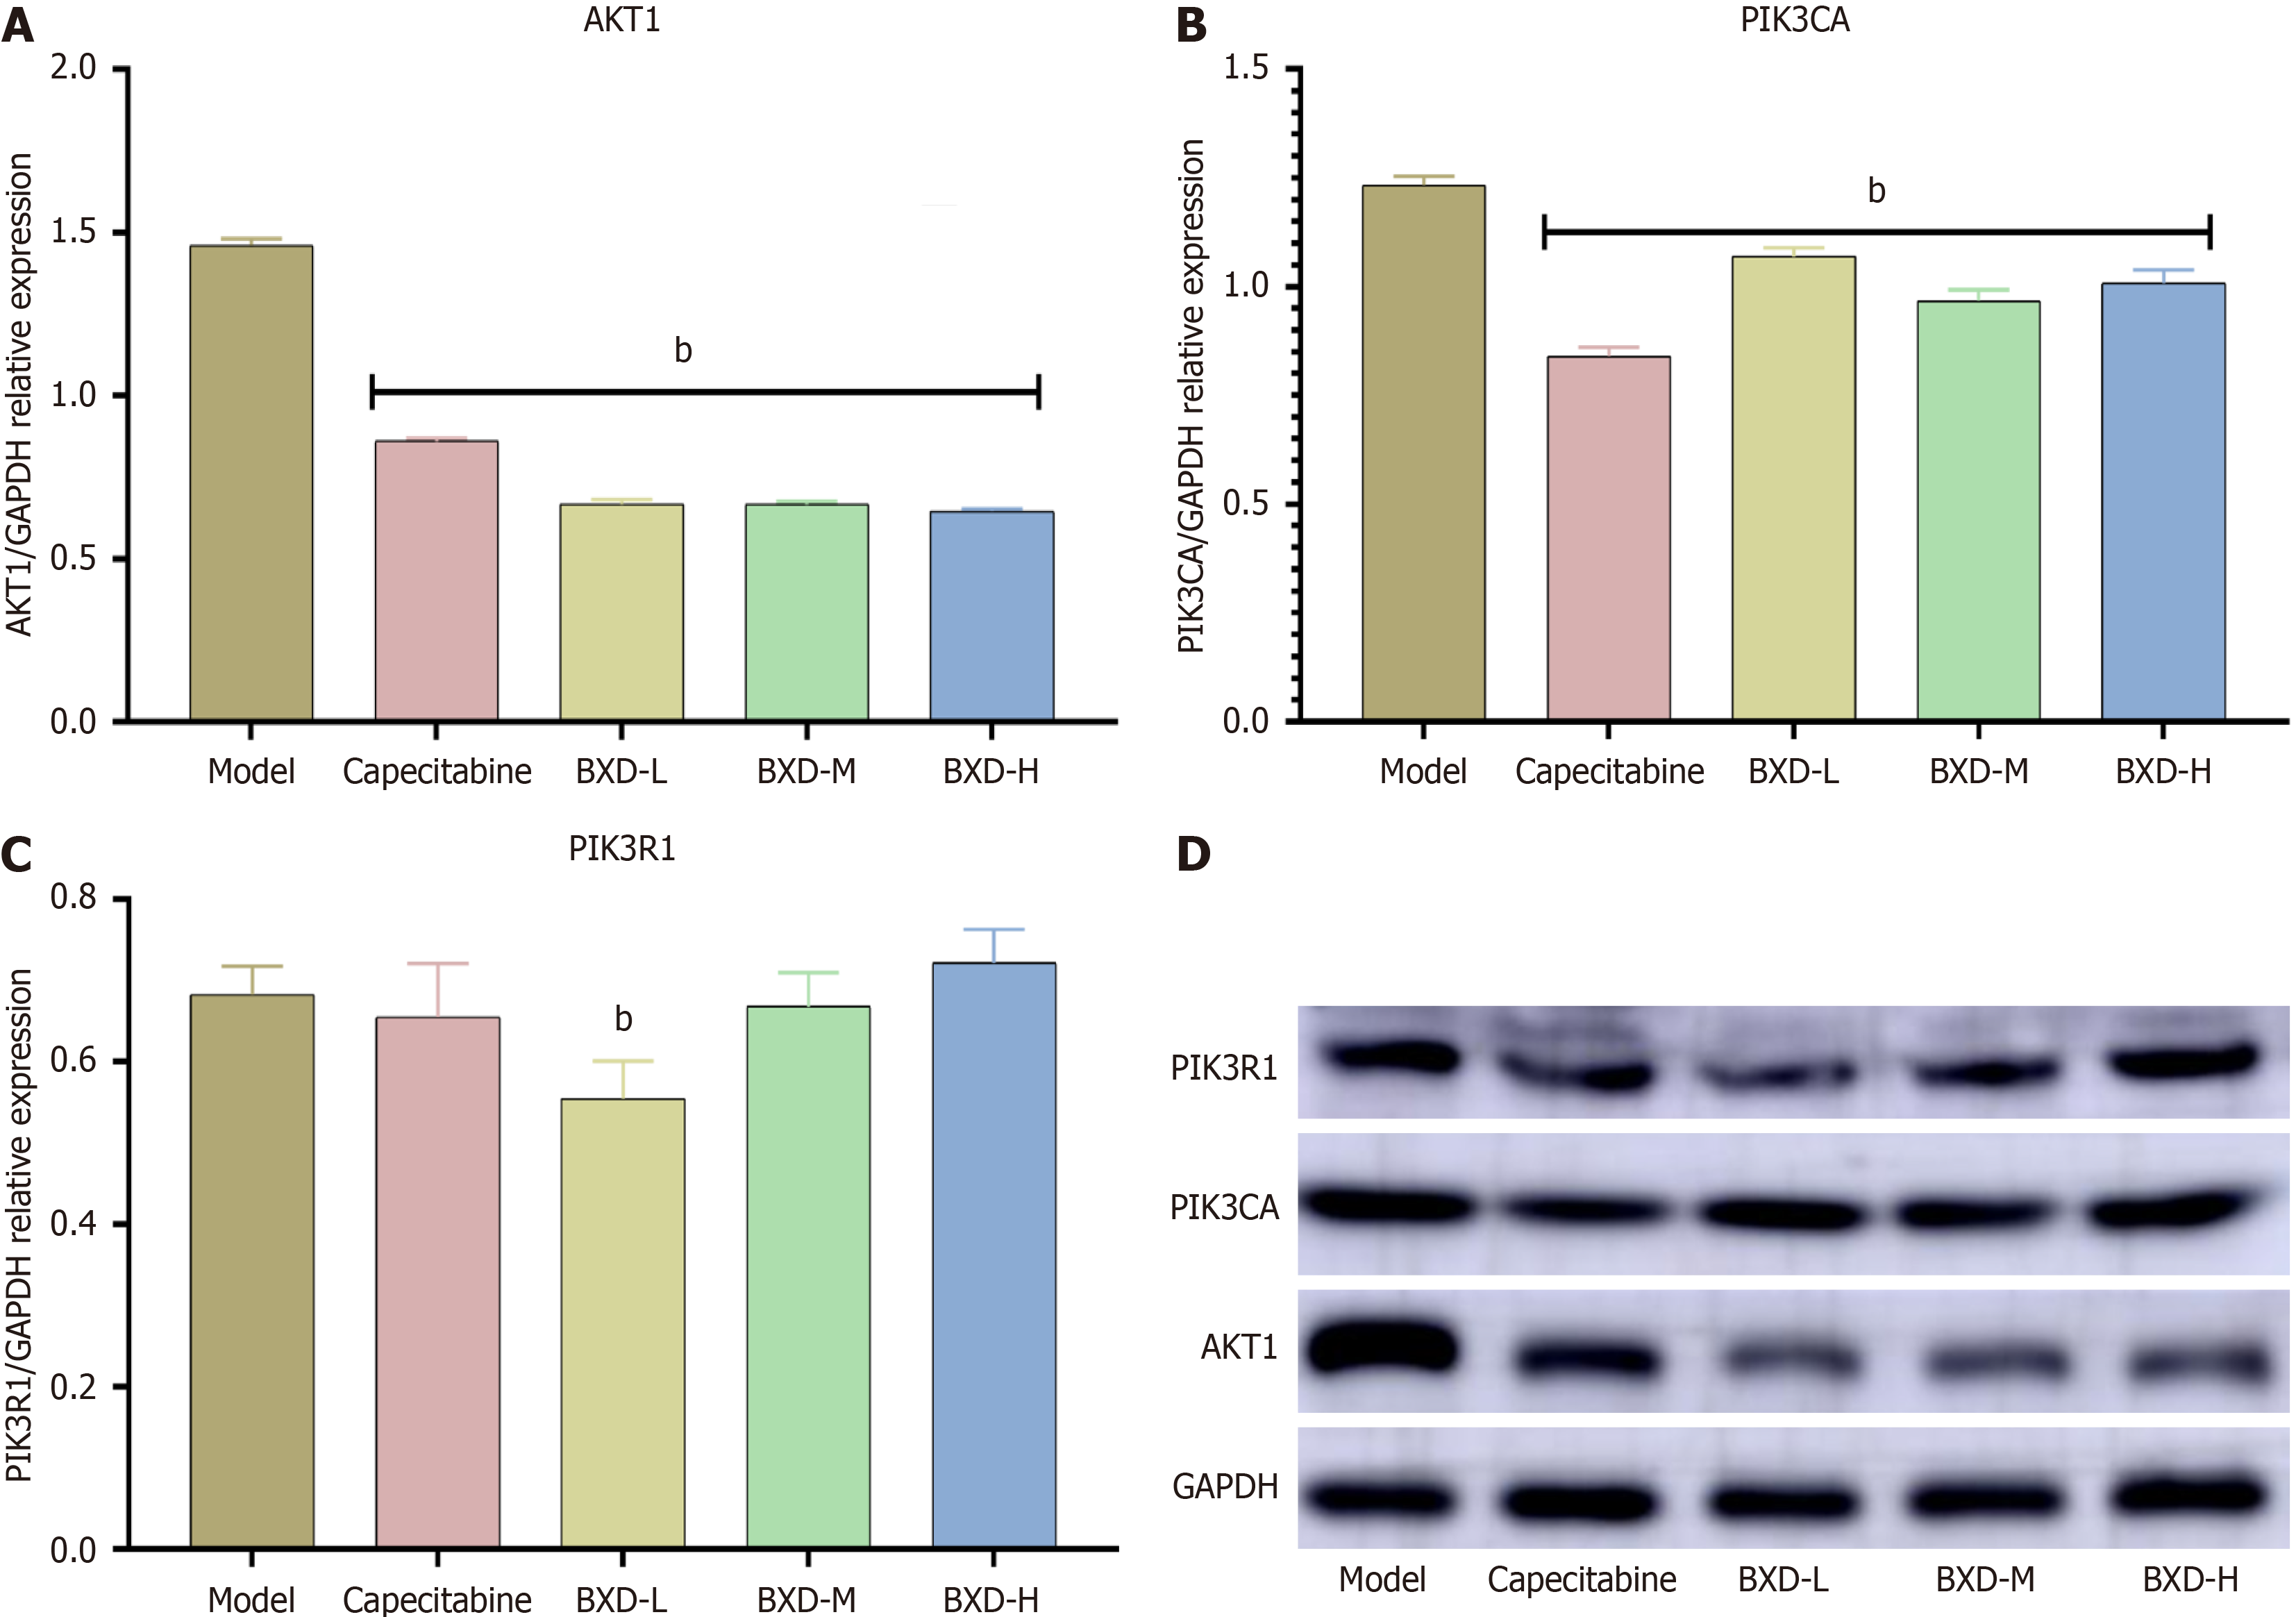
Figure 8 Protein expression of phosphatidylinositol 3-kinase-AKT signaling pathway in tumor tissues of animals in each group A: Relative expression of AKT serine/threonine kinase 1 protein in tumor tissues of animals in each group; B: Relative expression of phosphatidylinositol-4,5-bisphosphate 3-kinase catalytic subunit alpha protein in tumor tissues of animals in each group; C: Relative expression of phosphoinositide-3-kinase regulatory subunit 1 protein in tumor tissues of animals in each group; D: AKT serine/threonine kinase 1, phosphatidylinositol-4,5-bisphosphate 3-kinase catalytic subunit alpha, and phosphoinositide-3-kinase regulatory subunit 1 protein bands.
Compared with the model group, bP < 0.01. BXD-L: Banxia Xiexin decoction low dose; BXD-M: Banxia Xiexin decoction medium dose; BXD-H: Banxia Xiexin decoction high dose; PIK3R1: Phosphoinositide-3-kinase regulatory subunit 1; PIK3CA: Phosphatidylinositol-4,5-bisphosphate 3-kinase catalytic subunit alpha; AKT1: AKT serine/threonine kinase 1; GAPDH: Glyceraldehyde-3-phosphate dehydrogenase.
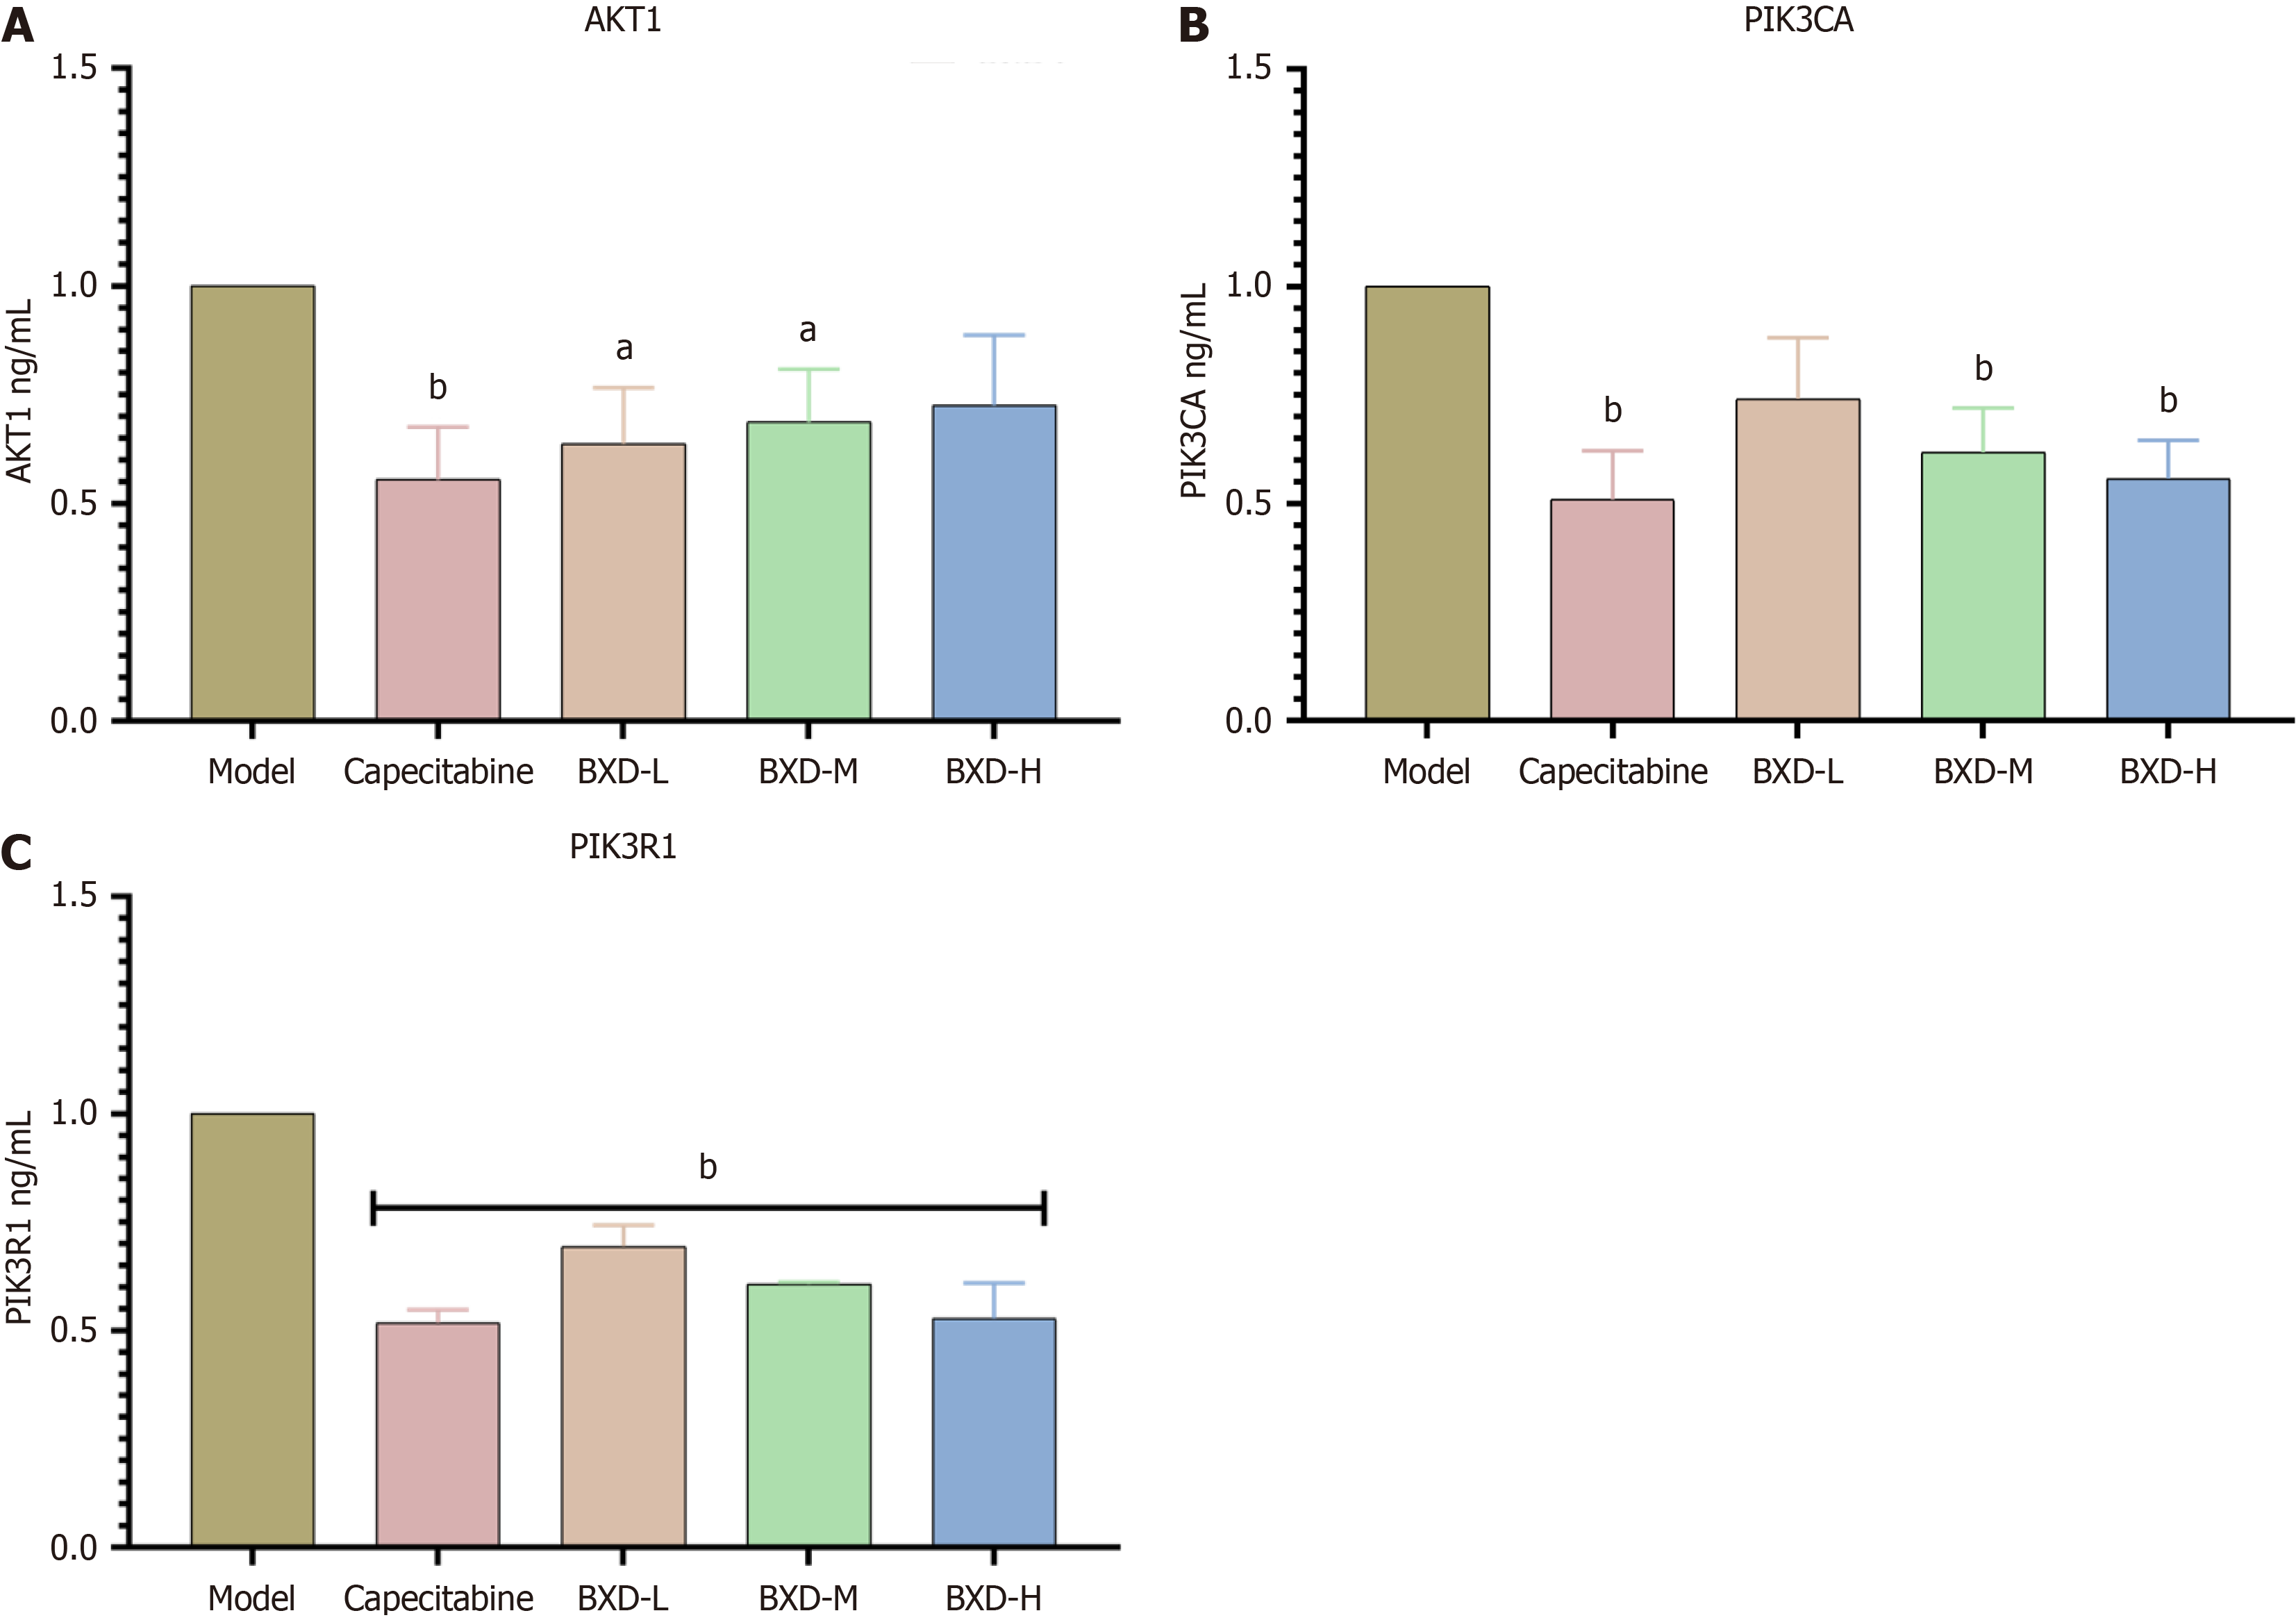
Figure 9 Gene expression of PI3K-AKT signaling pathway in tumor tissues of animals in each group.
A: AKT serine/threonine kinase 1 mRNA expression in the tumor tissues of animals in each group; B: Phosphatidylinositol-4,5-bisphosphate 3-kinase catalytic subunit alpha mRNA expression in the tumor tissues of animals in each group; C: Relative expression of phosphoinositide-3-kinase regulatory subunit 1 mRNA in the tumor tissues of animals in each group. Compared with the model group, aP < 0.05, bP < 0.01. BXD-L: Banxia Xiexin decoction low dose; BXD-M: Banxia Xiexin decoction medium dose; BXD-H: Banxia Xiexin decoction high dose; PIK3R1: Phosphoinositide-3-kinase regulatory subunit 1; PIK3CA: Phosphatidylinositol-4,5-bisphosphate 3-kinase catalytic subunit alpha; AKT1: AKT serine/threonine kinase 1.
- Citation: Zu GX, Tang JQ, Huang HL, Han T. Validation and analysis of key factors of Banxia Xiexin decoction against gastric cancer. World J Gastrointest Oncol 2025; 17(5): 104737
- URL: https://www.wjgnet.com/1948-5204/full/v17/i5/104737.htm
- DOI: https://dx.doi.org/10.4251/wjgo.v17.i5.104737


