Copyright
©The Author(s) 2025.
World J Gastrointest Oncol. May 15, 2025; 17(5): 104229
Published online May 15, 2025. doi: 10.4251/wjgo.v17.i5.104229
Published online May 15, 2025. doi: 10.4251/wjgo.v17.i5.104229
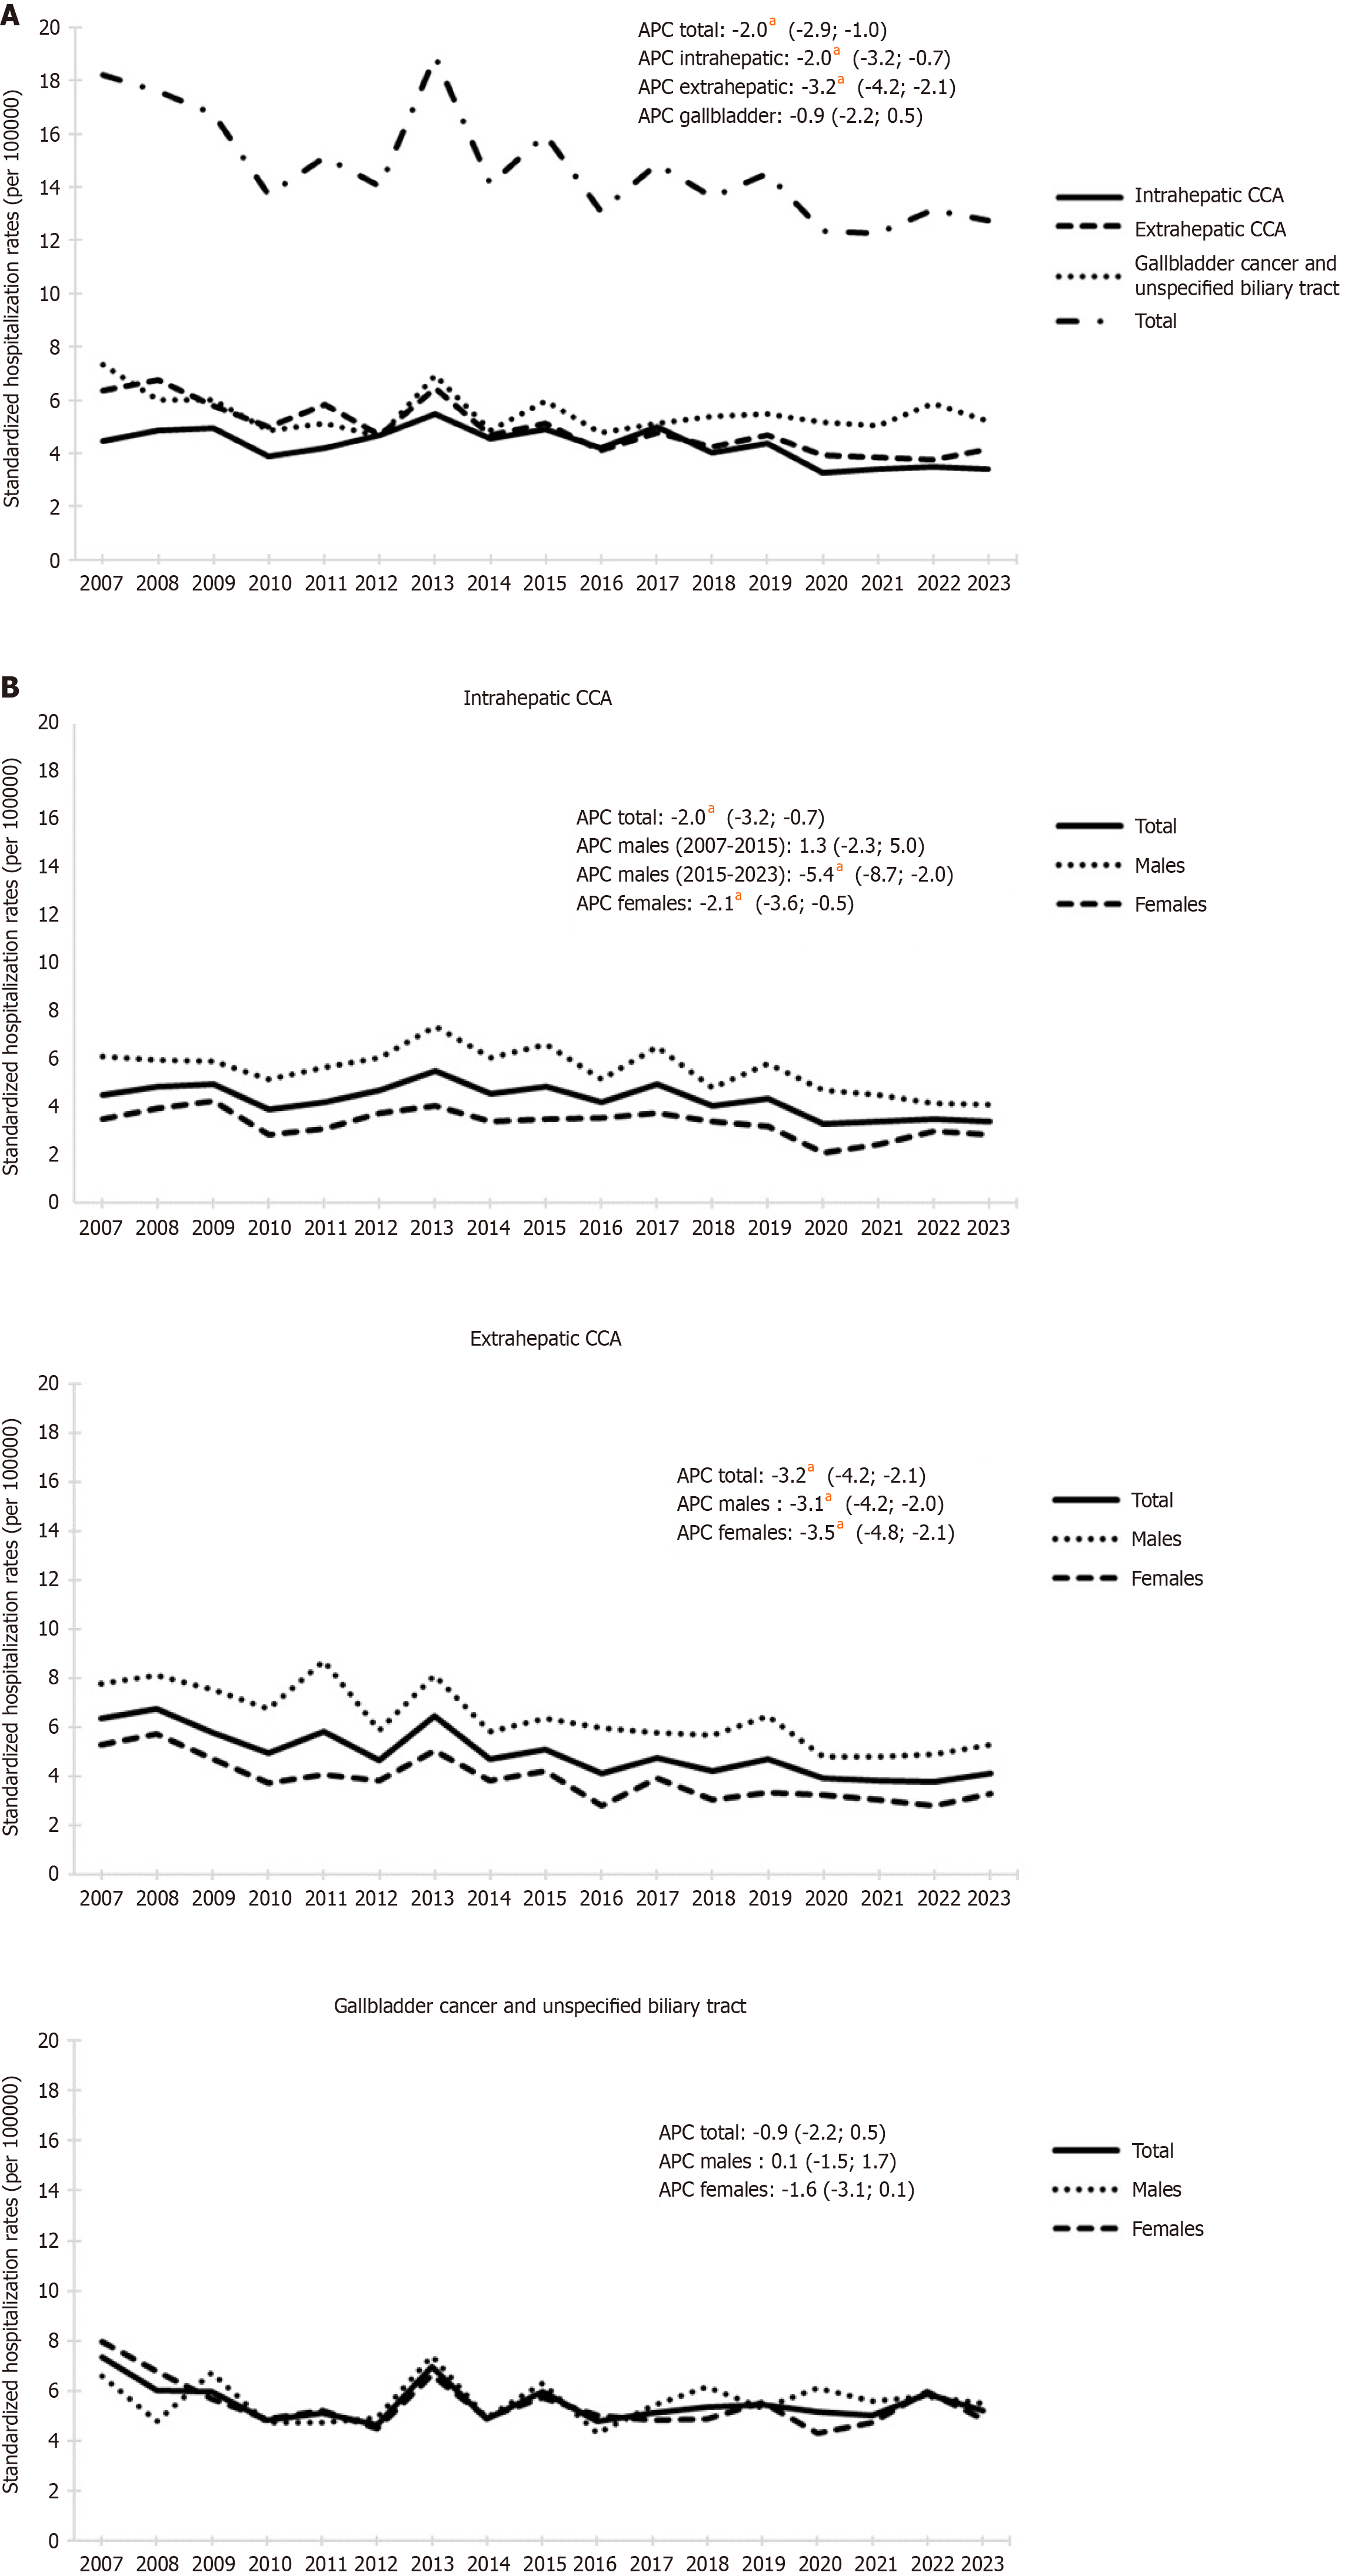
Figure 1 Standardized annual hospitalization rates (per 100000 inhabitants) for biliary tract cancers.
A: On the basis of anatomical location; B: Stratified by type and gender. aSignificative trend (α = 0.05). CCA: Cholangiocarcinoma; APC: Annual percentage change.
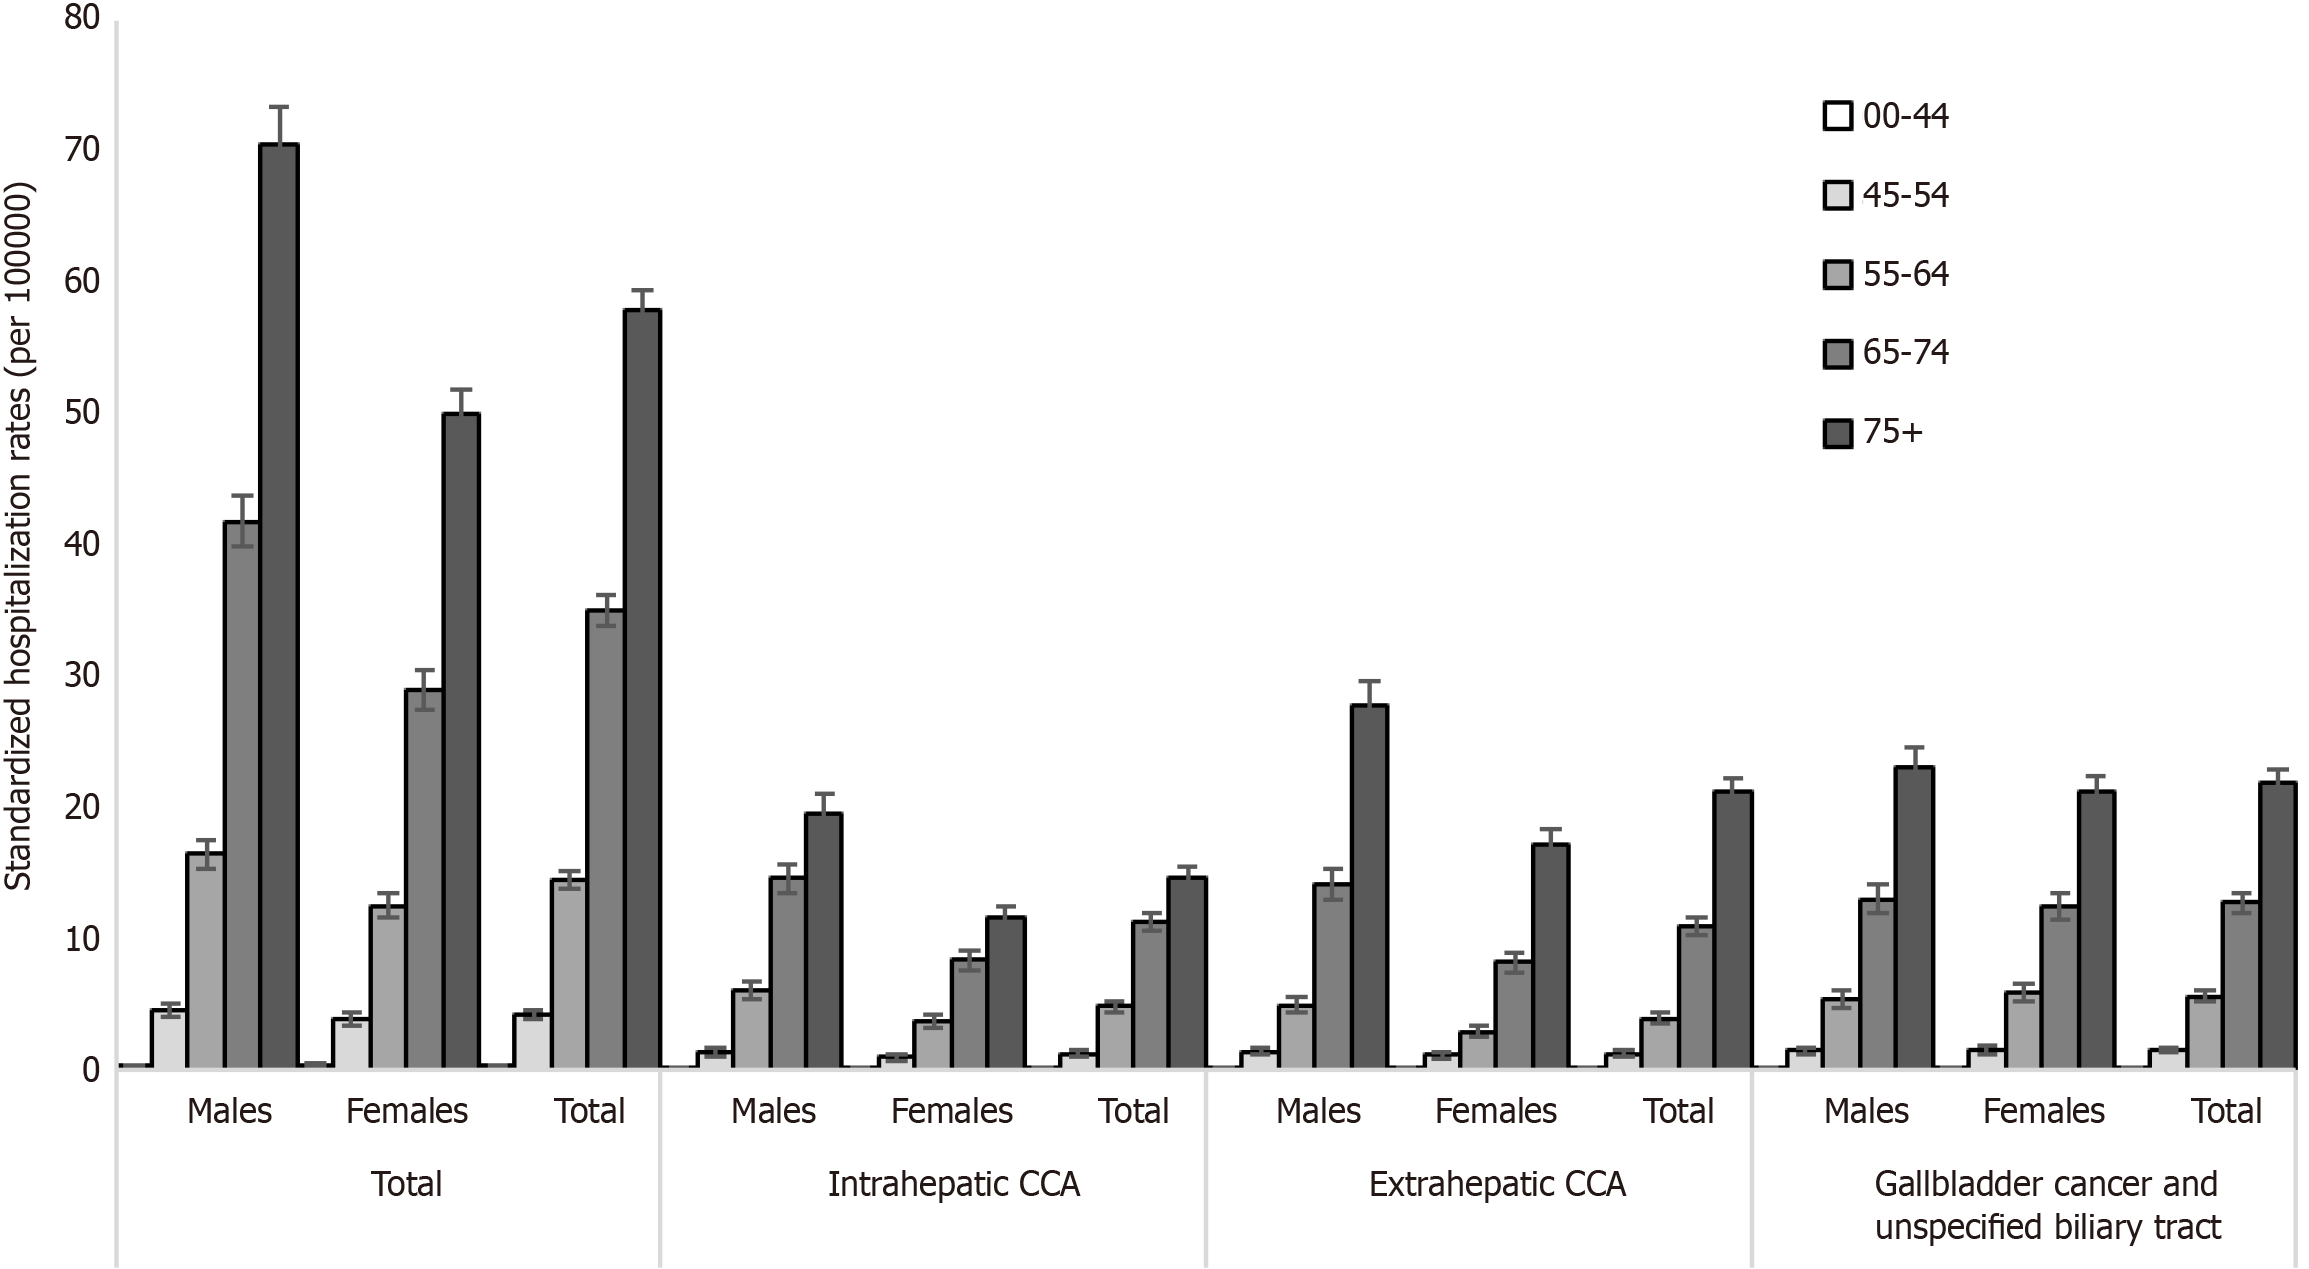
Figure 2 Standardized hospitalization rates (per 100000 inhabitants) for biliary tract cancers by type, gender, and age group (2007-2023).
CCA: Cholangiocarcinoma.
- Citation: Baldo V, Cozza A, Grego V, Furlan P, Cozzolino C, Saia M, Cocchio S, Floreani A. Epidemiological trends of cholangiocarcinoma and gallbladder cancer in Northeastern Italy: Administrative analysis over a 17-year period (2007-2023). World J Gastrointest Oncol 2025; 17(5): 104229
- URL: https://www.wjgnet.com/1948-5204/full/v17/i5/104229.htm
- DOI: https://dx.doi.org/10.4251/wjgo.v17.i5.104229


